
A c c e s s i b i l i t y :
Keyboard Navigation
73. Which of the following statements is correct?
74. Noncash gifts

7-42
75. If you receive a gift whose market price is $20, but you consider it to be worth only $10,
then
76. According to economists, gift registries, returning gifts for cash refunds, and “recycling
gifts”
77. (Consider This) When the federal government started requiring restaurants to print calorie
counts next to menu items,
A. restaurants changed their prices, systematically lowering prices for healthier items and
raising prices for high-calorie entrees.

7-43
Copyright © 2018 McGraw-Hill Education. All rights reserved. No reproduction or distribution without the prior
written consent of McGraw-Hill Education.
B. there was no meaningful change in consumption behavior, indicating that marginal utility is
driven solely by tastes for the food items and not by health information.
C. consumption of higher calorie items decreased, suggesting consumers’ marginal utility for
these items dropped.
D. consumption of higher-calorie items increased, contrary to the law’s objective.
AACSB: Knowledge Application
A c c e s s i b i l i t y :
Keyboard Navigation
Blooms: Remember
Di f f i c u l ty : 0 1 Ea s y
Gr a d a b l e : au t o m a t i c
Learning Objective: 07–01 Define and explain the relationship between total utility,
marginal utility, and the law of diminishing marginal utility.
Test Bank: I
Topic: Law of Diminishing Marginal Utility
78. (Consider This) When the federal government started requiring restaurants to print calorie
counts next to menu items, some people increased their consumption of higher-calorie items.
Whichof the following best explains this phenomenon?
A. Consumers at restaurants are systematically irrational.
79. (Last Word) Theft and burglary
D. are less economically rational than crimes of passion and violence.

7-44
Copyright © 2018 McGraw-Hill Education. All rights reserved. No reproduction or distribution without the prior
written consent of McGraw-Hill Education.
AACSB: Knowledge Application
A c c e s s i b i l i t y :
Keyboard Navigation
Blooms: Understand
D i f f i c u l t y : 0 2 M e d i u m
G r a d a b l e : a u t o m a t i c
Learning Objective: 07–02 Describe how rational consumers maximize utility by
comparing the marginal utility-to-price ratios of all the products they could possibly
purchase.
Test Bank: I
Topic: Theory of Consumer Behavior
80. (Last Word) Most people do not steal, because
A. stolen goods are subject to the law of diminishing marginal utility.
81. (Last Word) All of the following would reduce property crime by increasing its “price,”
except
A. imposing greater penalties for those who are caught and convicted.

7-45
Copyright © 2018 McGraw-Hill Education. All rights reserved. No reproduction or distribution without the prior
written consent of McGraw-Hill Education.
purchase.
Test Bank: I
Topic: Theory of Consumer Behavior
True / False Questions
82. If marginal utility is diminishing, total utility must also be declining.
83. Marginal utility is total utility divided by the number of units consumed.
84. When total utility is at a maximum, marginal utility is zero.

7-46
Copyright © 2018 McGraw-Hill Education. All rights reserved. No reproduction or distribution without the prior
written consent of McGraw-Hill Education.
Test Bank: I
Topic: Law of Diminishing Marginal Utility
85. When a consumer shifts purchases from X to Y, the marginal utility of X falls and the
marginal utility of Y rises.
86. The limited money income of consumers results in a so-called budget constraint.
87. A rational consumer will cease purchasing a product at that quantity where marginal utility
begins to diminish.

7-47
Copyright © 2018 McGraw-Hill Education. All rights reserved. No reproduction or distribution without the prior
written consent of McGraw-Hill Education.
Blooms: Understand
D i f f i c u l t y : 0 2 M e d i u m
G r a d a b l e : a u t o m a t i c
Learning Objective: 07–02 Describe how rational consumers maximize utility by
comparing the marginal utility-to-price ratios of all the products they could possibly
purchase.
Test Bank: I
Topic: Theory of Consumer Behavior
88. When a consumer has maximized total utility, he or she cannot increase total utility by
reallocating expenditures among different products.
89. When the price of a product falls, the income effect induces the consumer to purchase more
of it, while the substitution effect prompts her to buy less.
90. The consumer demand curve for a product is downsloping because marginal utility is

constant when price declines.
91. The income effect explains an exception to the law of demand.
92. The substitution effect suggests that when consumers judge product quality by price, they
will substitute high-priced products for low-priced products.

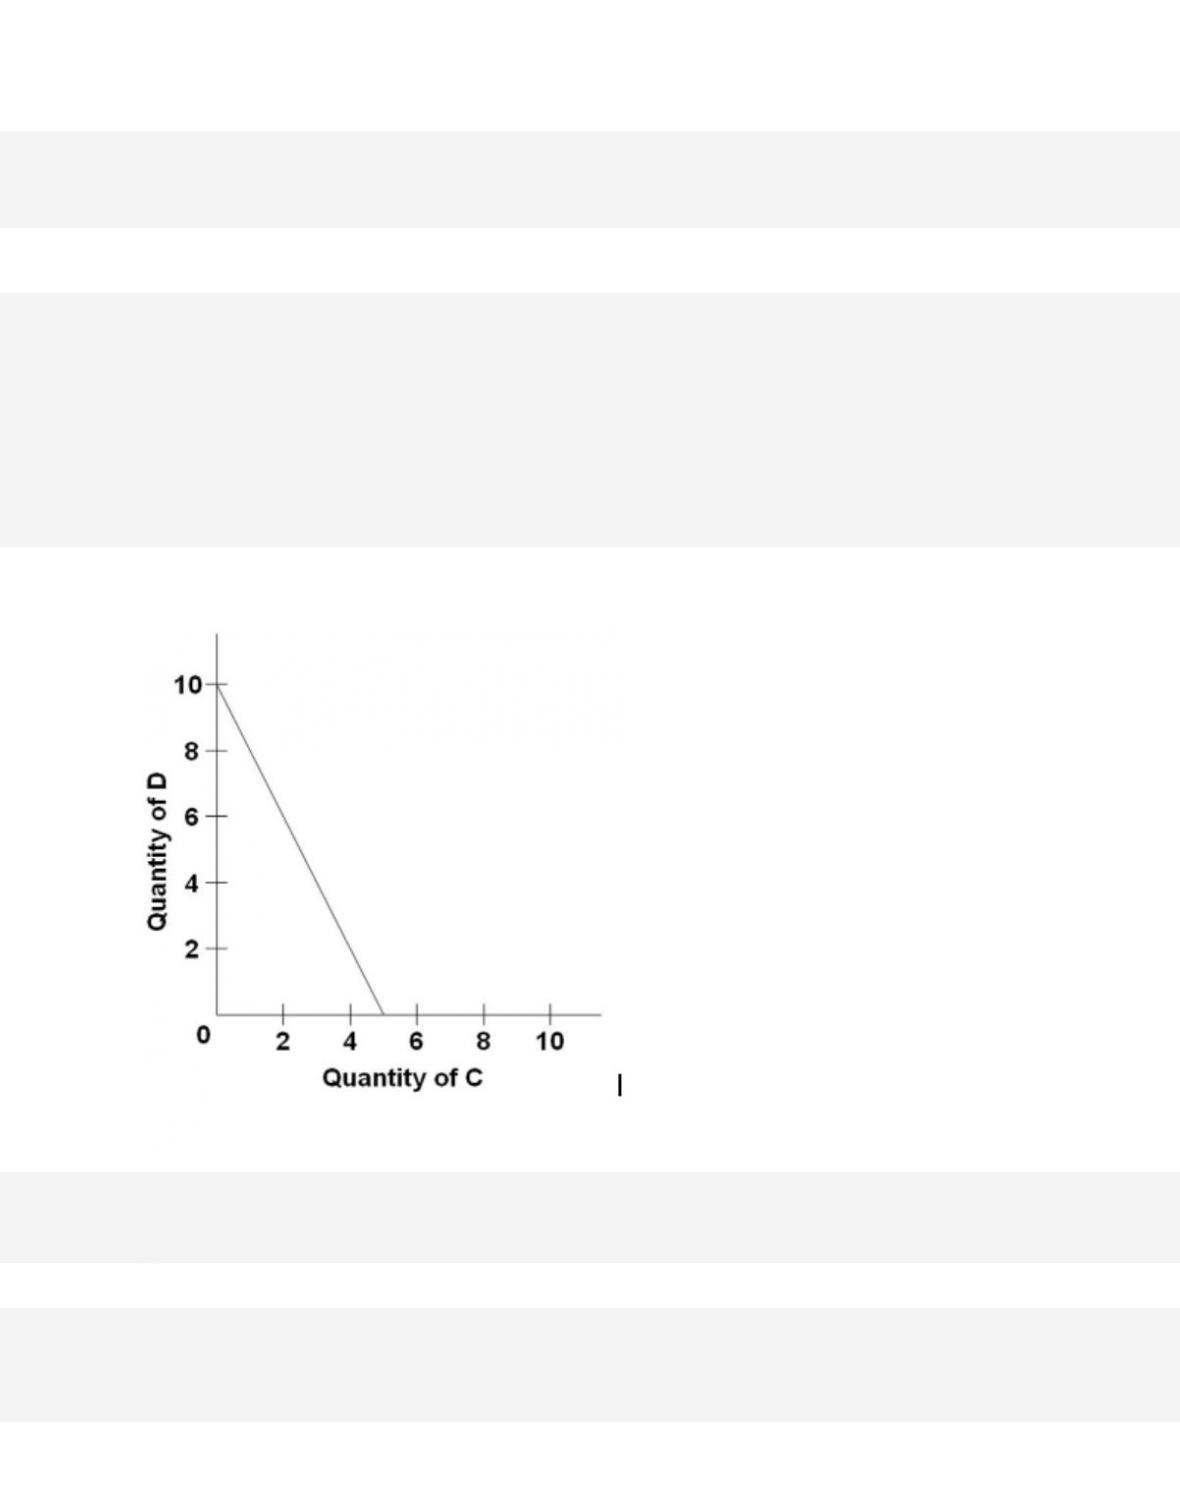
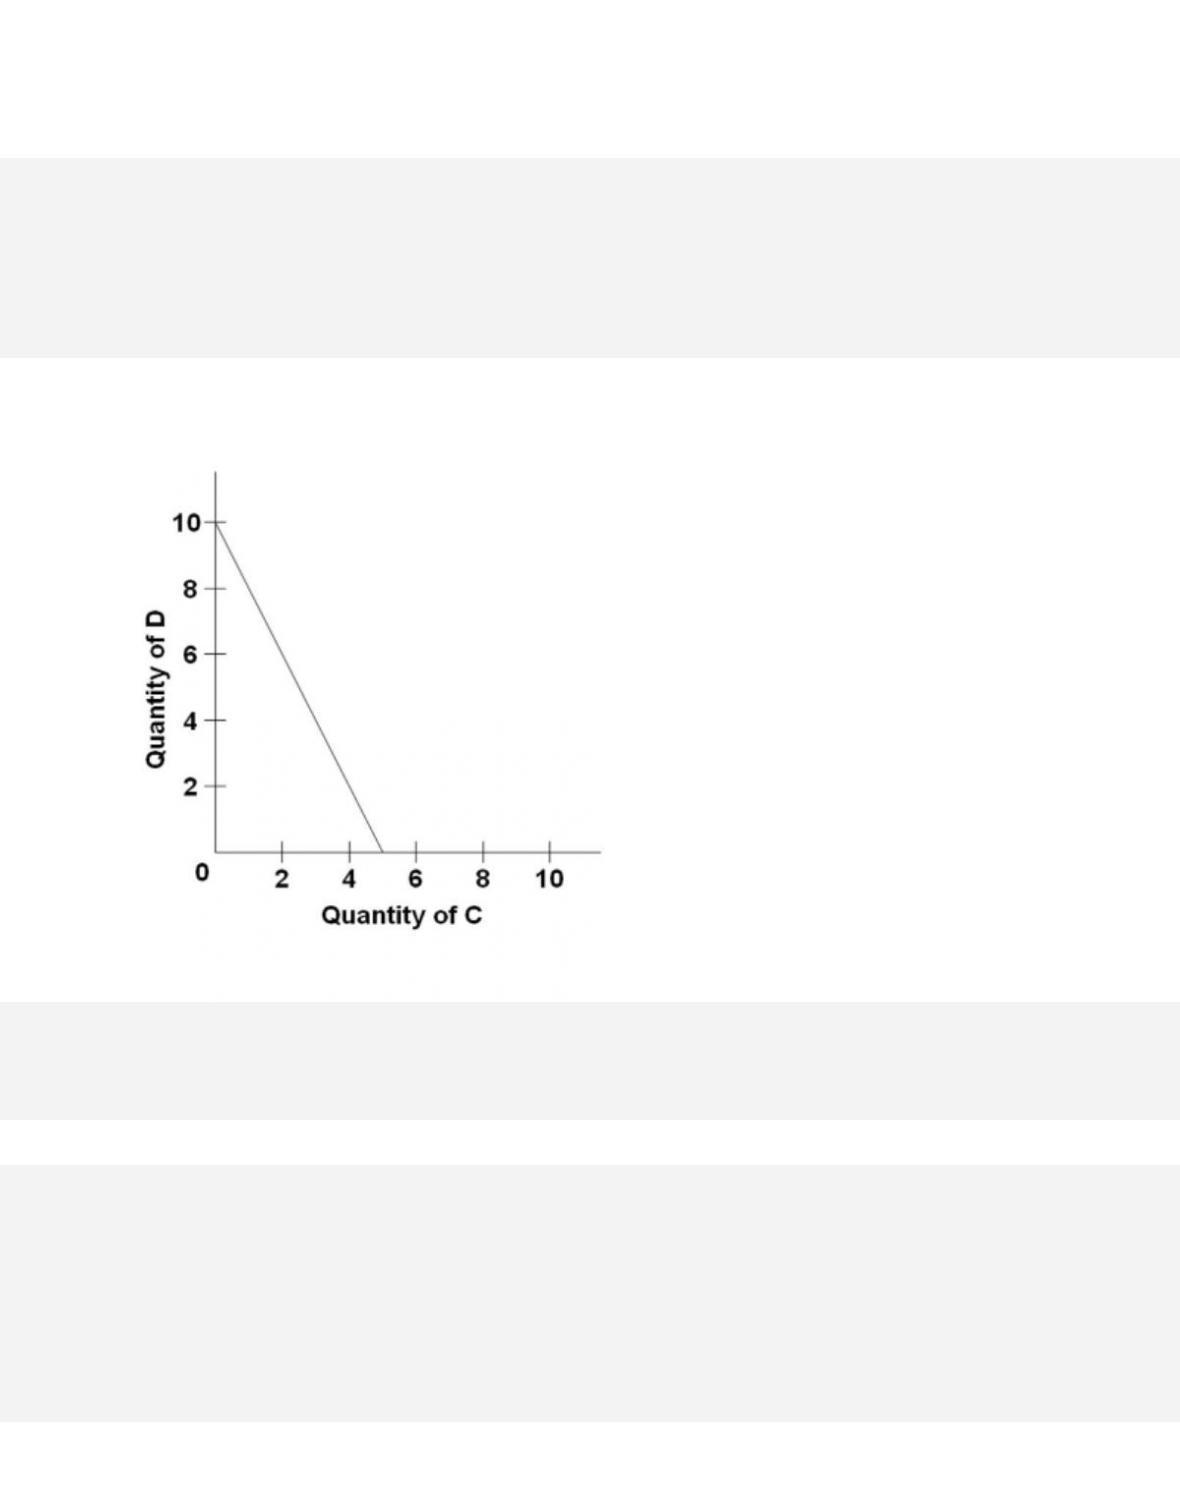
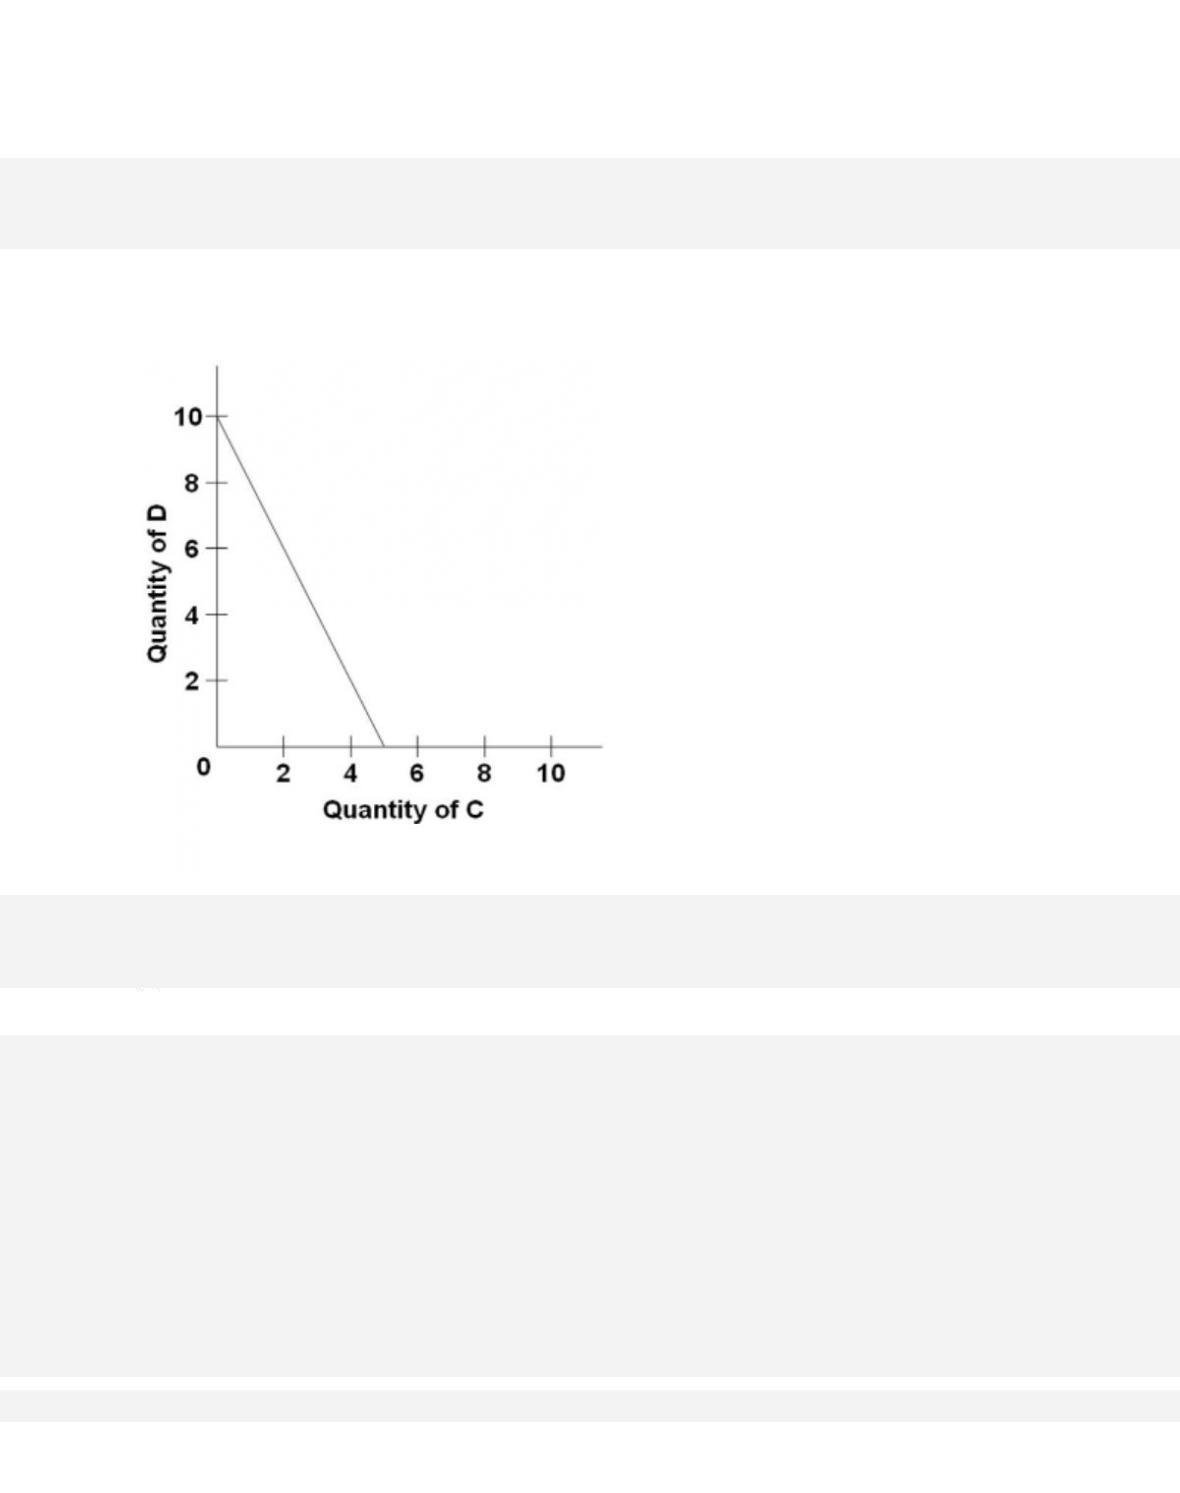
7-49
Copyright © 2018 McGraw-Hill Education. All rights reserved. No reproduction or distribution without the prior
written consent of McGraw-Hill Education.
the income and substitution effects of a price change.
Test Bank: I
Topic: Income and Substitution Effects
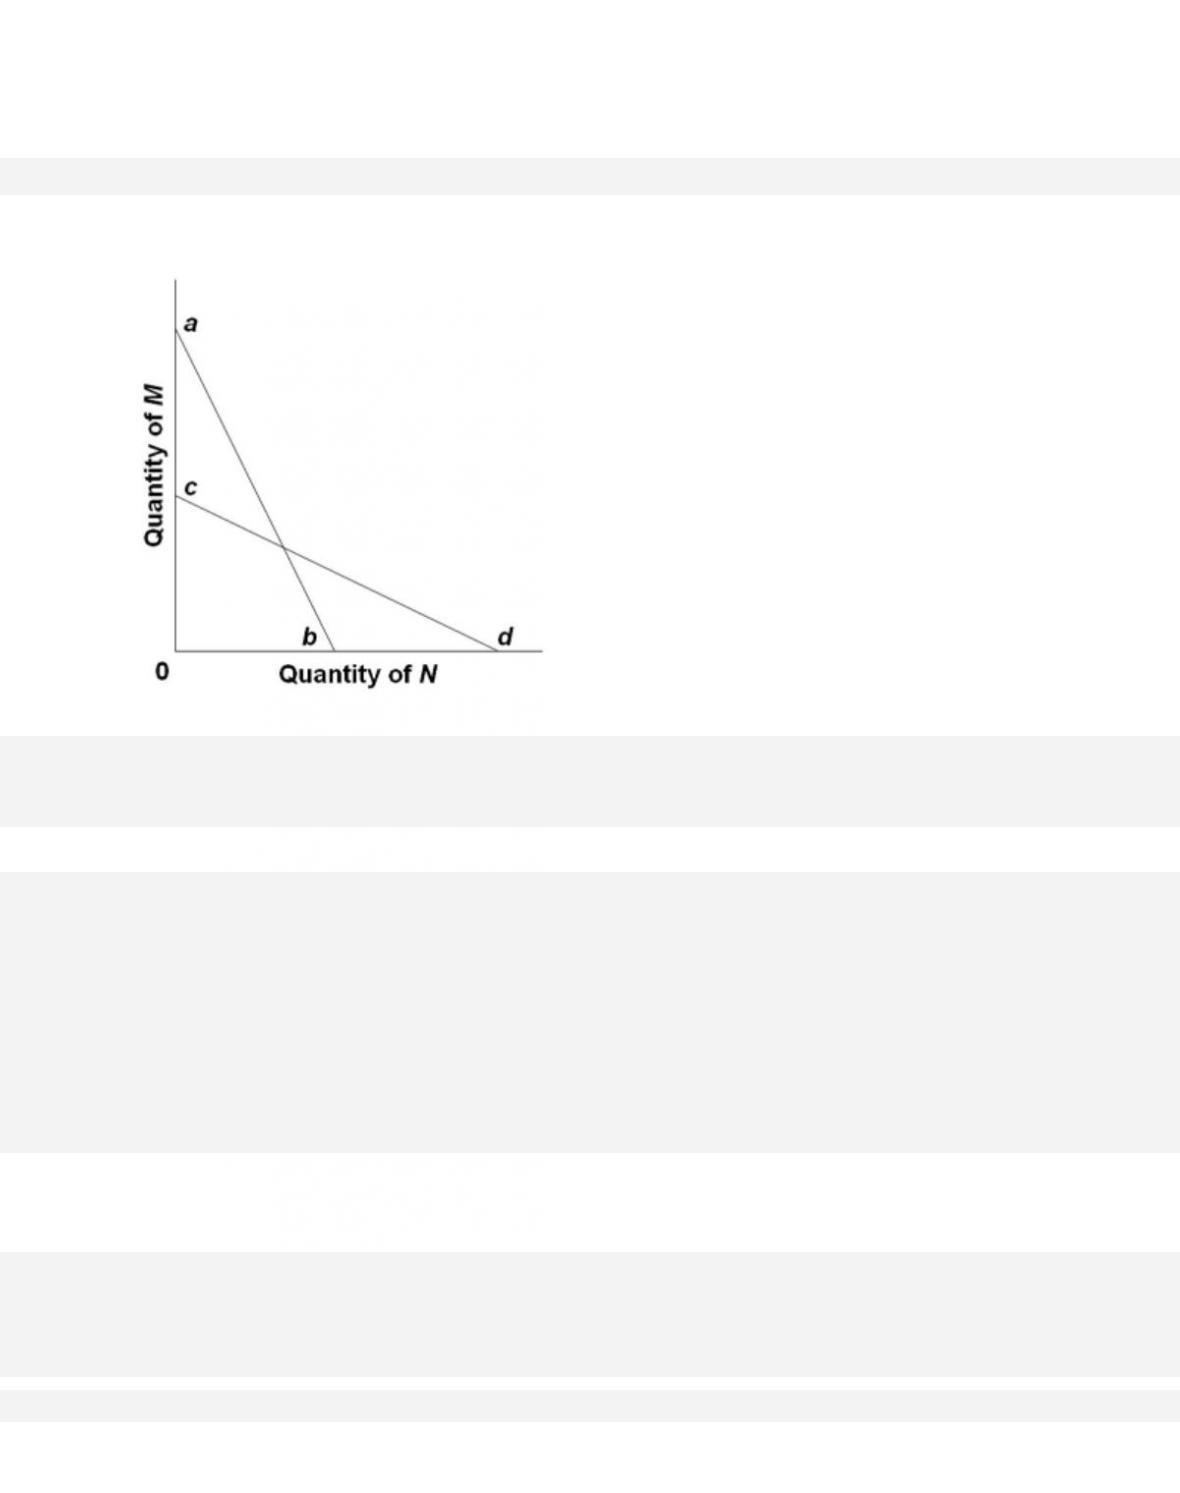
Topic:
Utility Maximization and the Demand Curve
93. Noncash gift-giving involves value loss when the marginal utility of the gift to the receiver
is less than the product price.
Multiple Choice Questions
94. The budget line shows
95. Which of the following statements is not correct?
7-50
Copyright © 2018 McGraw-Hill Education. All rights reserved. No reproduction or distribution without the prior
written consent of McGraw-Hill Education.
B. A reduction in money income accompanied by an increase in product prices will necessarily
shift the budget line to the left.
C. An increase in product prices will shift the budget line to the left.
D. An increase in money income will shift the budget line to the right.
96. Refer to the budget line shown in the diagram. If the consumer’s money income is $20, the
7-51
Copyright © 2018 McGraw-Hill Education. All rights reserved. No reproduction or distribution without the prior
written consent of McGraw-Hill Education.
Blooms: Understand
D i f f i c u l t y : 0 2 M e d i u m
G r a d a b l e : a u t o m a t i c
Learning Objective: 07–06 Appendix: Relate how the indifference curve model of
consumer behavior derives demand curves from budget lines, indifference curves, and
utility maximization.
Test Bank: I
Topic: Indifference Curve Analysis
97. Refer to the budget line shown in the diagram. Given the same money income, reductions in
the prices of both products C and D will
7-52
Copyright © 2018 McGraw-Hill Education. All rights reserved. No reproduction or distribution without the prior
written consent of McGraw-Hill Education.
utility maximization.
Test Bank: I
Topic: Indifference Curve Analysis
Type: Graph
98. Refer to the budget line shown in the diagram. The absolute value of the slope of the budget
line is

99. In moving along a given budget line,
100. Increases in product prices shift the consumer’s
101. A change in the slope of a budget line is solely the result of a change in
7-54
Copyright © 2018 McGraw-Hill Education. All rights reserved. No reproduction or distribution without the prior
written consent of McGraw-Hill Education.
A c c e s s i b i l i t y :
Keyboard Navigation
Blooms: Understand
D i f f i c u l t y : 0 2 M e d i u m
G r a d a b l e : a u t o m a t i c
Learning Objective: 07–06 Appendix: Relate how the indifference curve model of
consumer behavior derives demand curves from budget lines, indifference curves, and
utility maximization.
Test Bank: I
Topic: Indifference Curve Analysis
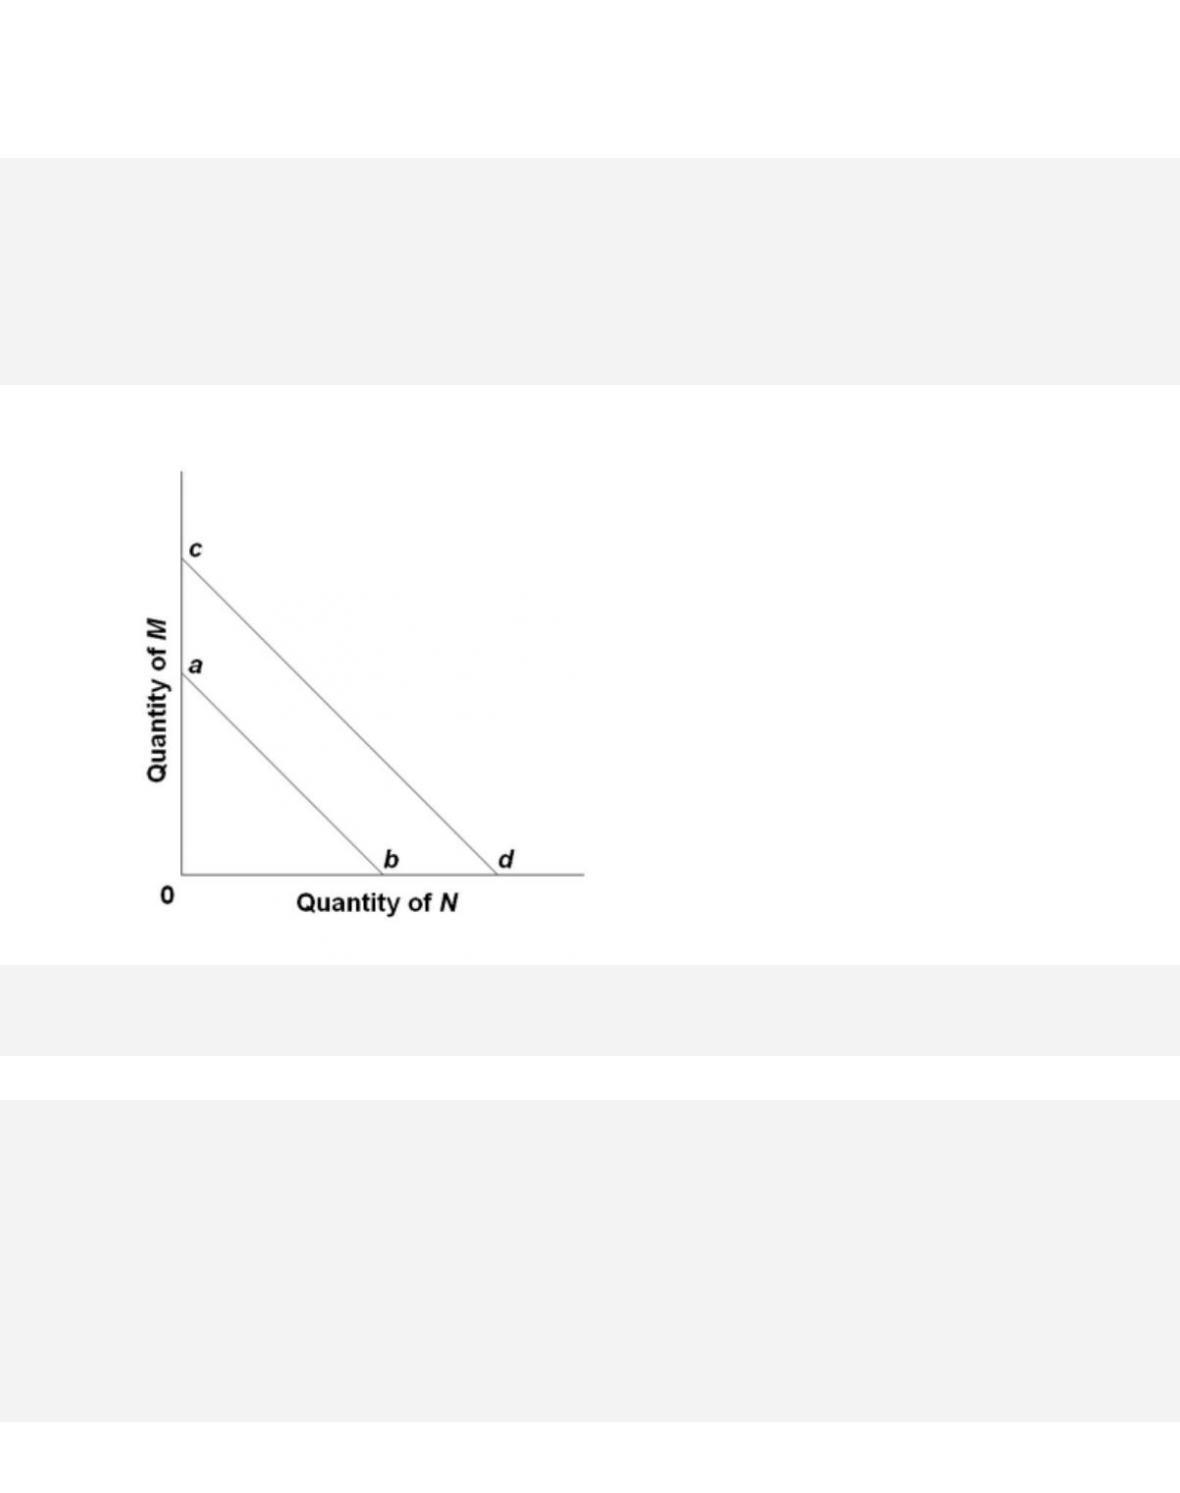
102. The shift of the budget line from cd to ab in the figure is consistent with
7-55
Copyright © 2018 McGraw-Hill Education. All rights reserved. No reproduction or distribution without the prior
written consent of McGraw-Hill Education.
Topic: Indifference Curve Analysis
Type: Graph
103. The budget line shift from ab to cd in the figure is consistent with
104. Any combination of goods lying outside of the budget line

7-56
105. If money income increases and the prices of products A and B both increase, then the
budget line
106. The movement of the budget line from BB to bb in the figure suggests that income has
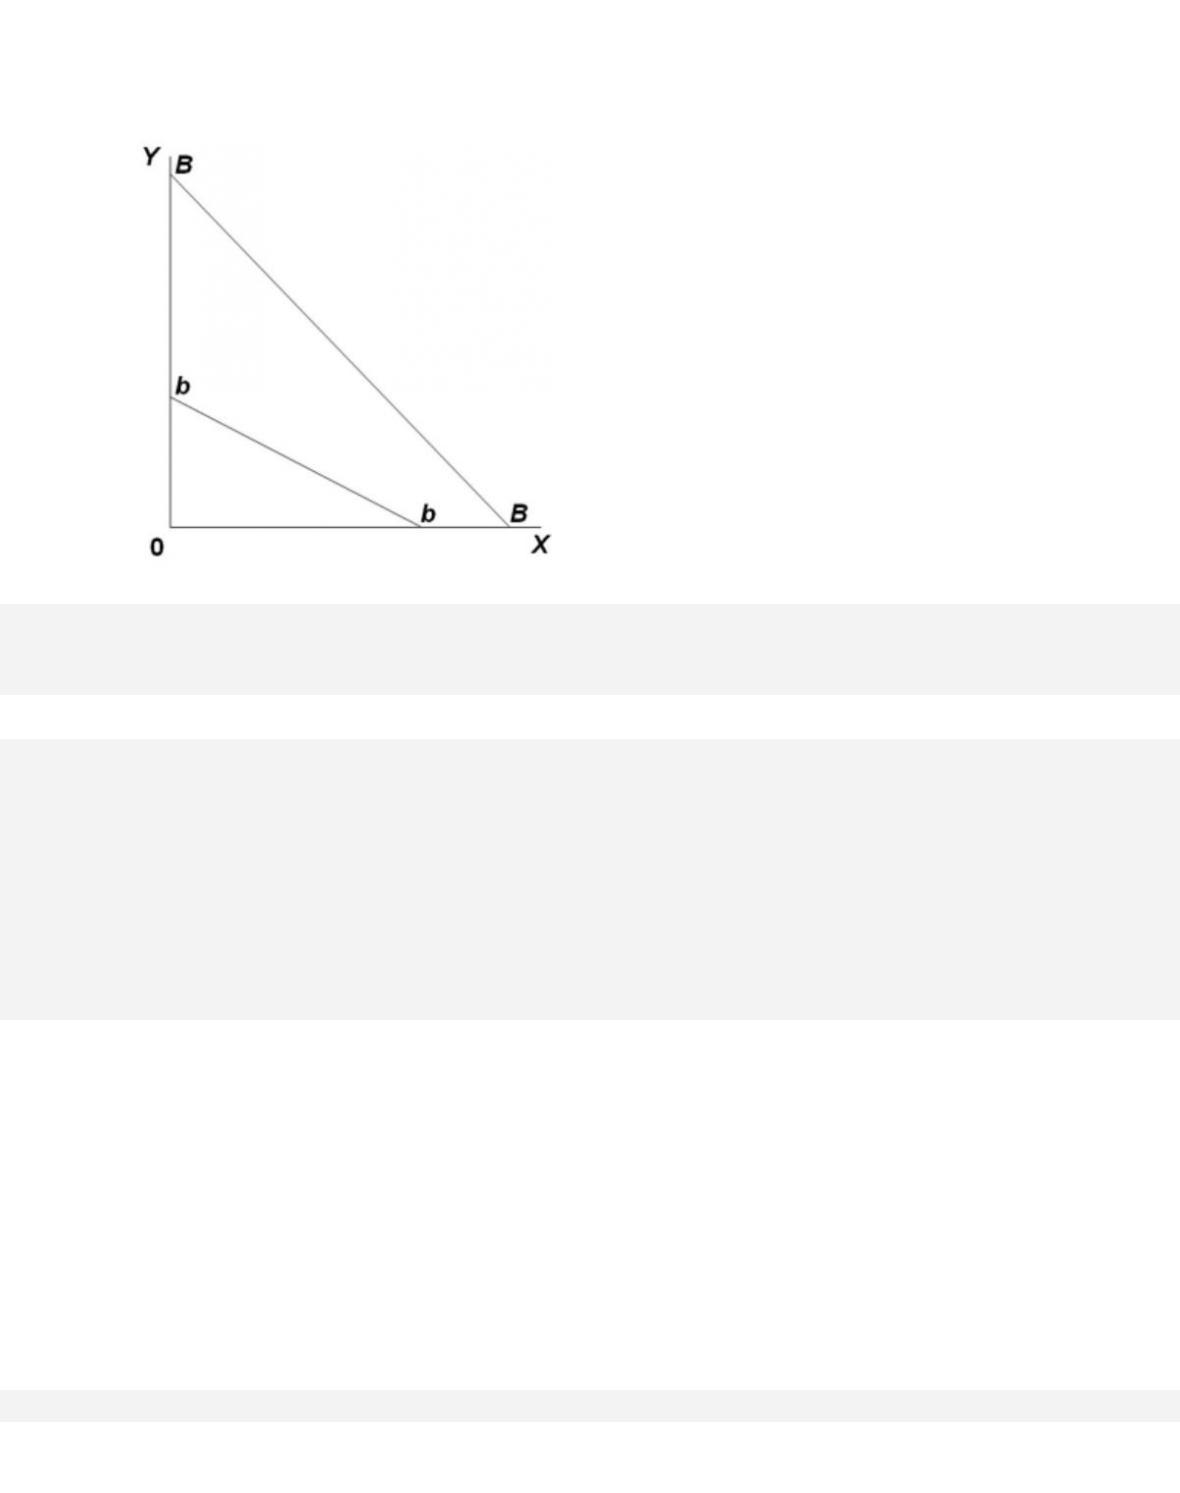
7-57
107. Suppose you have money income of $10, all of which you spend on Coke and popcorn. In
the diagram, the prices of Coke and popcorn, respectively, are
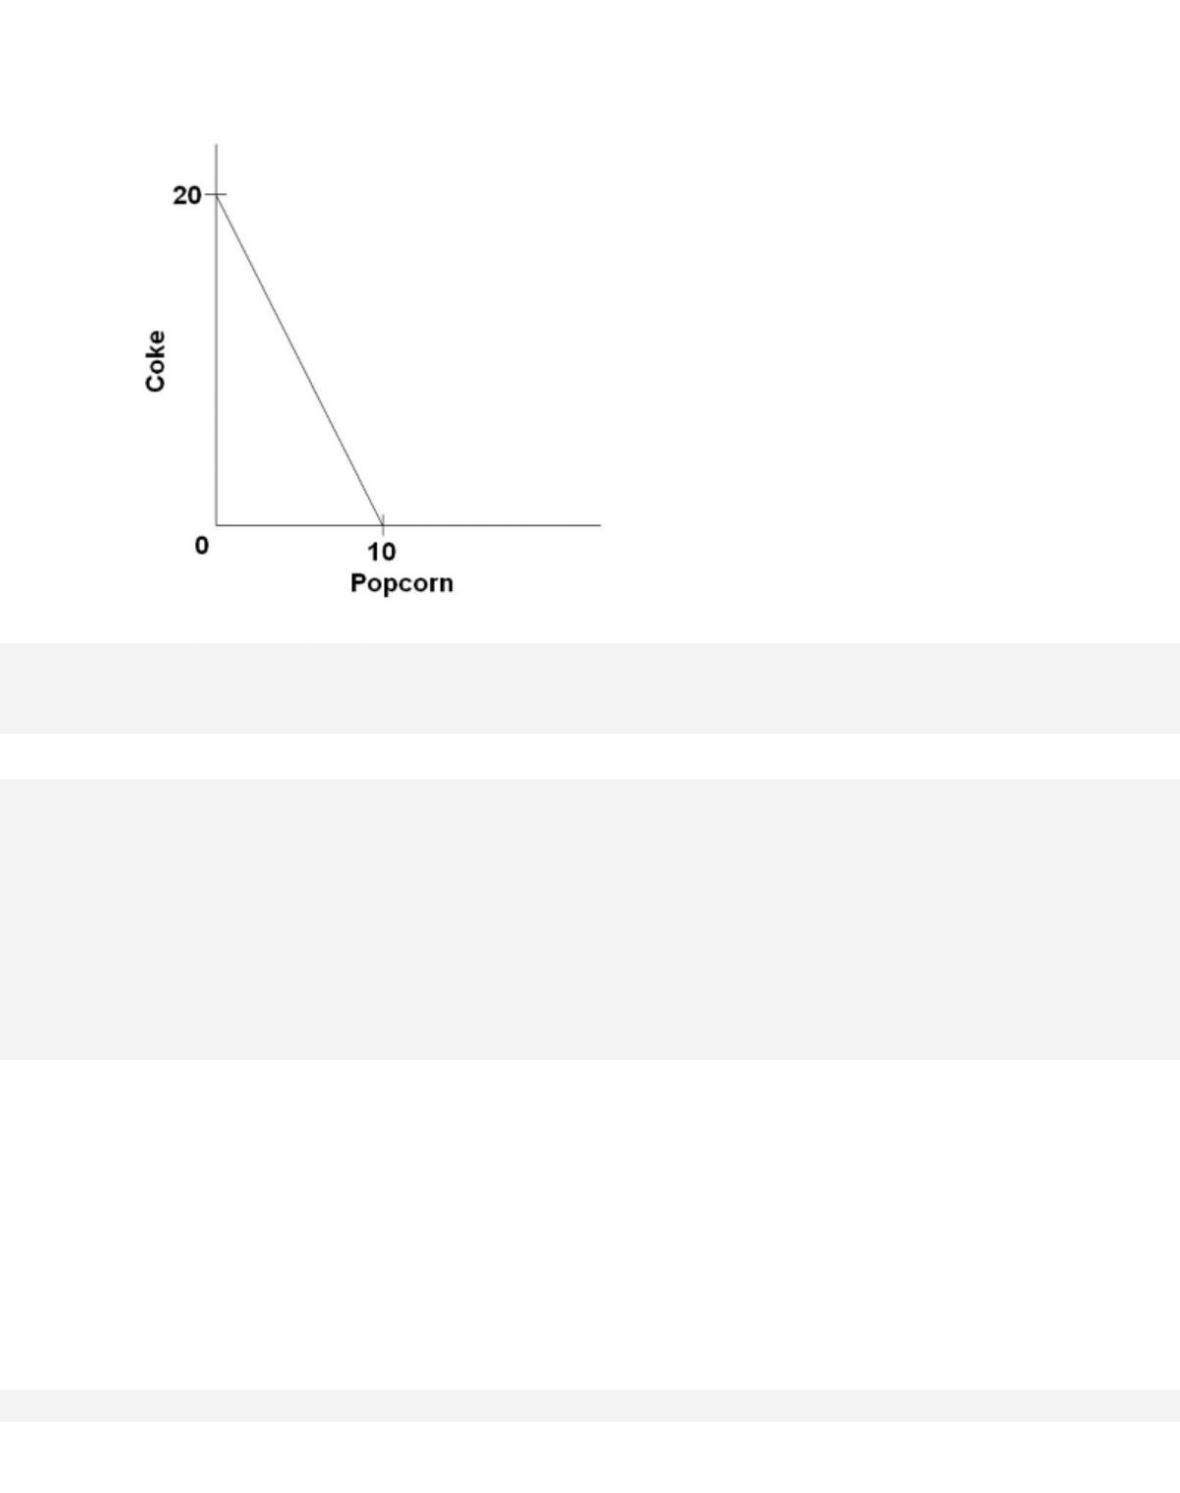
7-58
108. If the budget line shifts from BB to bb in the diagram, we can infer that the
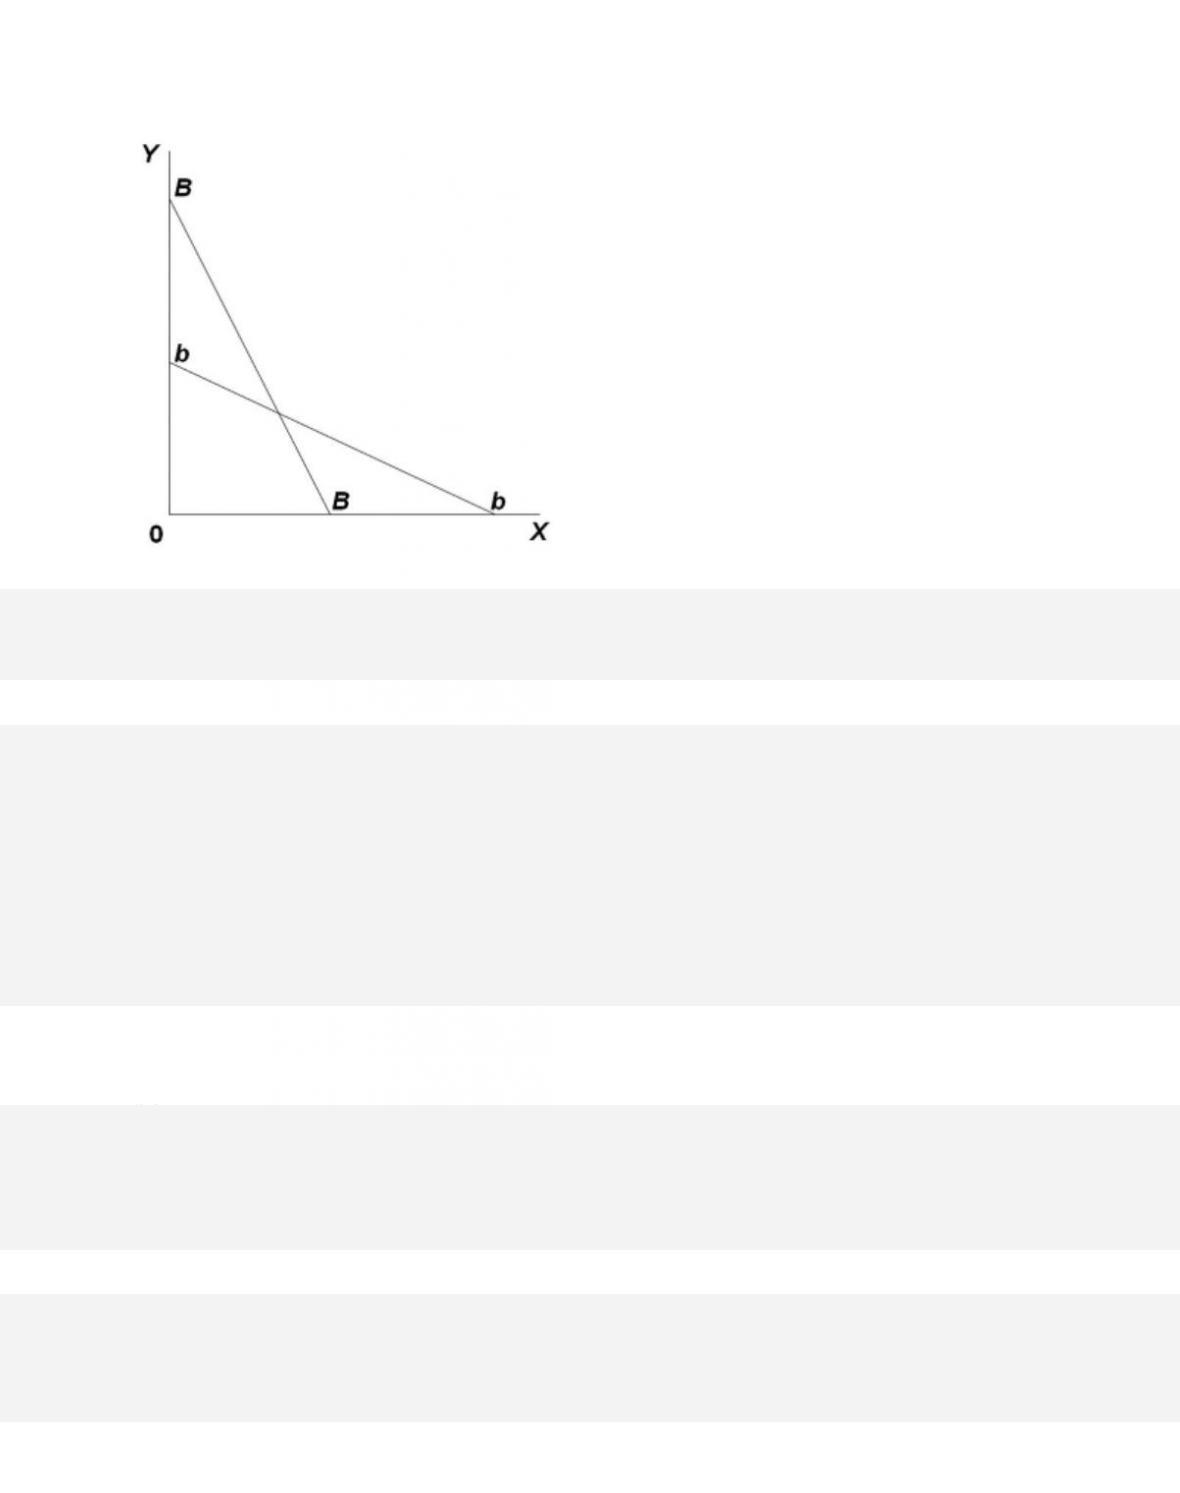
109. A budget line shows the

7-60
Copyright © 2018 McGraw-Hill Education. All rights reserved. No reproduction or distribution without the prior
written consent of McGraw-Hill Education.
Blooms: Understand
D i f f i c u l t y : 0 2 M e d i u m
G r a d a b l e : a u t o m a t i c
Learning Objective: 07–06 Appendix: Relate how the indifference curve model of
consumer behavior derives demand curves from budget lines, indifference curves, and
utility maximization.
Test Bank: I
Topic: Indifference Curve Analysis
110. The slope of a budget line reflects the
111. If the price of A is $12 and the price of B is $3, the budget line tells us that a consumer in
effect can trade