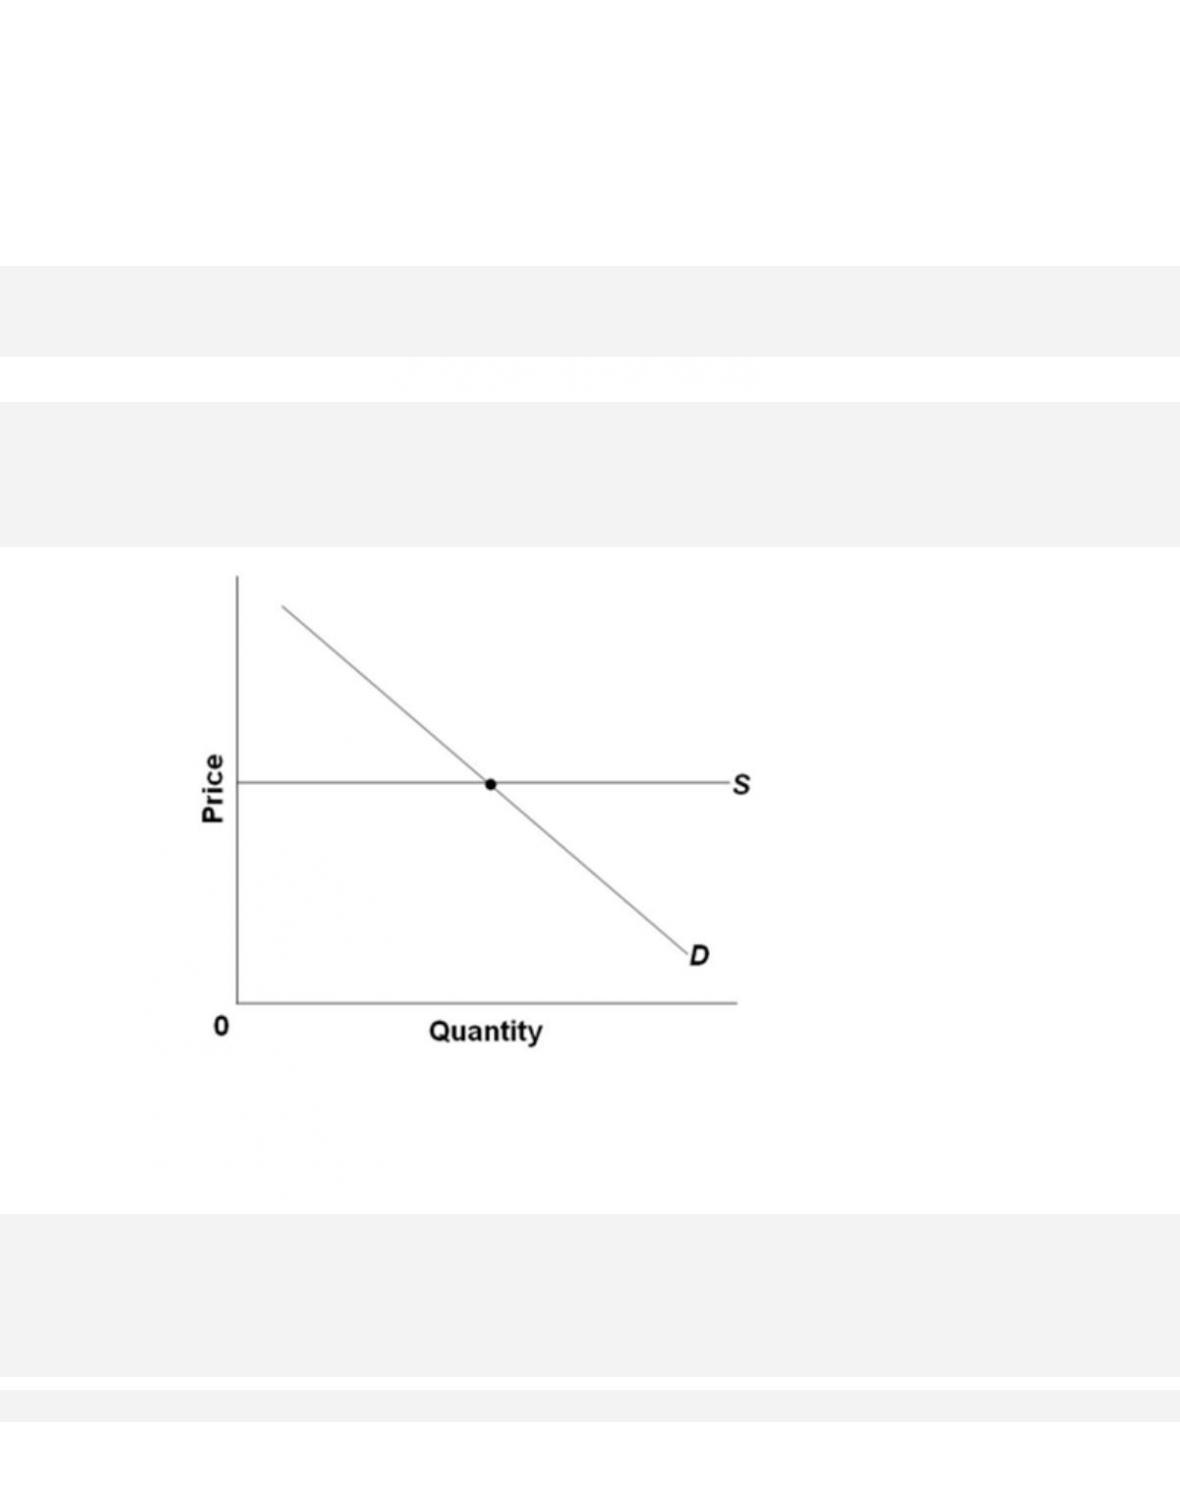
Refer to the above graph. Which of the following statements is correct?
280.
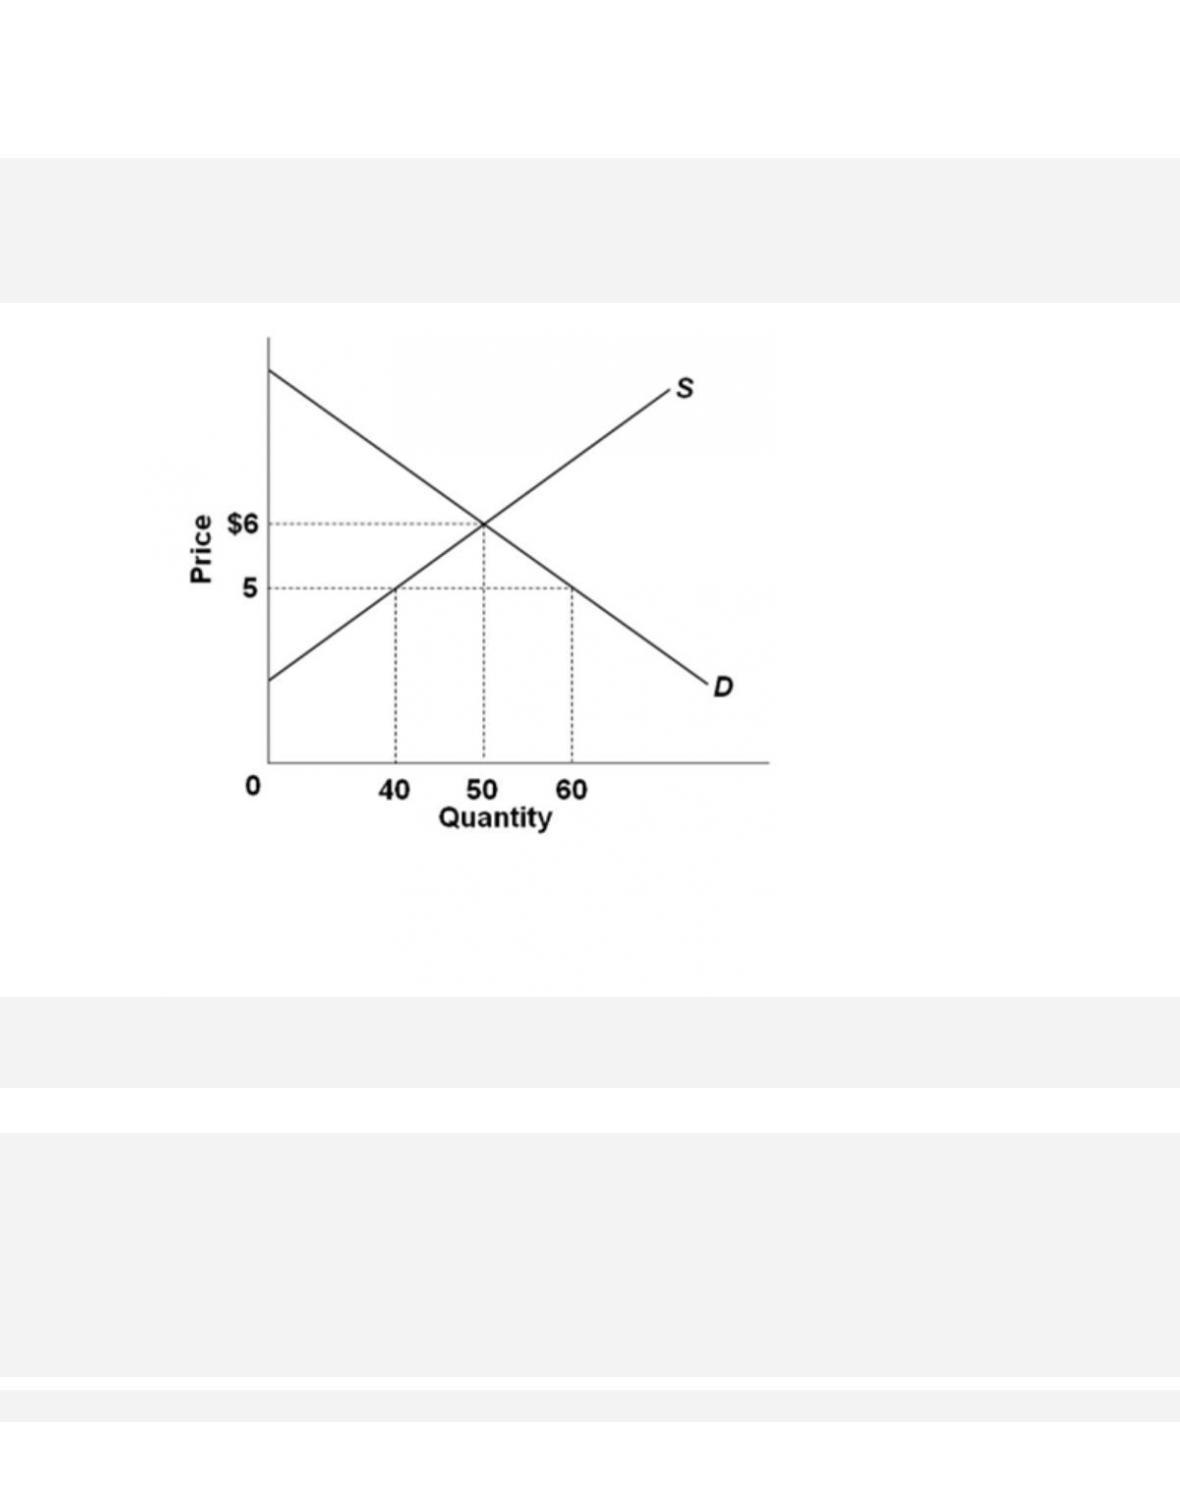
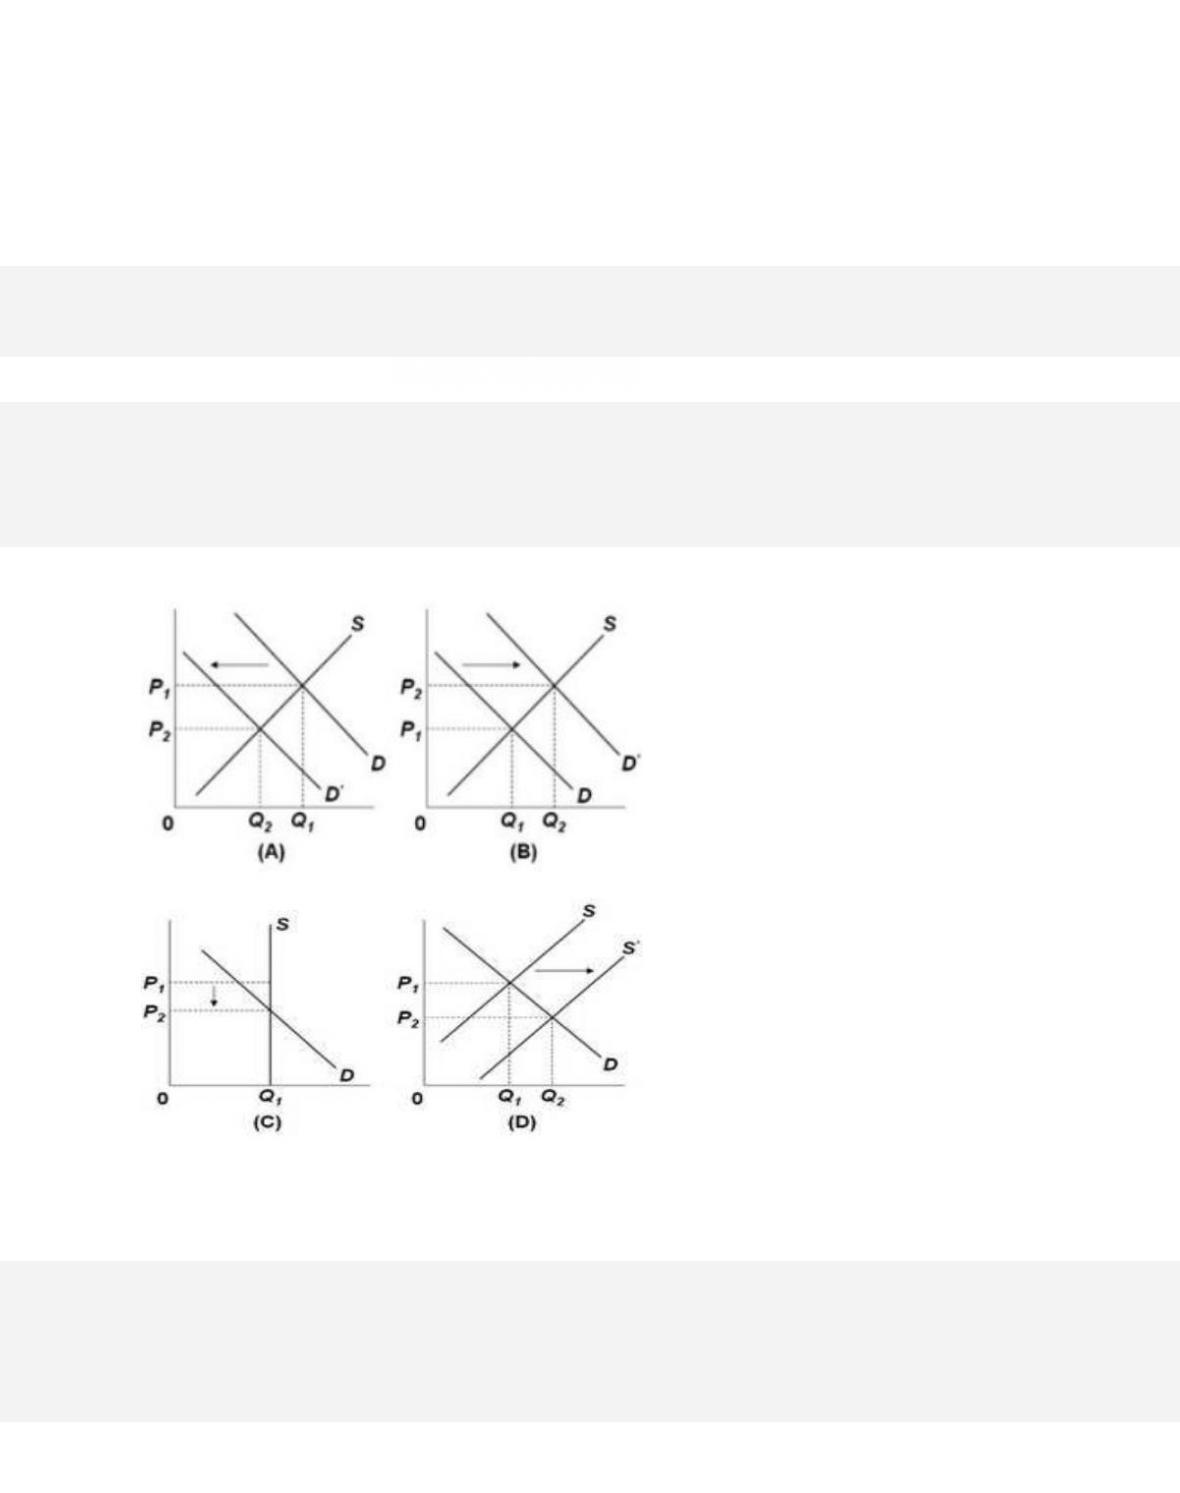
Refer to the above graph. If the demand increased, then
6-142
Copyright © 2018 McGraw-Hill Education. All rights reserved. No reproduction or distribution without the prior
written consent of McGraw-Hill Education.
AACSB: Knowledge Application
Blooms: Understand
Di ff ic ul t y:
02 Medium
Learning Objective: 06–04 Describe price elasticity of supply and how it can be applied.
Test Bank: II
Topic: Price Elasticity of Supply
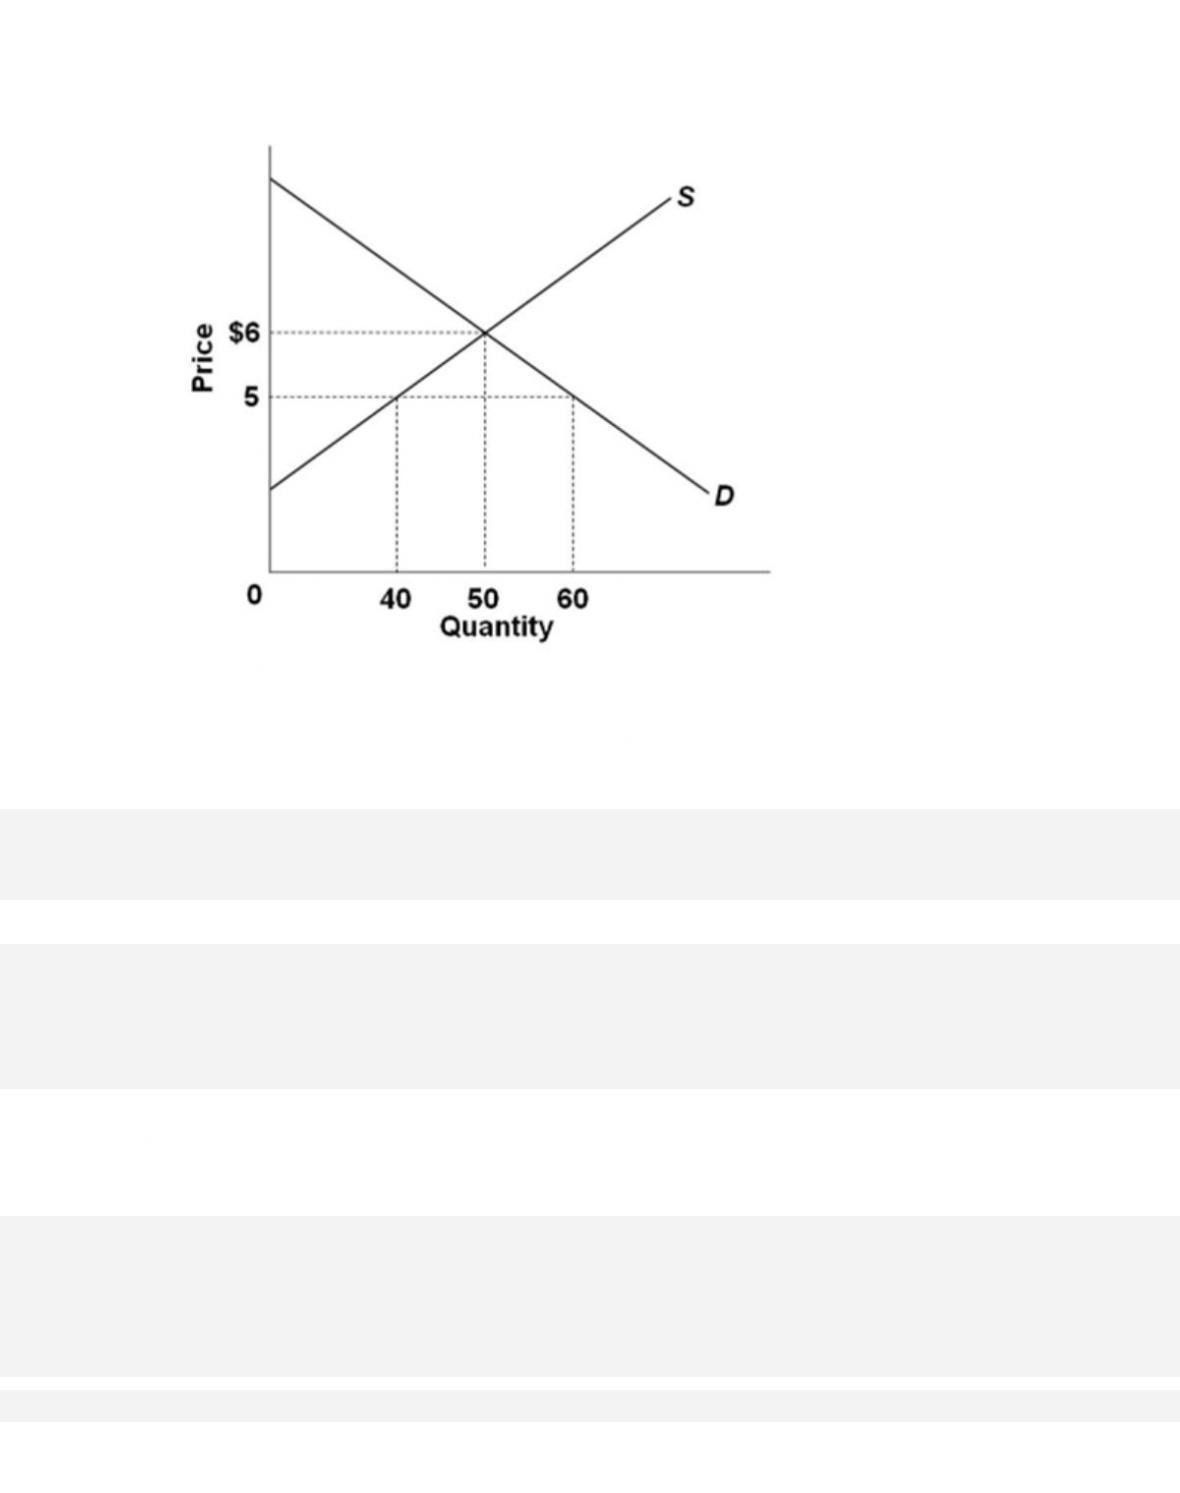
281.
Refer to the graph above. If demand decreases, then total revenues will
282.
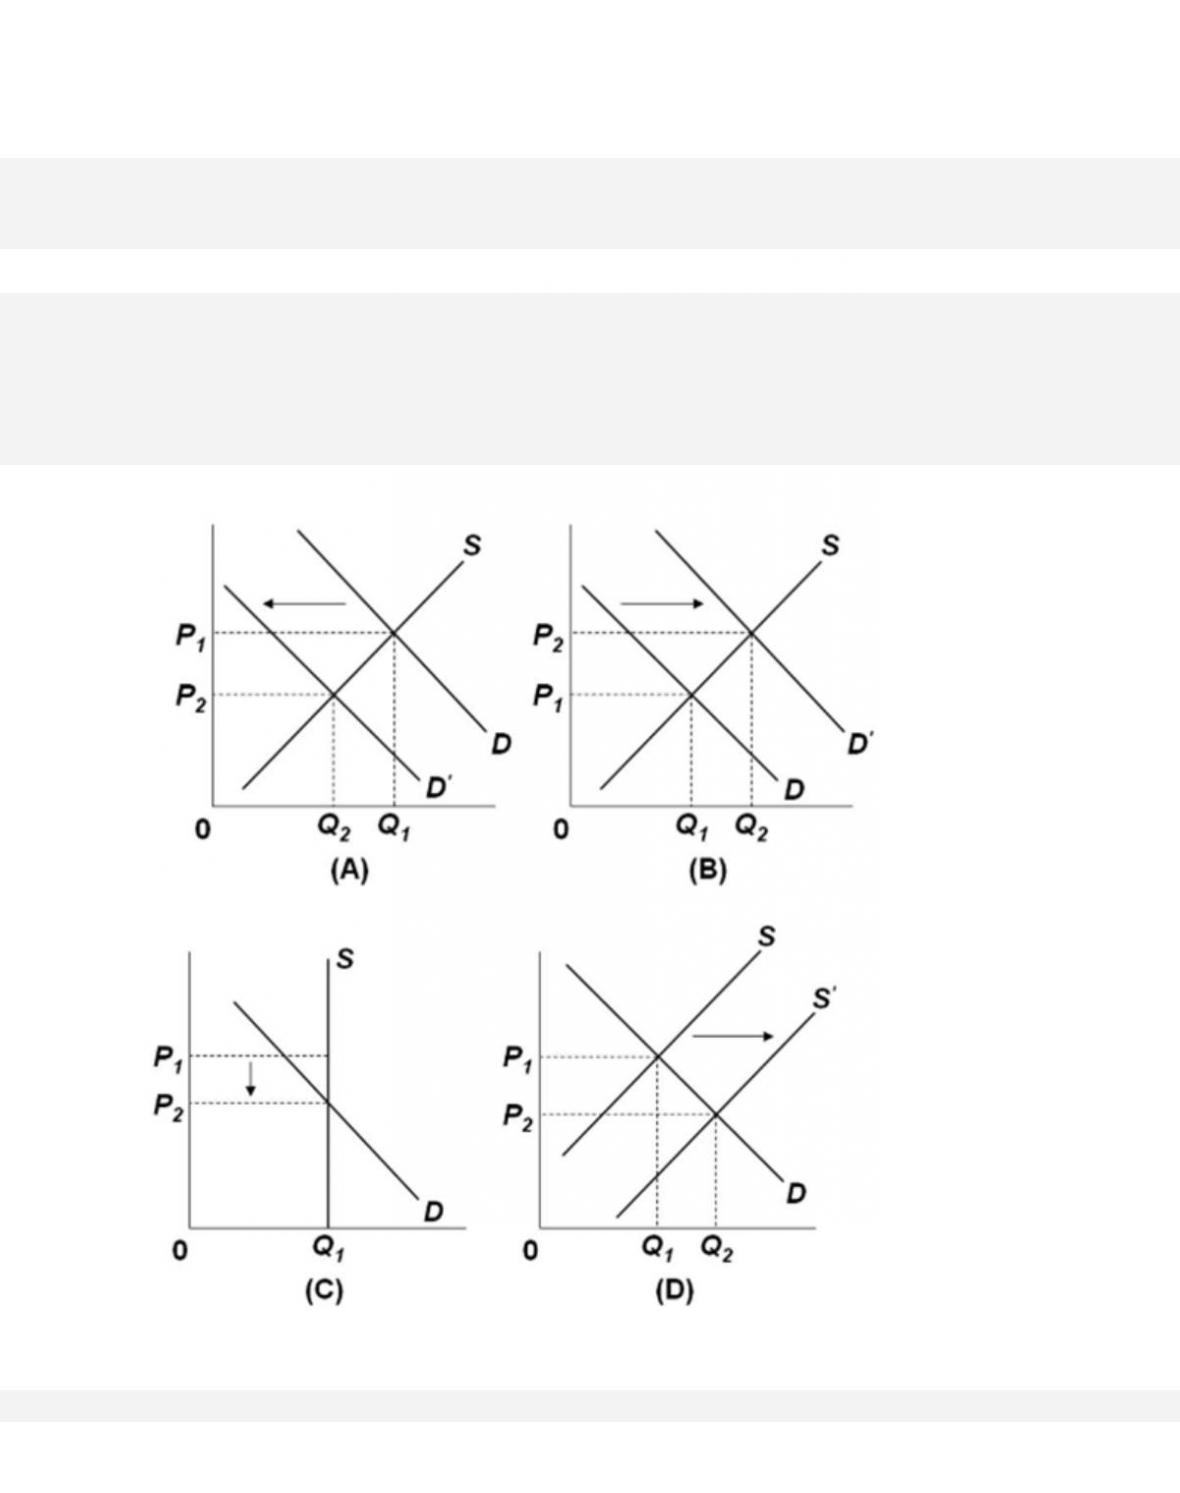
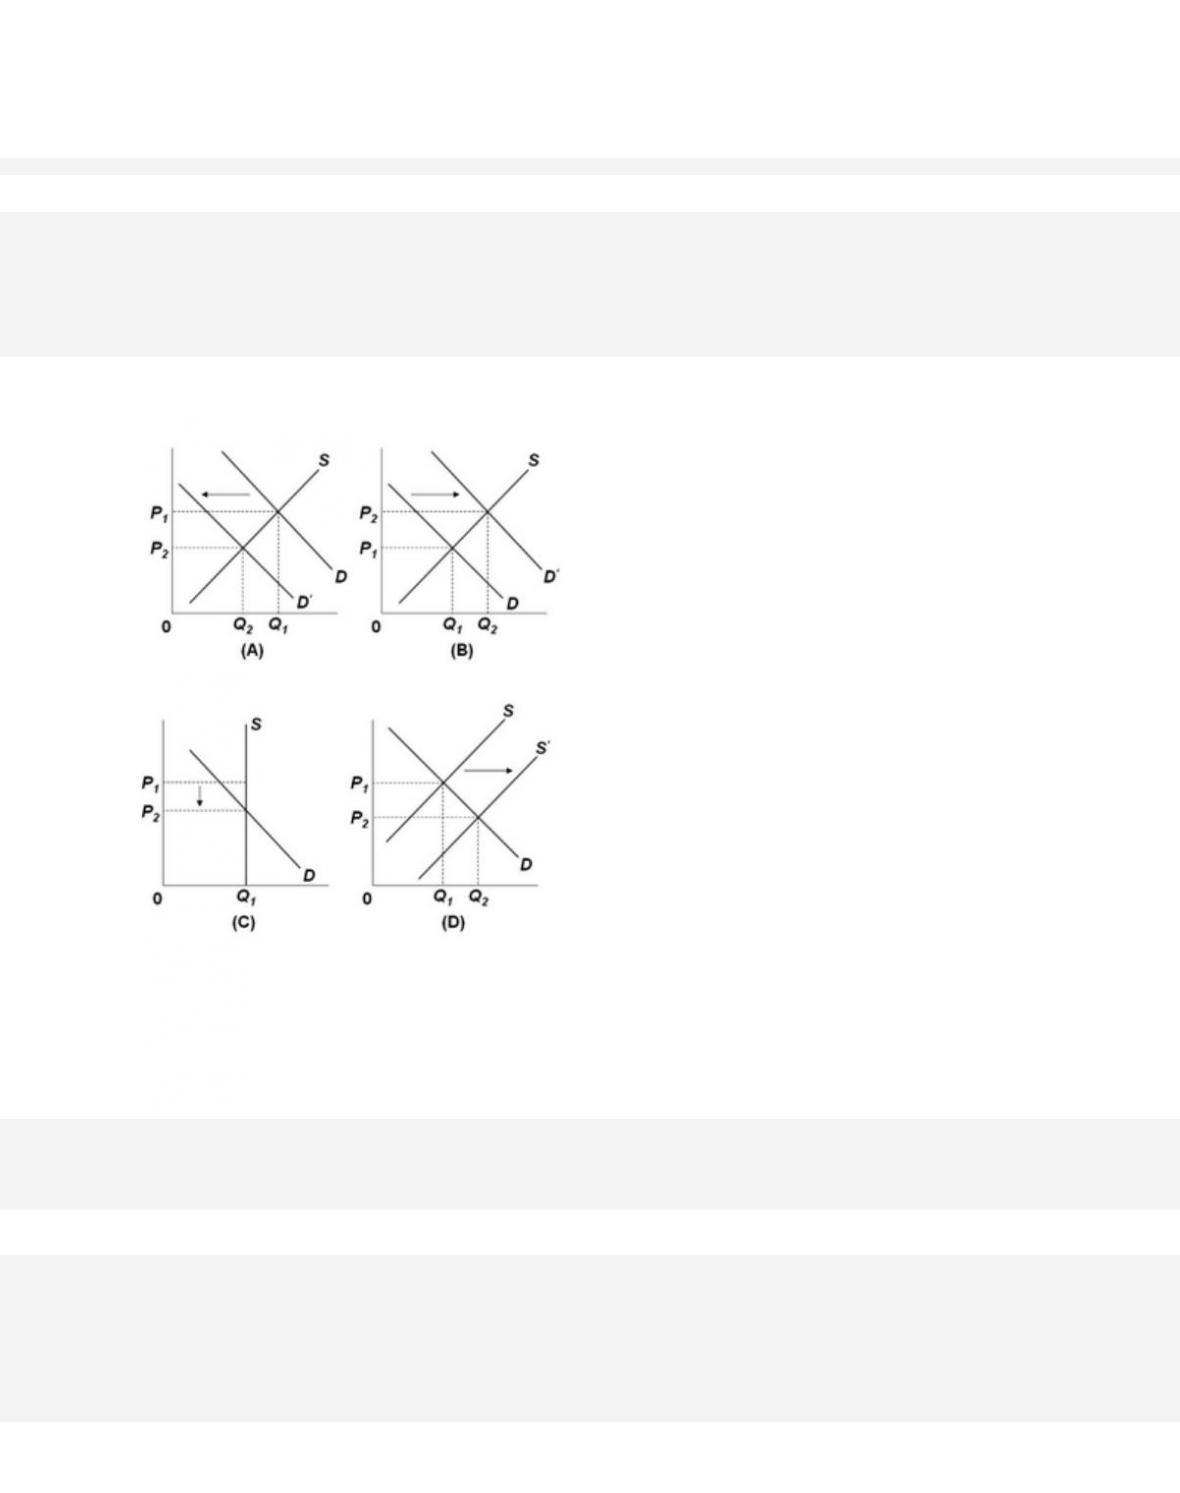
Refer to the graph above. The time horizon depicted in the graph
283.
Economists distinguish among the immediate market period, the short run, and the long
run by noting that

6-144
Copyright © 2018 McGraw-Hill Education. All rights reserved. No reproduction or distribution without the prior
written consent of McGraw-Hill Education.
AACSB: Knowledge Application
Acces sibili ty:
Keyboard Navigation
Blooms: Remember
Di ffi cul ty:
01 Easy
Learning Objective: 06–03 List the factors that affect price elasticity of demand and
describe some applications of price elasticity of demand.
Test Bank: II
Topic: Price Elasticity of Supply
284.
To economists, the main differences between “the short run” and “the long run” are that
285.
The supply of cars will be more elastic the
286.
Elasticity of supply will increase when
6-145
Copyright © 2018 McGraw-Hill Education. All rights reserved. No reproduction or distribution without the prior
written consent of McGraw-Hill Education.
B.
producers are given less time to respond to price changes.
C.
the number of consumers wanting to purchase a product increases.
D.
it becomes easier to substitute one factor of production for another in a manufacturing
process.
287.
Refer to the above graphs. For which graph is the supply perfectly inelastic?
288.
Refer to the above graphs. Which graph shows the immediate market period for supply?
6-147
Copyright © 2018 McGraw-Hill Education. All rights reserved. No reproduction or distribution without the prior
written consent of McGraw-Hill Education.
D. graph D
289.
Refer to the above graphs. Which graph depicts a situation where sellers are increasing their
output because their product is becoming more popular among buyers?

6-148
Copyright © 2018 McGraw-Hill Education. All rights reserved. No reproduction or distribution without the prior
written consent of McGraw-Hill Education.
Test Bank: II
Topic: Price Elasticity of Supply
290.
The price of gold is often volatile because
291.
The main reason for the high price of antiques is that
292.
A glass company making windows for houses also makes windows for other things
(cars, boats, stores, etc.). We would expect its supply curve for house windows to be

6-149
Copyright © 2018 McGraw-Hill Education. All rights reserved. No reproduction or distribution without the prior
written consent of McGraw-Hill Education.
Di ff ic ul t y:
02 Medium
Learning Objective: 06–04 Describe price elasticity of supply and how it can be applied.
Test Bank: II
Topic: Price Elasticity of Supply
293.
It is argued that, with a rising demand for college education, if the supply were to
become more elastic, then college tuition costs would
294.
Airlines charge business travelers more than leisure travelers because there is a more
295.
If a 10 percent increase in the price of good A results in an increase of 5 percent in the
quantity demanded of good B, then it can be concluded that goods A and B are

6-150
296.
If a 10 percent increase in the price of one good results in no change in the quantity
demanded of another good, then it can be concluded that the two goods are
297.
Cross elasticity of demand is
298.
The cross elasticity of demand between Quaker State motor oil and Texaco motor oil is
likely to be
299.
The cross elasticity of demand between digital cameras and memory cards is likely to
be
300.
A 3 percent increase in the price of tea causes a 6 percent increase in the demand for
coffee. The cross elasticity of demand for coffee with respect to the price of tea is

6-152
Copyright © 2018 McGraw-Hill Education. All rights reserved. No reproduction or distribution without the prior
written consent of McGraw-Hill Education.
Learning Objective: 06–05 Apply cross elasticity of demand and income elasticity of
demand.
Test Bank: II
Topic: Cross Elasticity and Income Elasticity of Demand
301.
The cross elasticity of demand for product X with respect to the price of product Y is
−1.2. It can be inferred that X and Y are
302.
Most goods can be classified as normal goods rather than inferior goods. The
definition of a normal good suggests that
303.
If the demand for a product increases proportionately faster than the increase in
consumers’ incomes, then the income elasticity of demand for the product is

6-153
Copyright © 2018 McGraw-Hill Education. All rights reserved. No reproduction or distribution without the prior
written consent of McGraw-Hill Education.
C.
less than zero.
D.
equal to 1.
304.
A negative income elasticity of demand coefficient indicates that
305.
The income elasticity of demand for food is roughly 1. A consumer‘s monthly income is
$2,000, of which 20 percent is spent on food. If the income of this consumer doubles, the
amount she’ll spend on food will be