206.
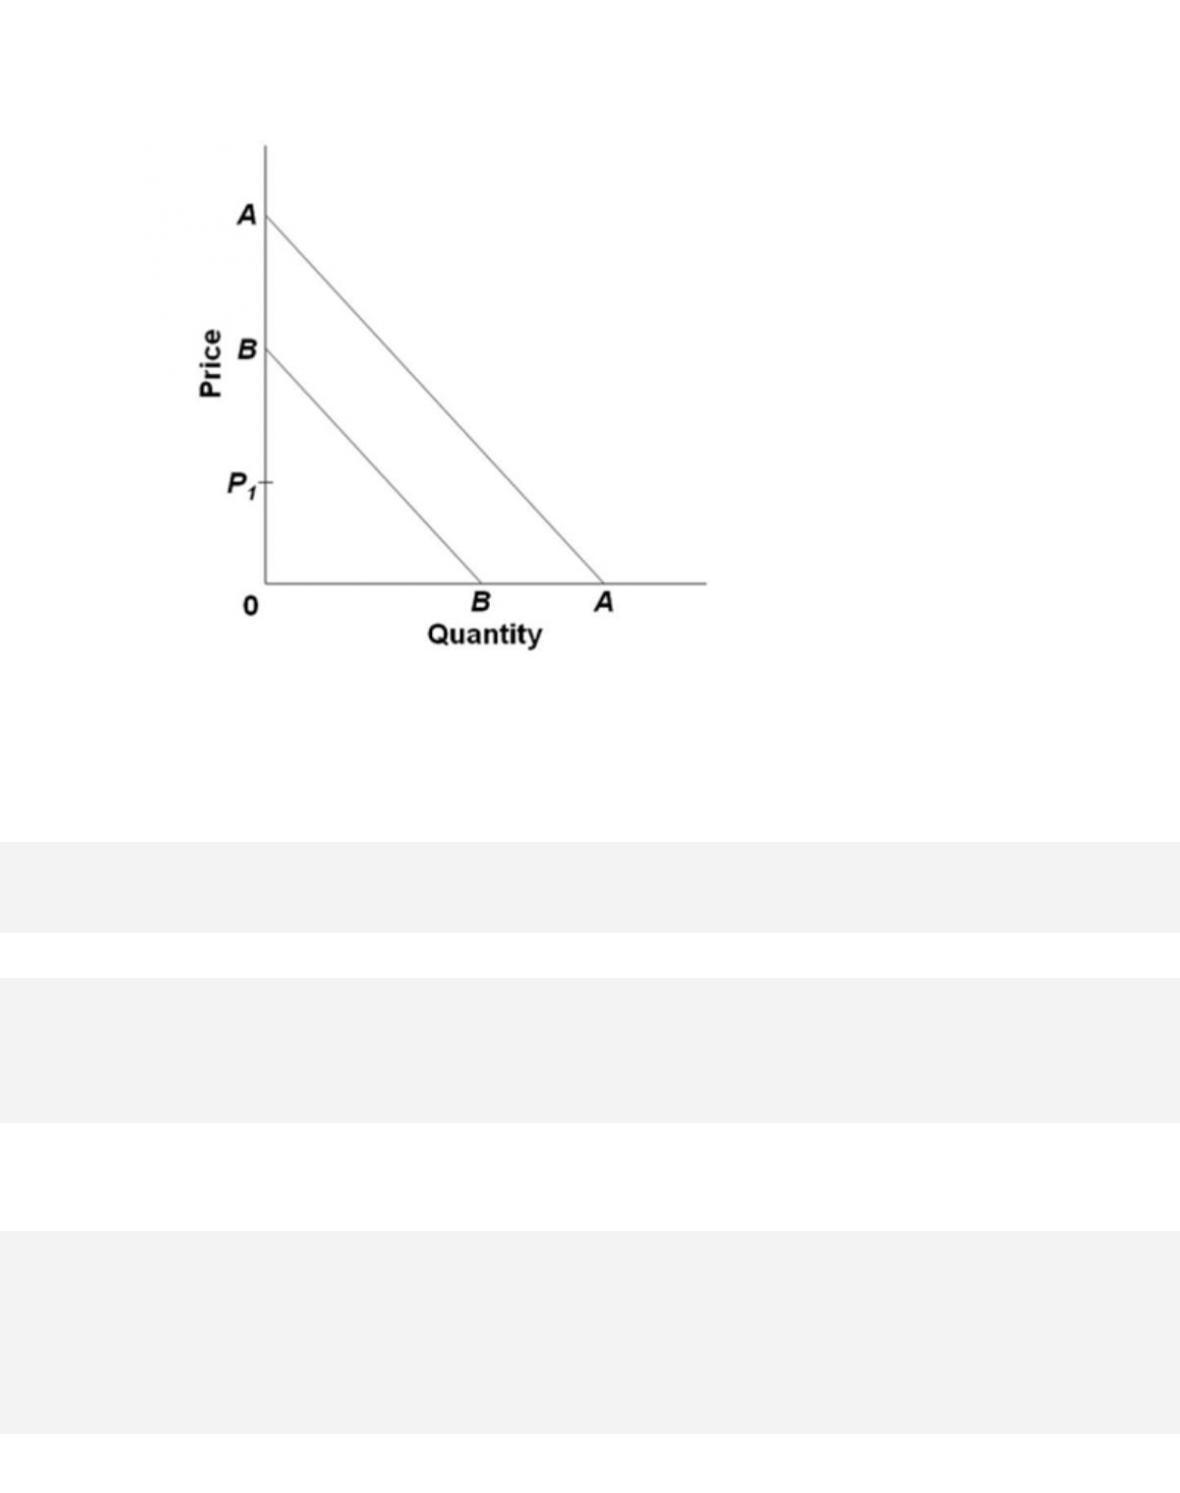
Consider the parallel demand curves in the figure above. Which curve is relatively more
elastic at P1?
207.
Which of the following statements is inconsistent with an elastic demand curve?
A. The price-elasticity coefficient is greater than 1.

6-102
Copyright © 2018 McGraw-Hill Education. All rights reserved. No reproduction or distribution without the prior
written consent of McGraw-Hill Education.
AACSB: Knowledge Application
Accessibility:
Keyboard Navigation
Blooms: Understand
Dif f i cul t y:
02 Medium
Learning Objective: 06–02 Explain the usefulness of the total-revenue test for price
elasticity of demand.
Test Bank: II
Topic: The Total-Revenue Test
208.
The total revenue received by sellers of a good is computed by
D.
dividing the percentage change in quantity by the percentage change in price.
209.
The total revenue received by sellers of a good is the same amount as the
A. total income earned by the buyers.
210.
Total revenue falls as the price of a good is raised, if the demand for the good is

6-103
Copyright © 2018 McGraw-Hill Education. All rights reserved. No reproduction or distribution without the prior
written consent of McGraw-Hill Education.
B.
inelastic.
C.
unitary elastic.
D.
perfectly elastic.
AACSB: Knowledge Application
Accessibility:
Keyboard Navigation
Blooms: Understand
Dif f i cul t y:
02 Medium
Learning Objective: 06–02 Explain the usefulness of the total-revenue test for price
elasticity of demand.
Test Bank: II
Topic: The Total-Revenue Test
211.
A 4 percent reduction in the price of a product has zero effect on the dollar amount of
consumer expenditure on the product. The price elasticity of demand is

212.
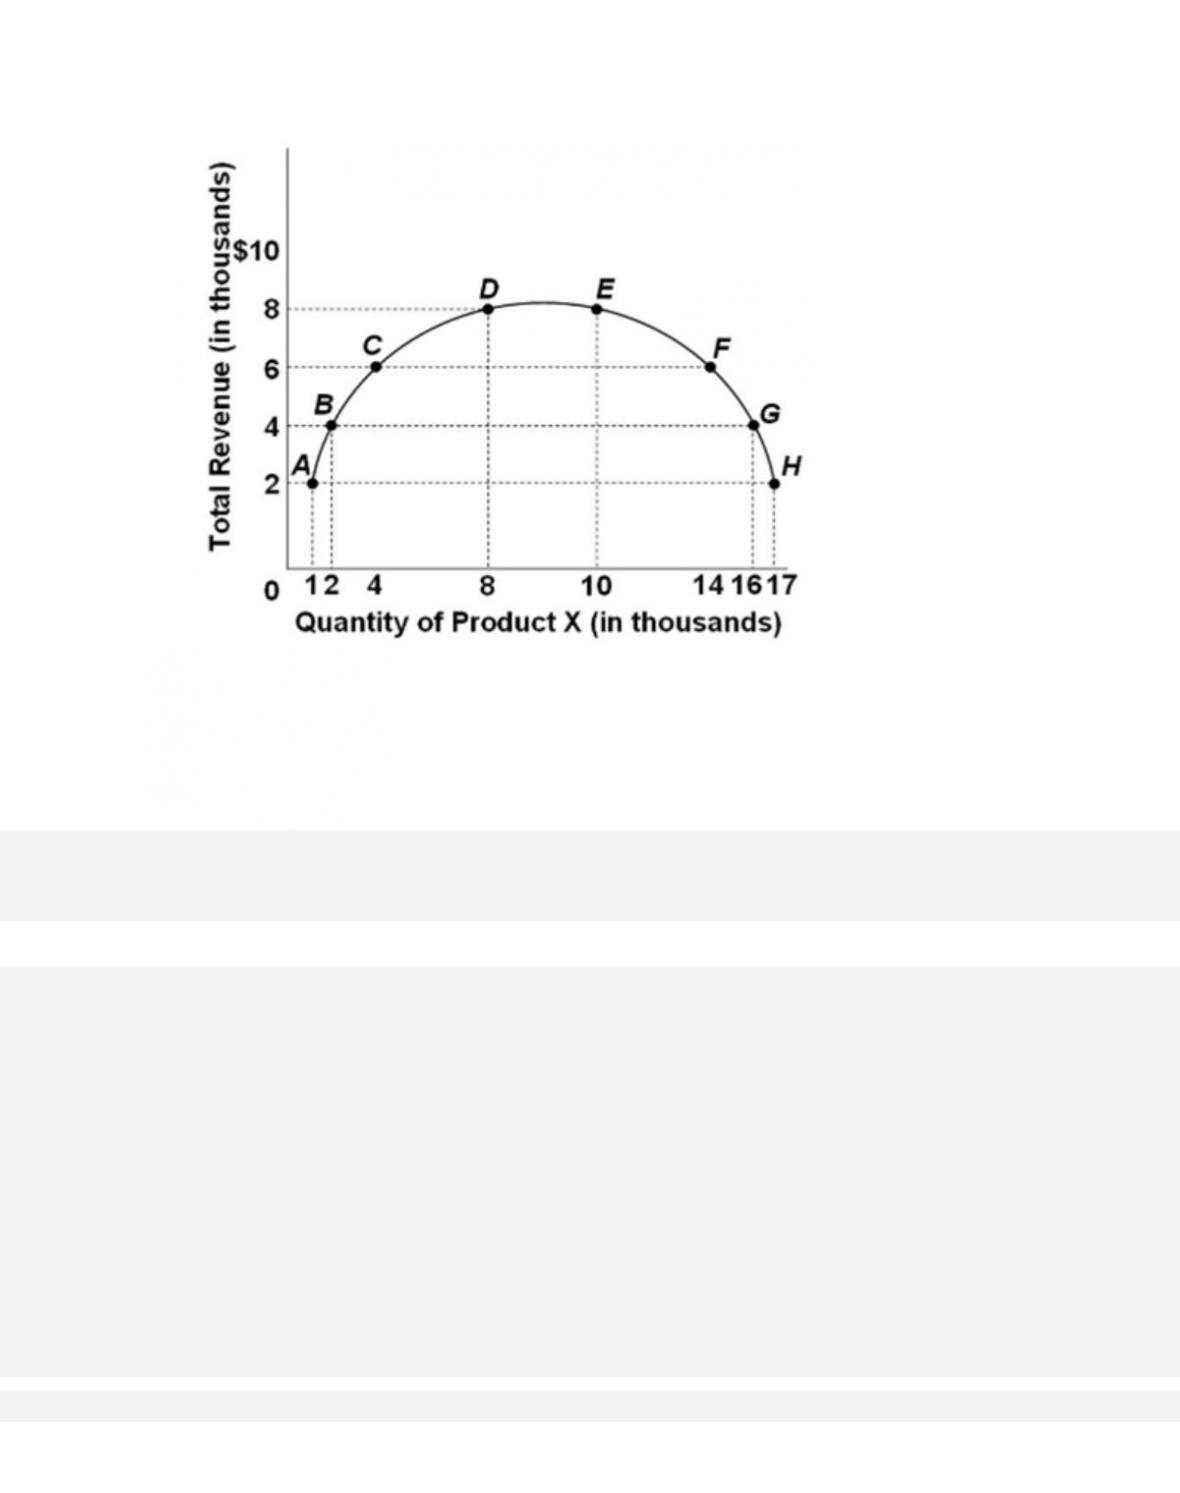
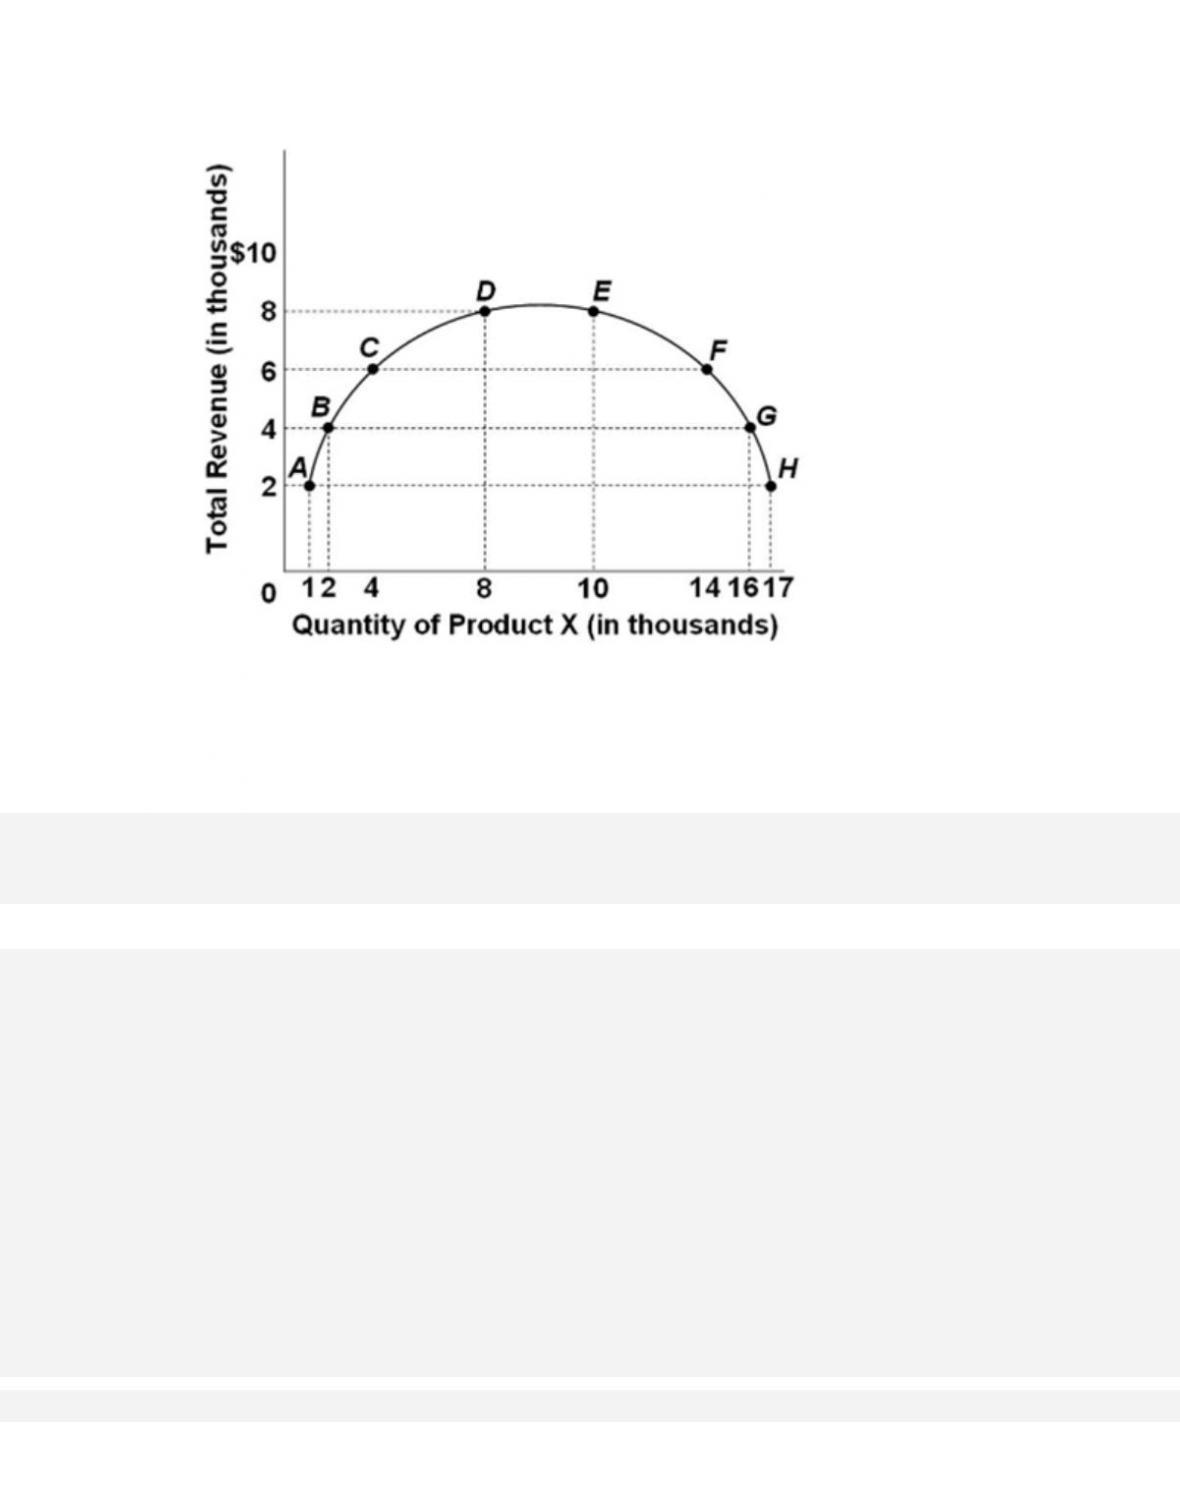
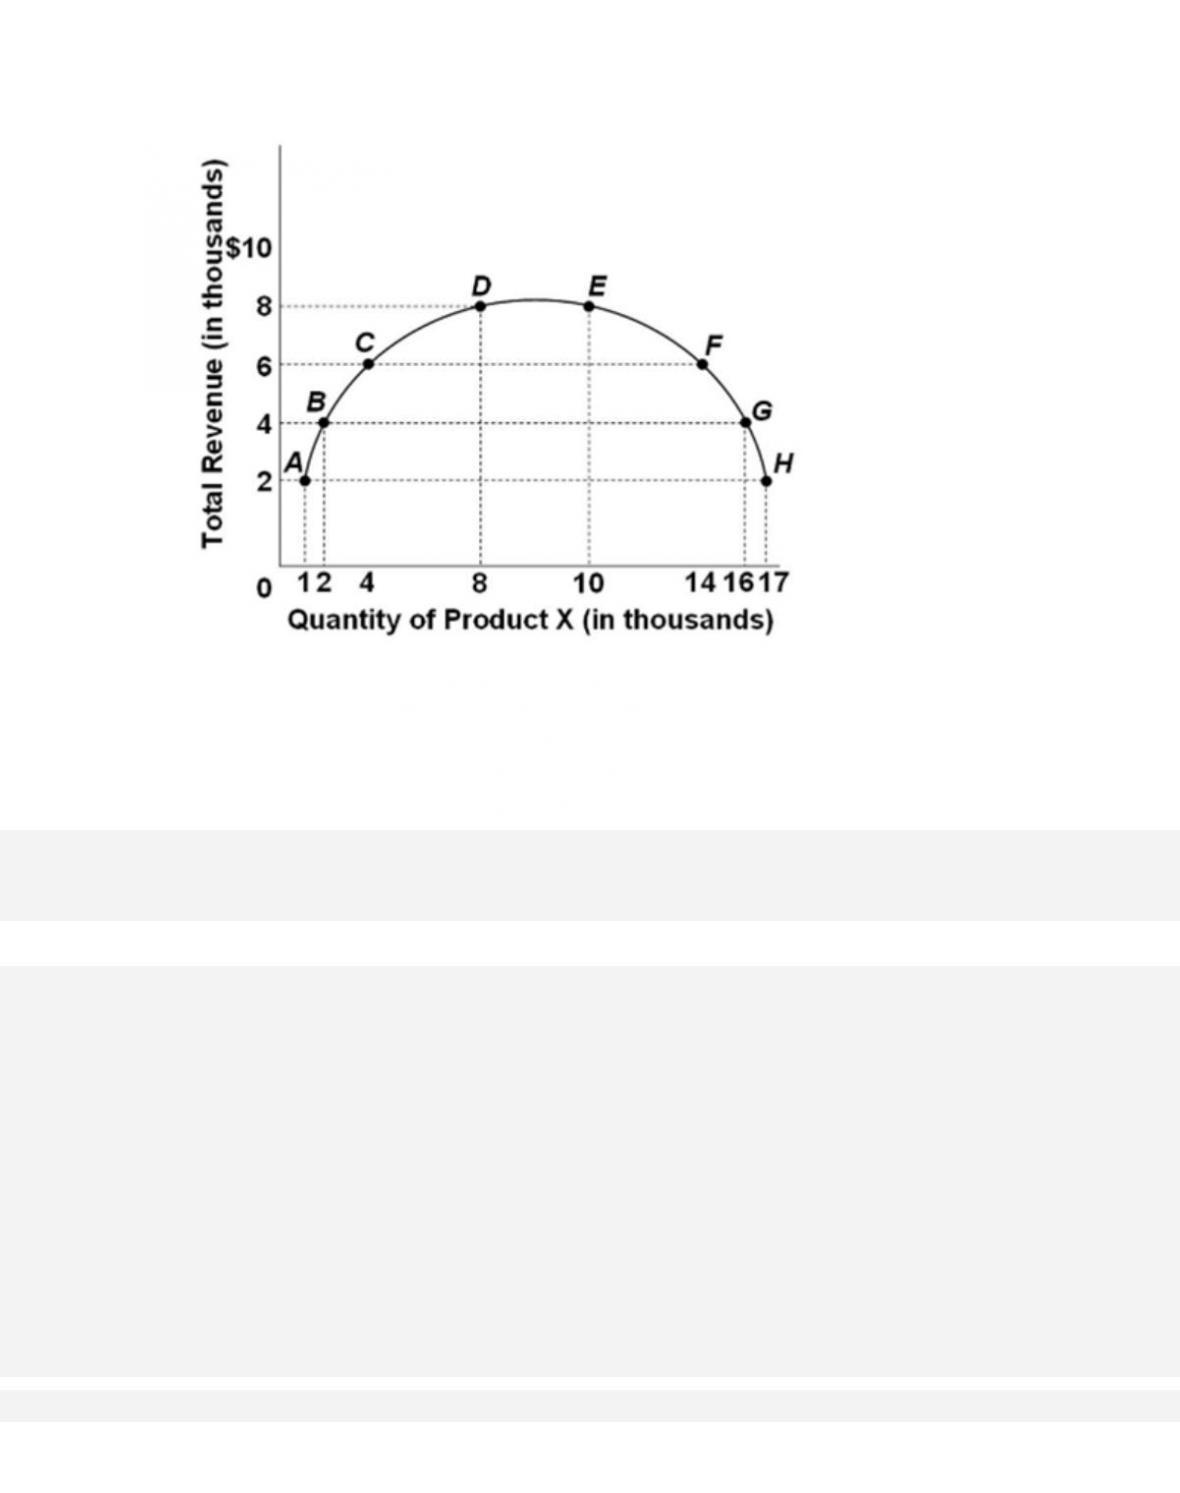
Refer to the total revenue graph above. An increase in the quantity of product X demanded
from 14,000 to 16,000 units implies that the price of product X was
213.
Refer to the total revenue graph above. If the quantity of product X demanded falls from
14,000 to 10,000 units, then it suggests that the price of X was
214.
Refer to the total revenue graph above. Demand is price-elastic between points
215.
Refer to the total revenue graph above. When the seller is earning maximum revenues from
selling Product X, the demand is
216.
Consider the demand curve above. If the price is OA, then the total revenues of sellers
would be the area
217.
Consider the demand curve above. If area 0ABC is smaller than area 0DEF, it suggests that if
the price increases from OD to OA, then total revenues of sellers will
218.
Consider the demand curve above. If area 0ABC is smaller than area 0DEF, we may
conclude that demand in this range is
219.
Demand is said to be inelastic when
D. the elasticity coefficient exceeds one.
220.
In which of the following instances will total revenues decline?
221.
Answer the question based on the following table, which shows a demand schedule.
Price
Quantity Demanded
$5
10
4
13
3
15
2
19
1
25
At a price of $3, the total revenues of sellers will be

6-112
Copyright © 2018 McGraw-Hill Education. All rights reserved. No reproduction or distribution without the prior
written consent of McGraw-Hill Education.
C.
$45.
D. $5.
222.
Answer the question based on the following table, which shows a demand schedule.
Price
Quantity Demanded
$5
10
4
13
3
15
2
19
1
25
Total revenues will decrease if price rises from
223.
Answer the question based on the following table, which shows a demand schedule.

Price
Quantity Demanded
$5
10
4
13
3
15
2
19
1
25
The largest decline in total revenue will occur when price falls from
224.
The price-elasticity coefficients are 2.6, 0.5, 1.4, and 0.18 for four different demand
schedules,D1, D2, D3, and D4, respectively. A 2-percent increase in price will result in an
increase in total revenues in which of the following cases?

6-114
225.
If 100 shirts are sold when the unit price is $10, while 75 shirts are sold when the unit
price is $15, one can conclude that in this price range,
A. demand for the shirts is elastic.
226.
Assume that pizza and hamburgers are the only food items available to consumers. If
the price of pizza increases, other factors constant, then which of the following will
definitely
happen?
A.
Total revenues received by pizza sellers will increase.
227.
When the price of movie tickets in a certain town was reduced, the movietheaters’
revenues did not change. This suggests that the demand for movie tickets in that town has a
price-
elasticity coefficient of
D. zero.

6-115
Copyright © 2018 McGraw-Hill Education. All rights reserved. No reproduction or distribution without the prior
written consent of McGraw-Hill Education.
AACSB: Knowledge Application
Accessibility:
Keyboard Navigation
Blooms: Understand
Dif f i cul t y:
02 Medium
Learning Objective: 06–02 Explain the usefulness of the total-revenue test for price
elasticity of demand.
Test Bank: II
Topic: The Total-Revenue Test
228.
Chuck has a price elasticity of demand for beer of 1.2. Suppose that the price of beer is
increased by 10 percent. What will happen to the total amount Chuck spends on beer?
A. It will not change.
229.
If the price elasticity of demand for orange juice is 0.8, then a reduction in the price of
orange juice will cause buyers to buy
A.
fewer bottles of orange juice, and their total spending on orange juice will decrease.
230.
Price
Quantity Demanded
$5
10
4
20
3
30
2
40
1
50
Refer to the table above. If the price starts falling from $5, at what price range does demand
become inelastic?
231.
Price
Quantity Demanded
$5
10
4
20
3
30
2
40
1
50
Refer to the table above. What is the price that yields the maximum total revenue?
D.
$5
232.
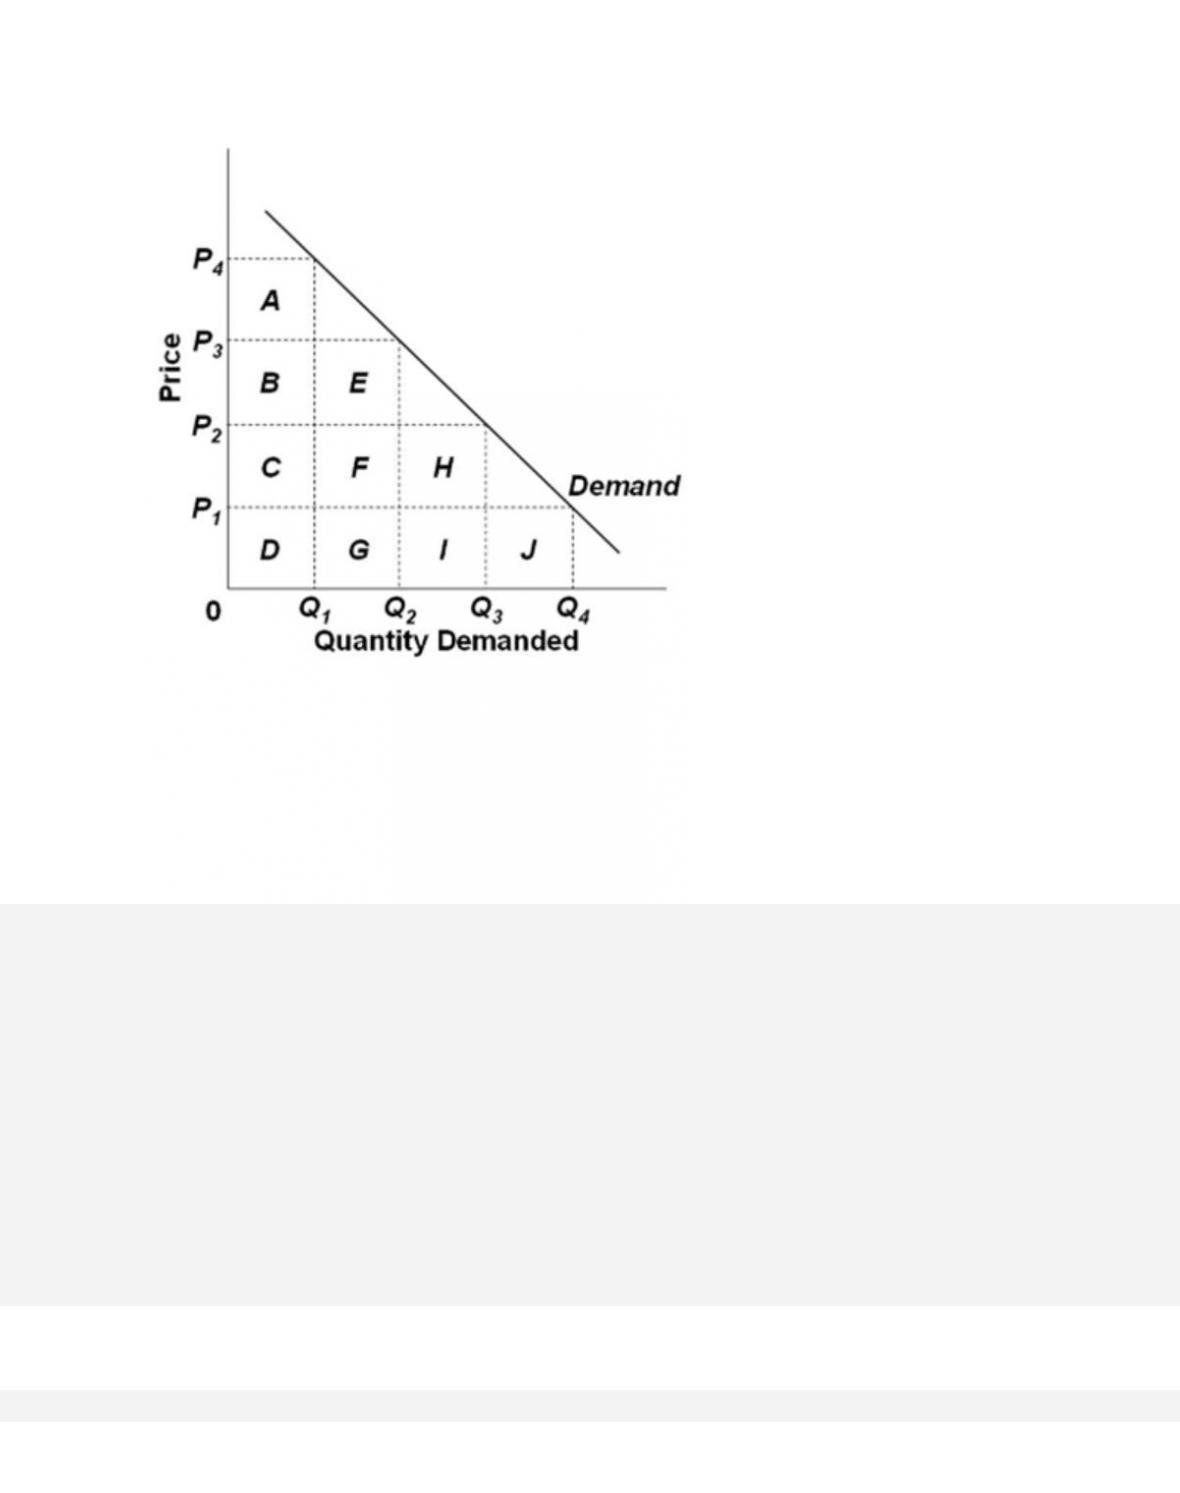
Refer to the above graph. If the price is P3, then the total revenue is represented by area
6-118
Copyright © 2018 McGraw-Hill Education. All rights reserved. No reproduction or distribution without the prior
written consent of McGraw-Hill Education.
Learning Objective: 06–02 Explain the usefulness of the total-revenue test for price
elasticity of demand.
Test Bank: II
Topic: The Total-Revenue Test
233.
Refer to the above graph. If the price decreases from P3 to P2, then the total revenue will
lose area
6-119
234.
Refer to the above graph. If the price increases from P1 to P2, then the total revenue will
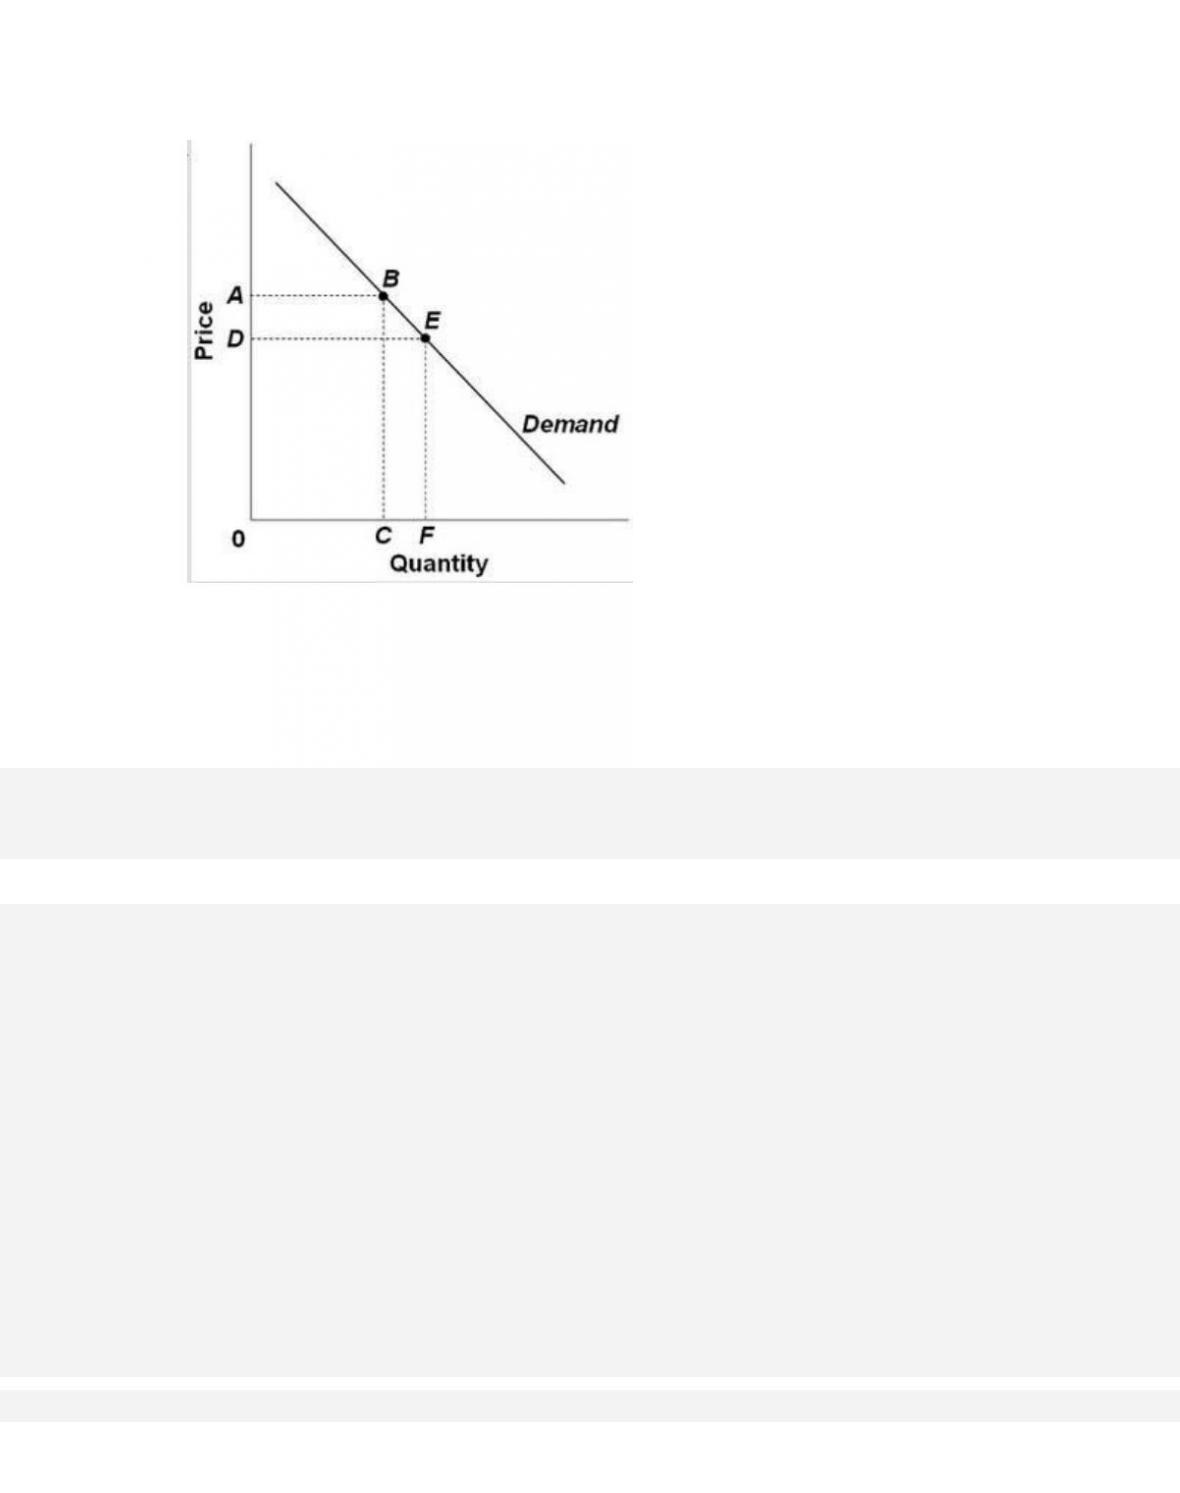
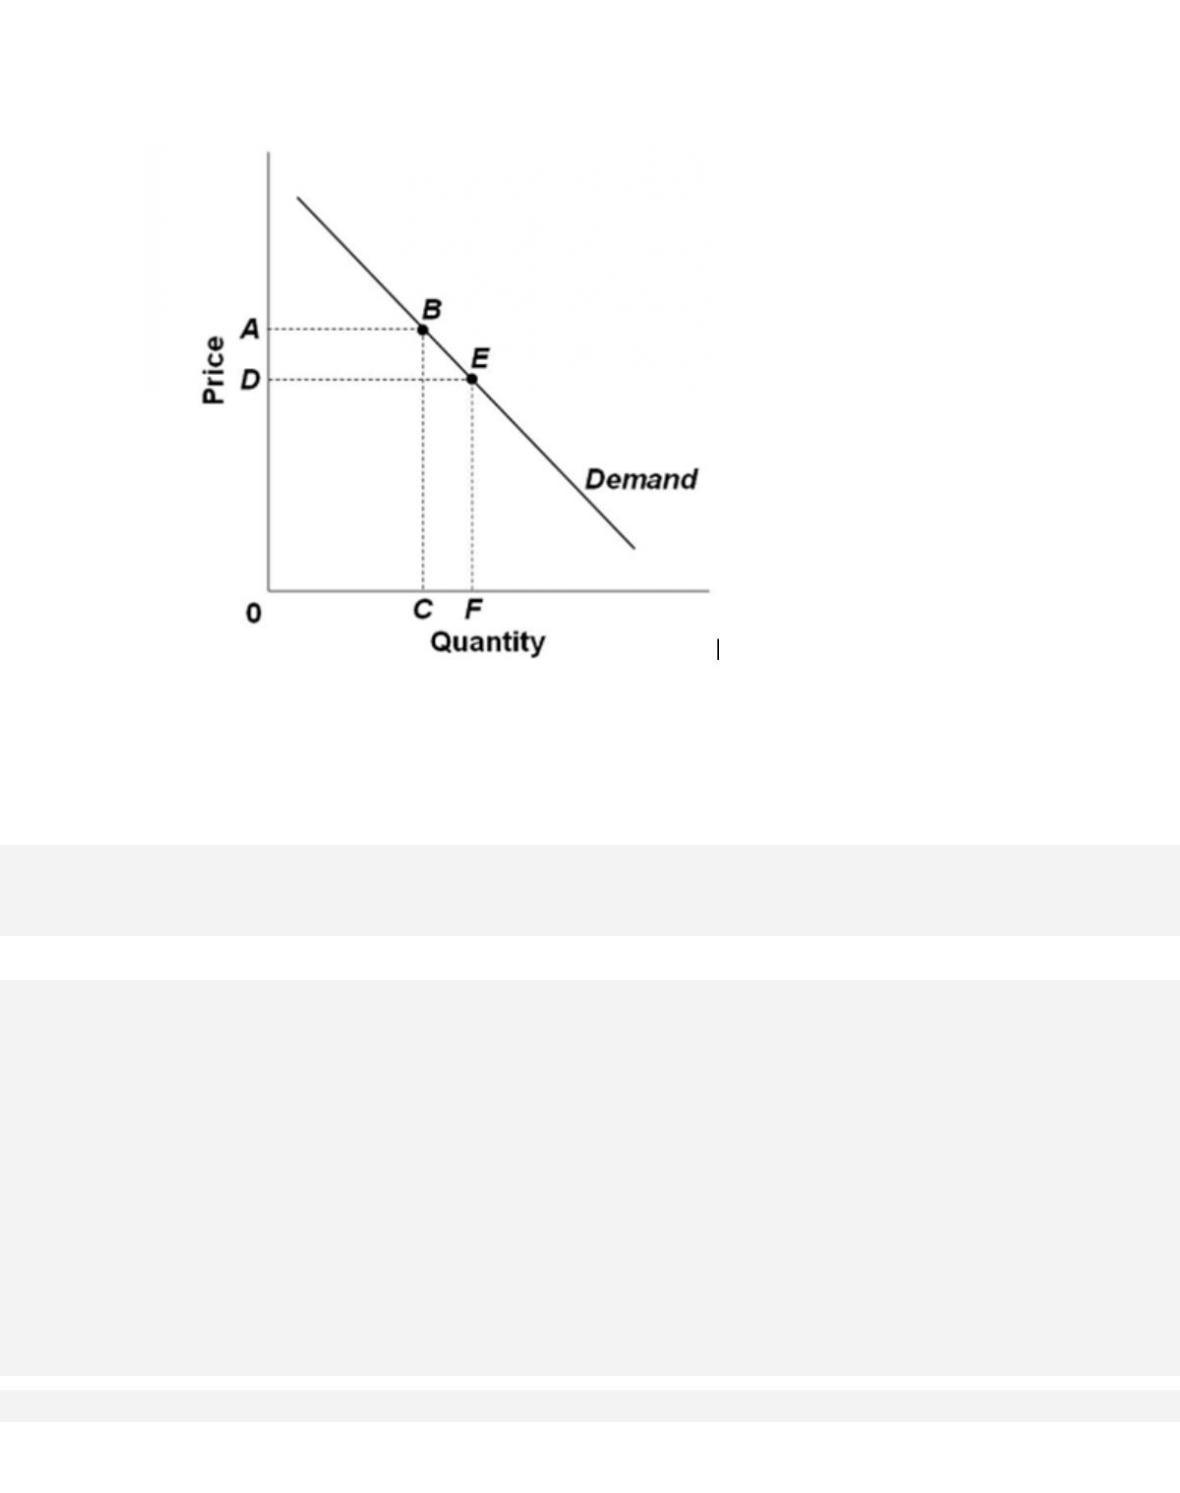
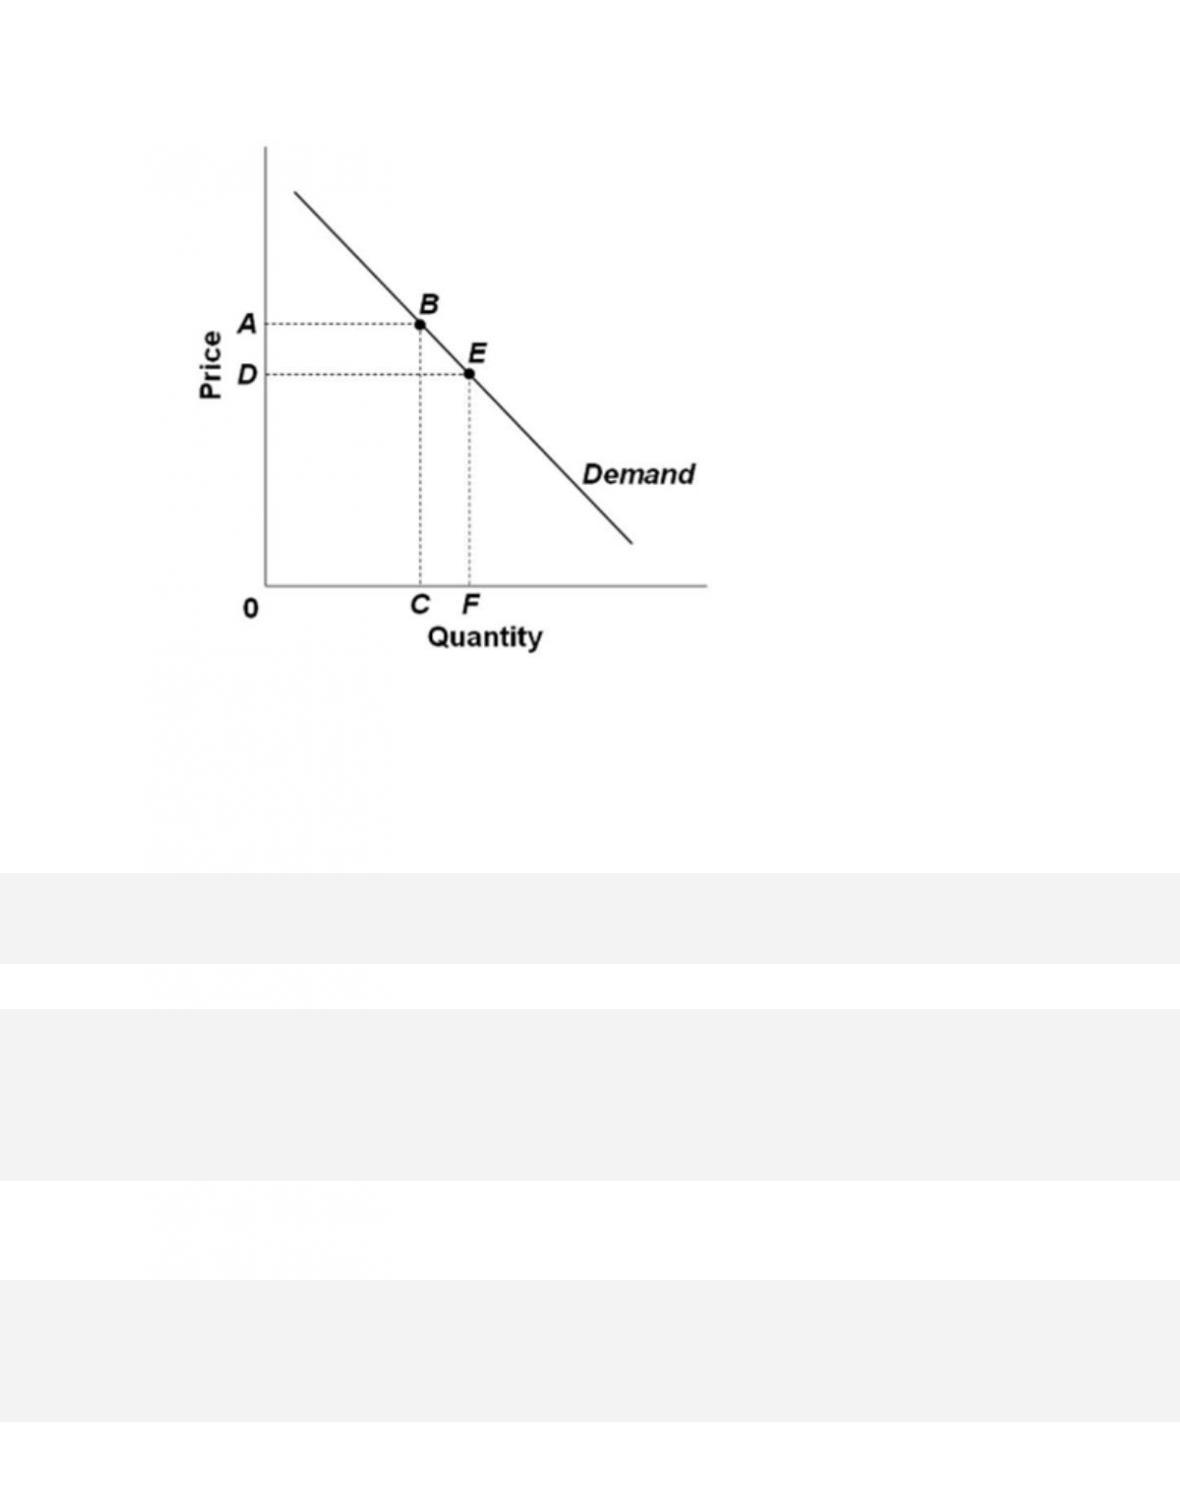
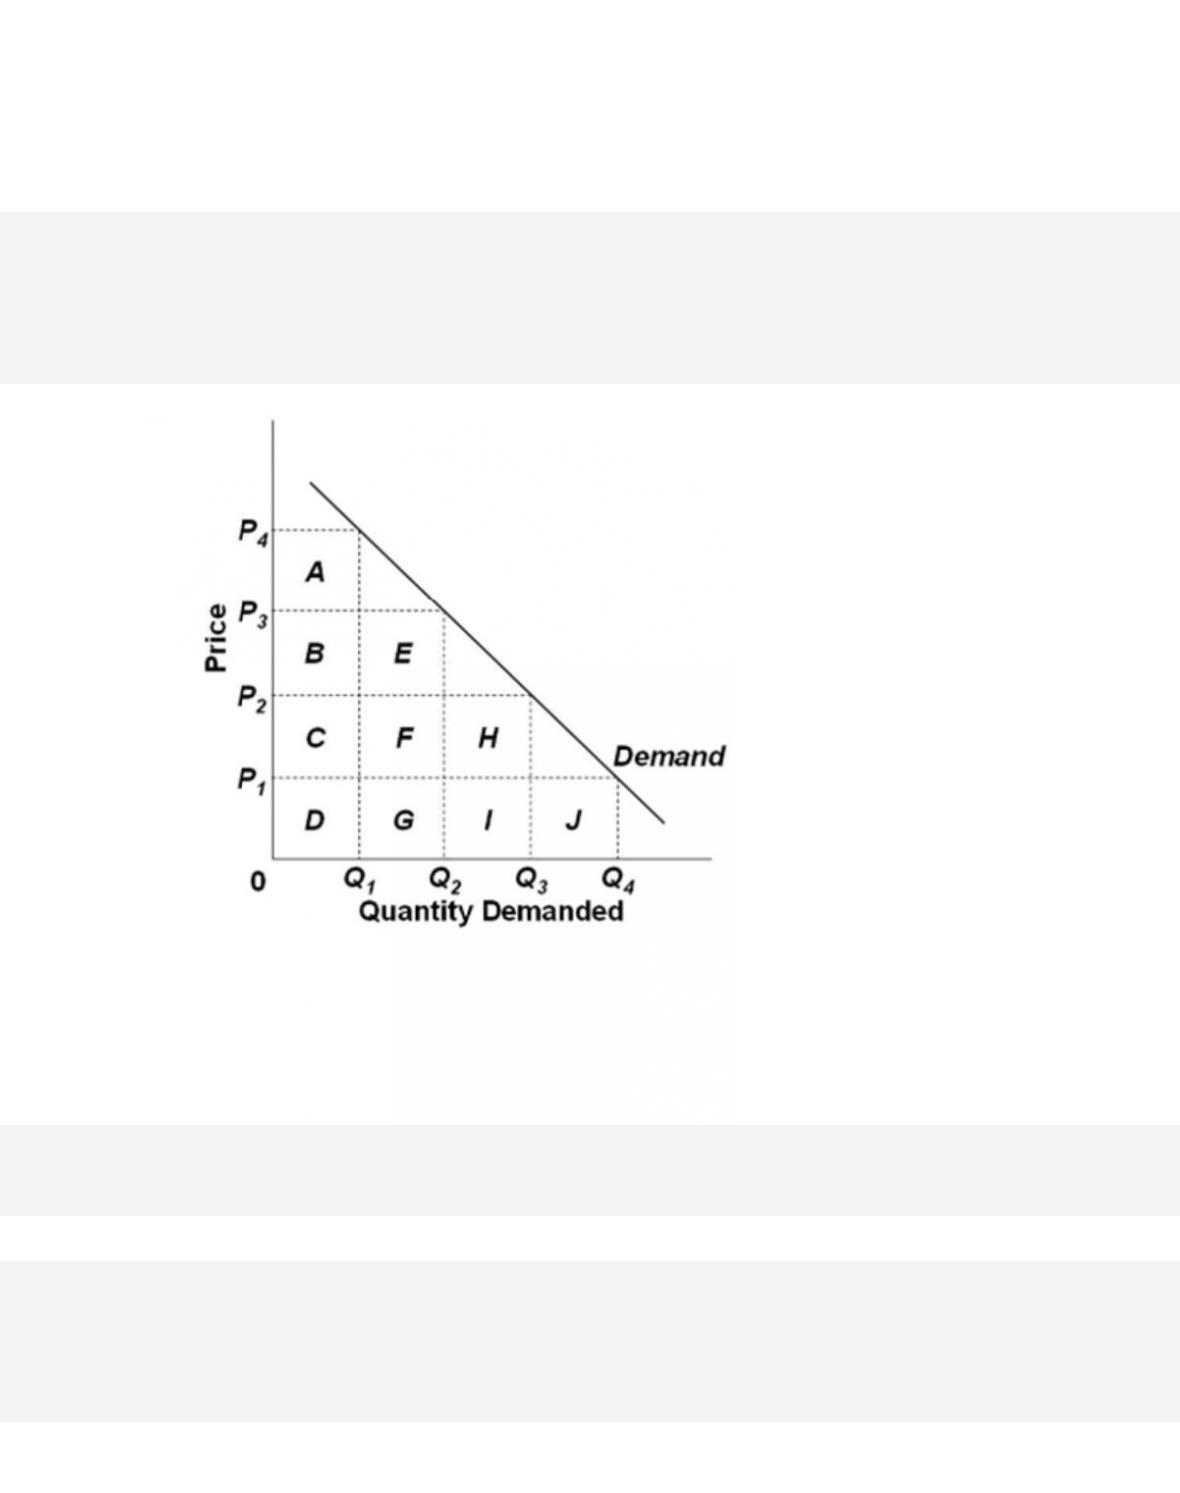
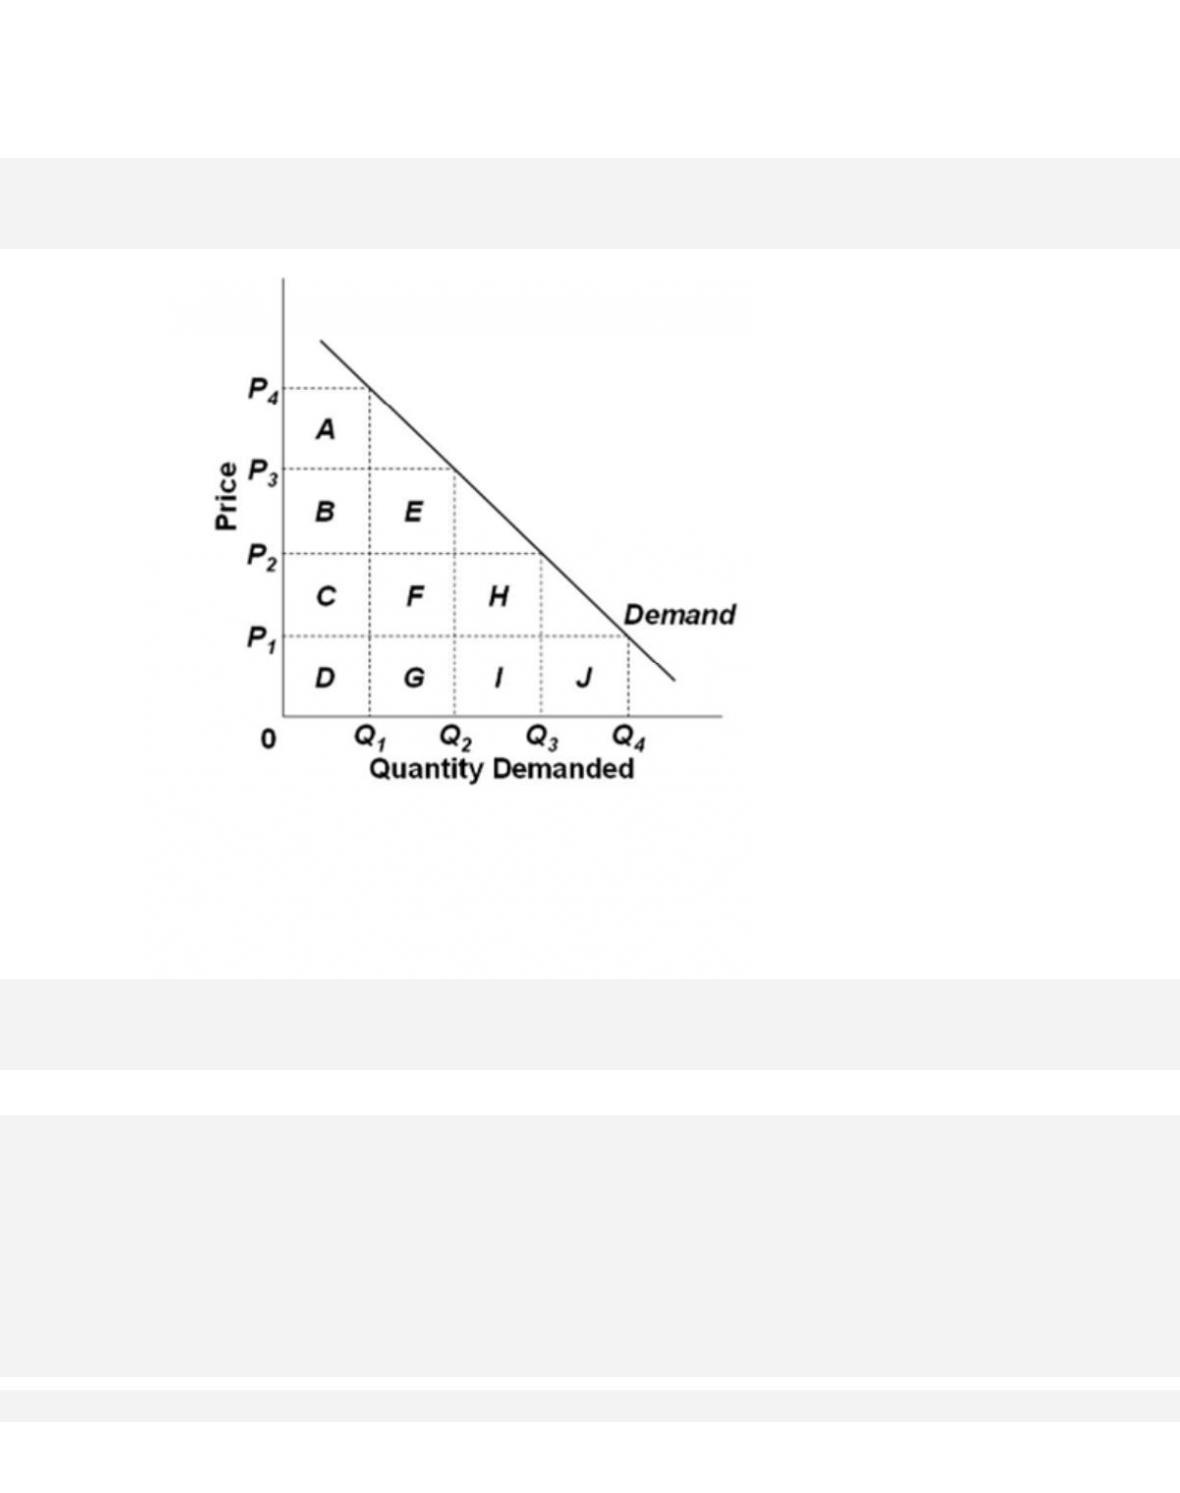
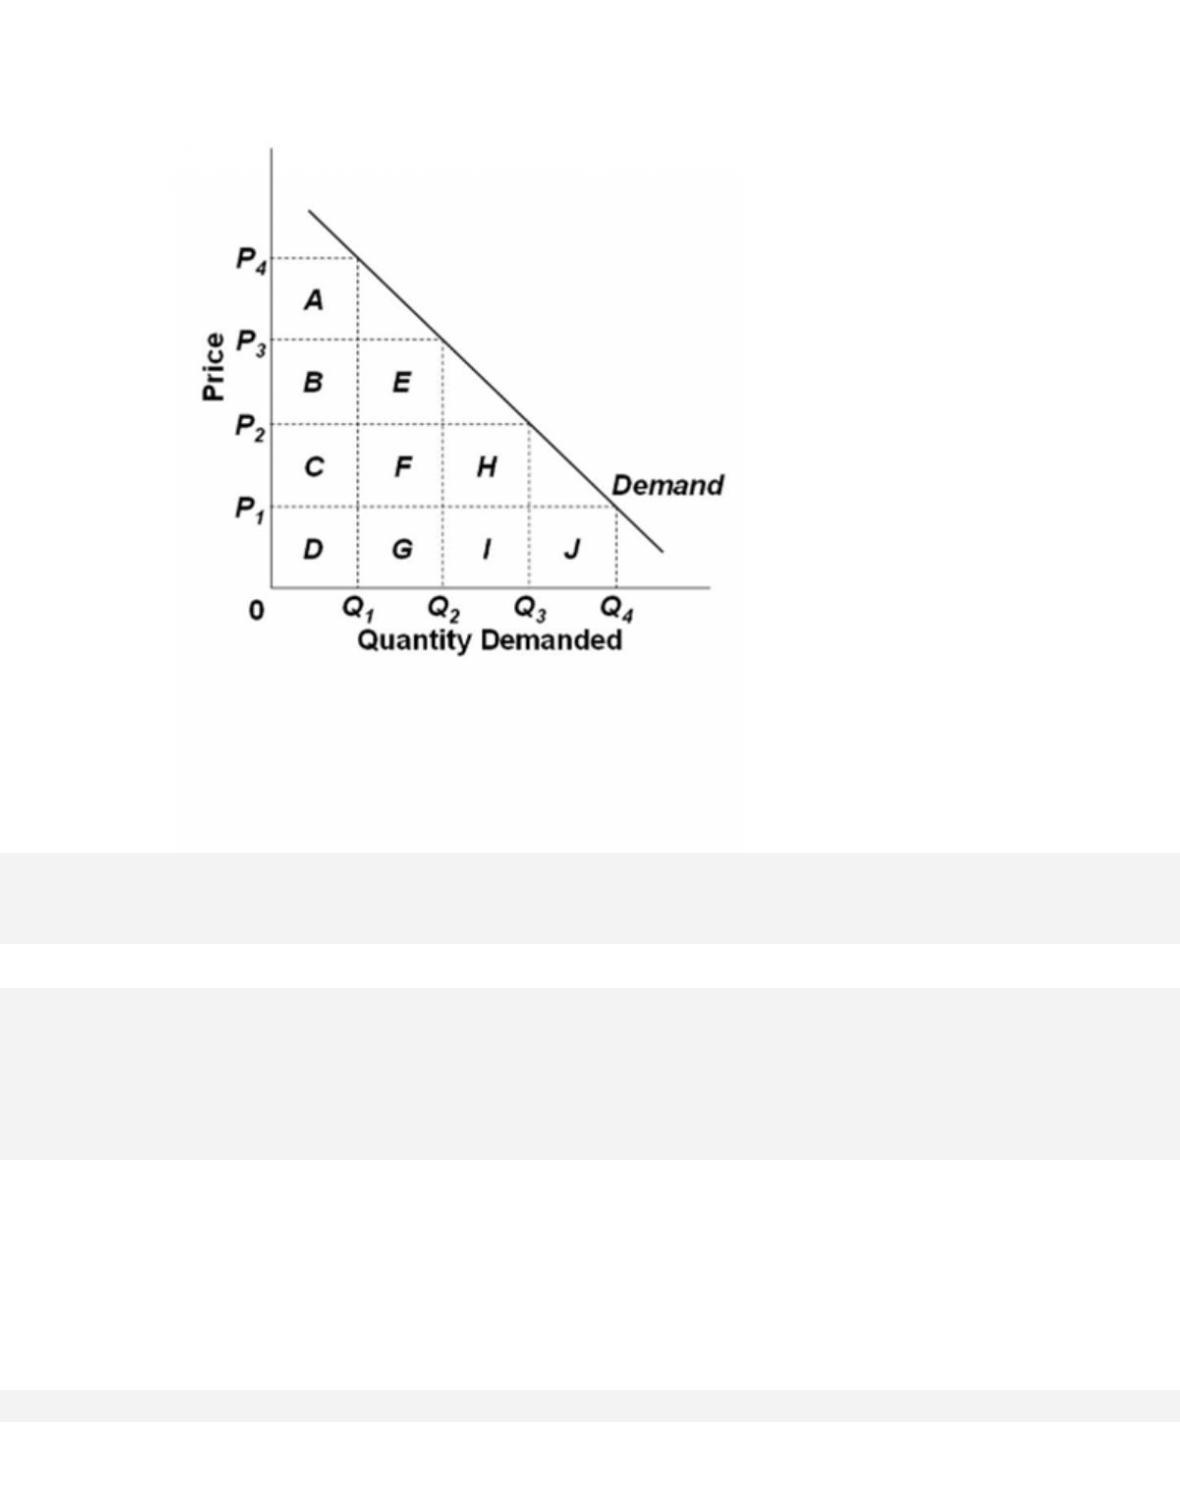
gain area
235. (p. $$pageTag$$)
6-120
Refer to the above graph. Consider a situation where price increases from P3 to P4. In this
price range, demand is relatively
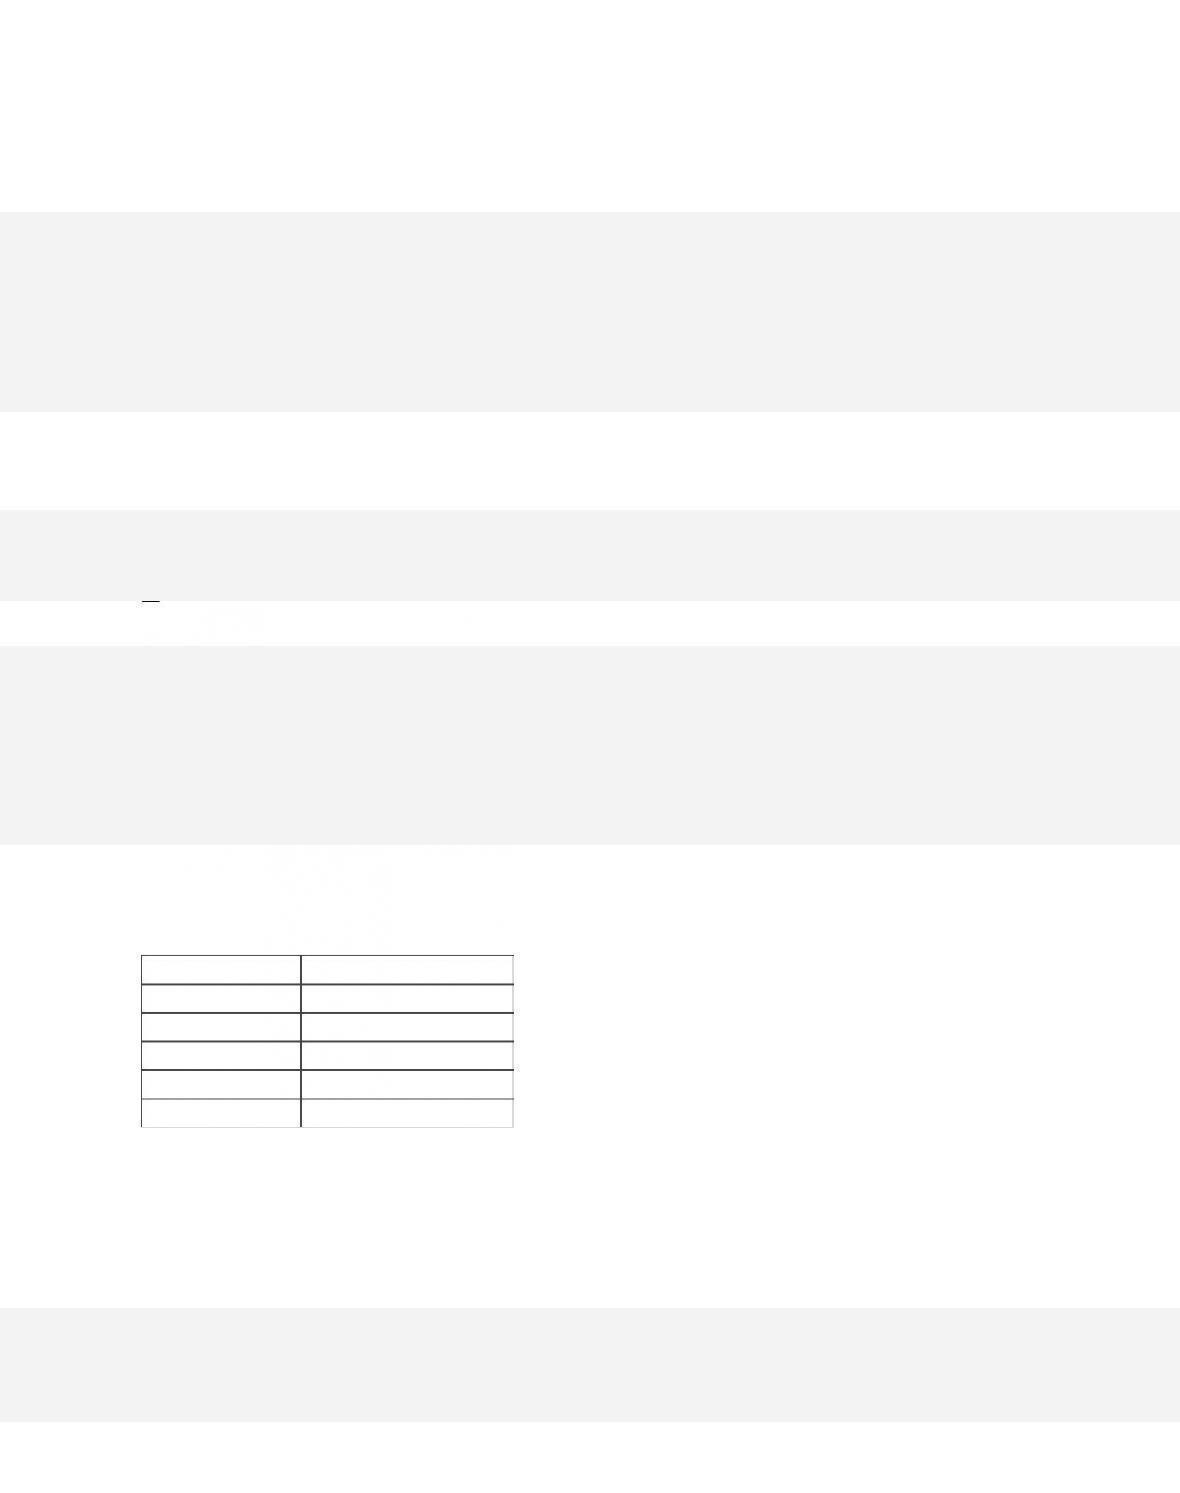
A. inelastic because the loss in total revenue (areas E + F + G) is greater than the gain in
total revenue (area A).