Unlock document.
This document is partially blurred.
Unlock all pages and 1 million more documents.
Get Access
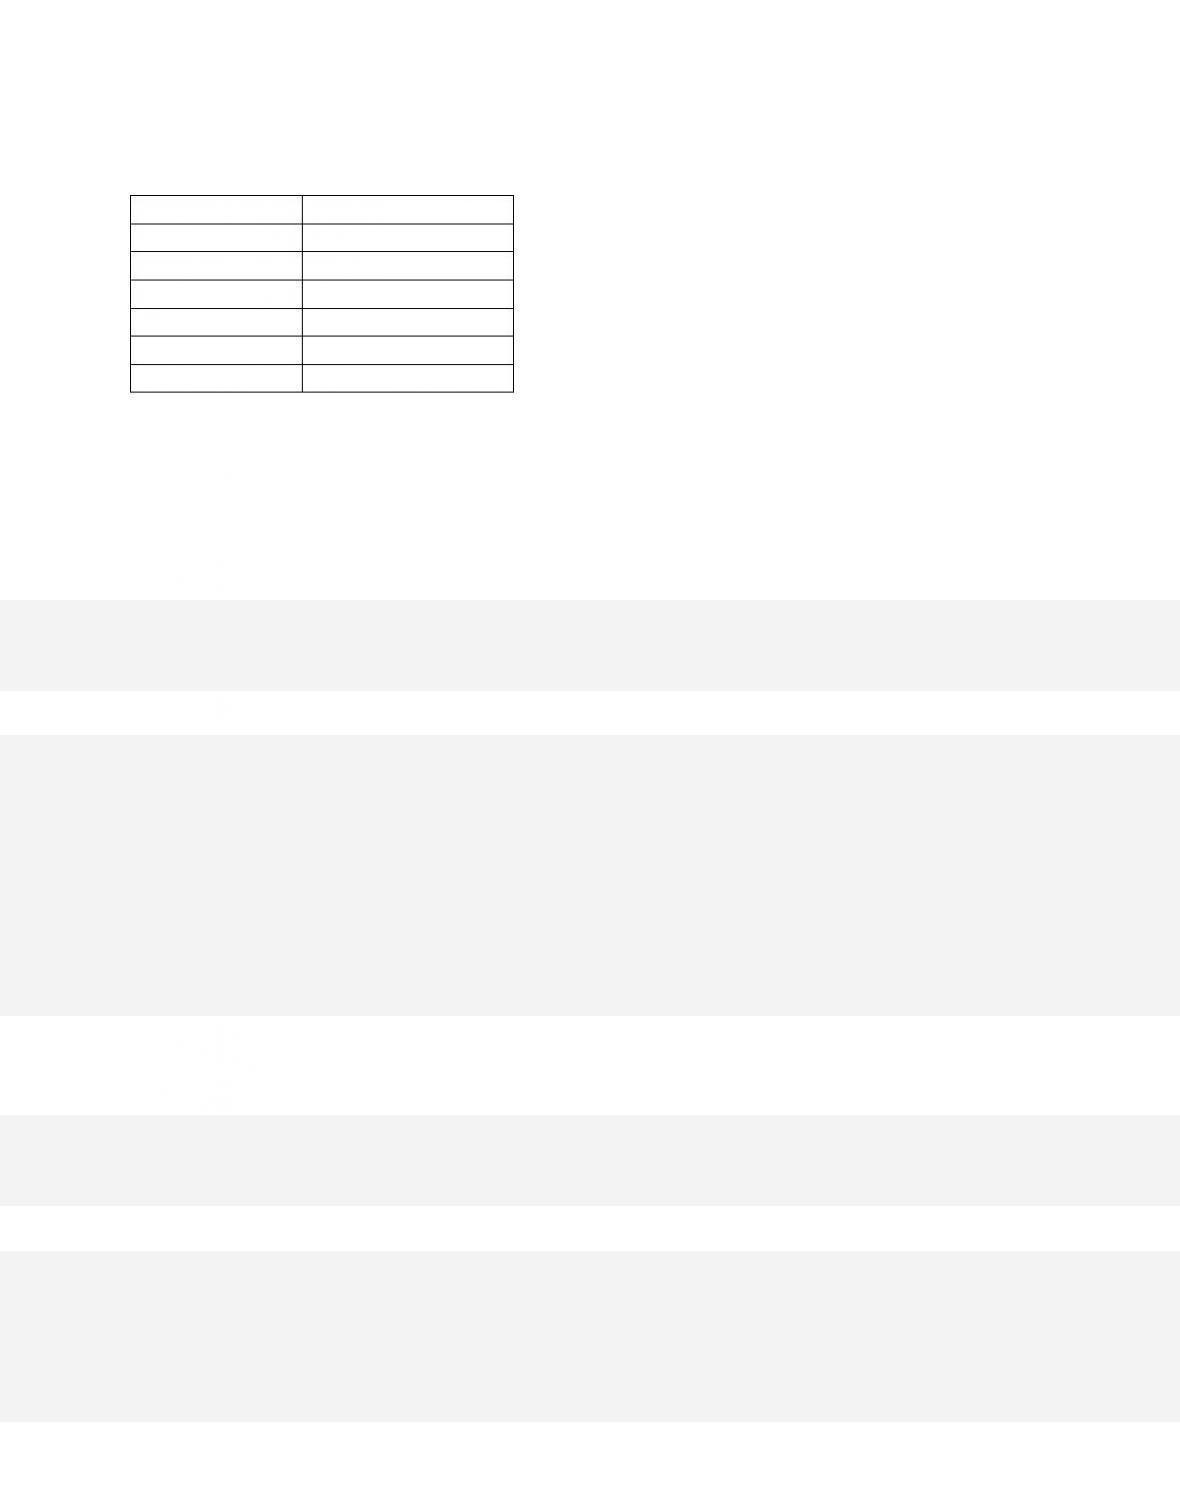
117.
Price per Ticket
Quantity Demanded
$13
1,000
11
2,000
9
3,000
7
4,000
5
5,000
3
6,000
Refer to the information. If the Mudhens' management wanted to maximize total ticket
revenue from the game, it would set the ticket price at
118.
An antidrug policy that reduces the supply of heroin might

6-62
Copyright © 2018 McGraw-Hill Education. All rights reserved. No reproduction or distribution without the prior
written consent of McGraw-Hill Education.
Learning Objective: 06-03 List the factors that affect price elasticity of demand and
describe some applications of price elasticity of demand.
Learning Objective: 06-04 Describe price elasticity of supply and how it can be applied.
Test Bank: I
Topic:
Determinants of Price Elasticity of Demand
Topic: Price Elasticity of Supply
119.
Studies of the minimum wage suggest that the price elasticity of demand for teenage
workers is relatively inelastic. This means that
120.
Studies show that the demand for gasoline is
121.
Farmers often find that large bumper crops are associated with declines in their gross
incomes. This suggests that
A.
farm products are normal goods.
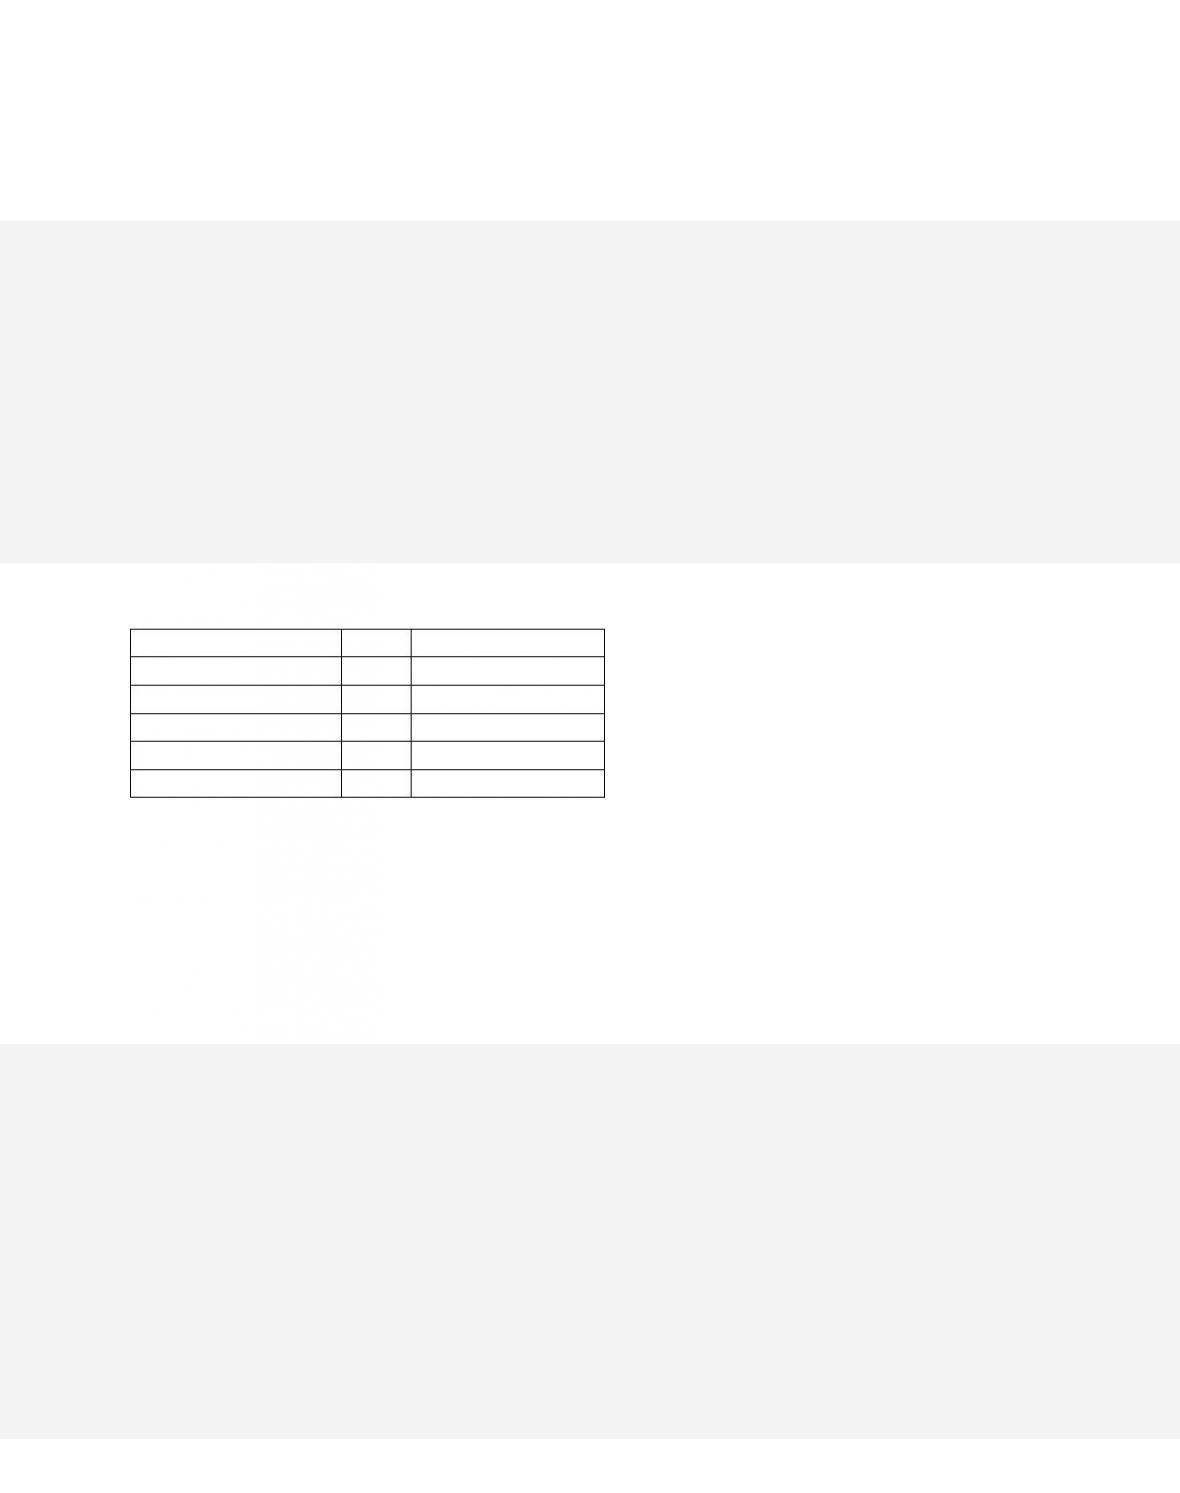
122.
Quantity Demanded
Price
Quantity Supplied
45
$10
77
50
8
73
56
6
68
61
4
61
67
2
57
Refer to the data. Suppose quantity demanded increased by 12 units at each price, changing
the equilibrium price in a direction and an amount for you to determine. Over that price
range, supply is
A.
perfectly elastic.
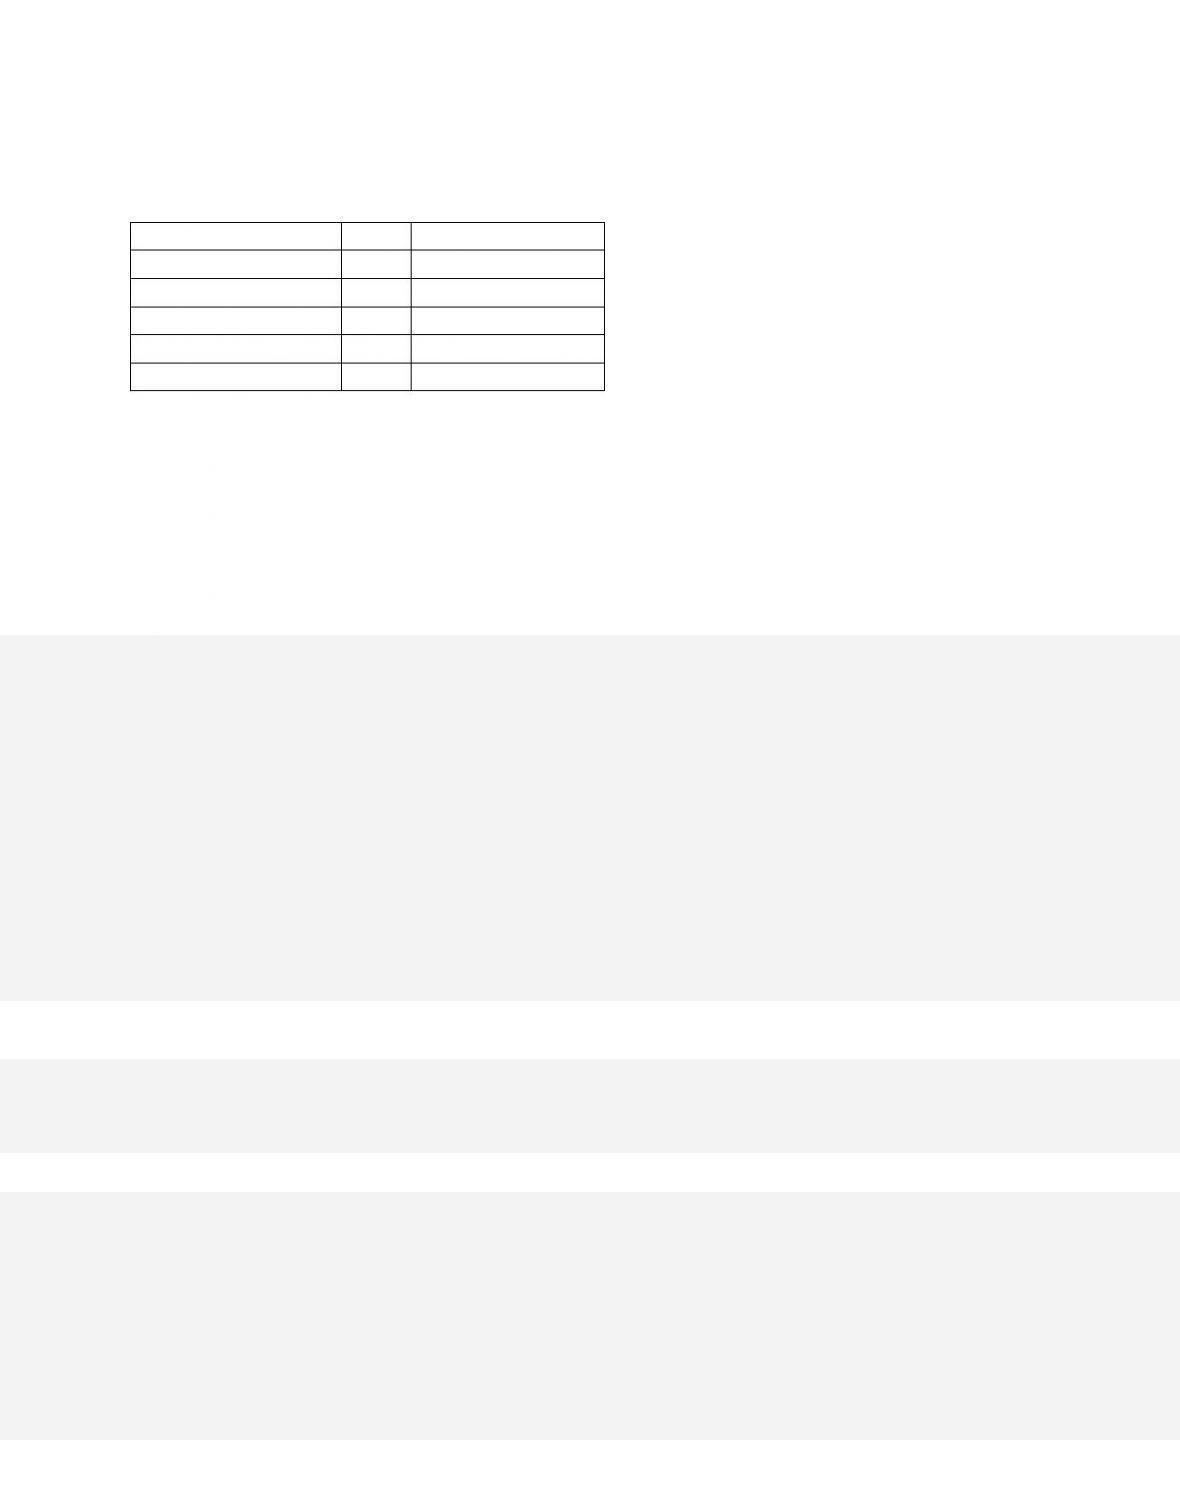
123.
Quantity Demanded
Price
Quantity Supplied
45
$10
77
50
8
73
56
6
68
61
4
61
67
2
57
Refer to the data. Suppose quantity supplied declined by 23 units at each price, changing the
equilibrium price in a direction and amount for you to determine. Over that price range,
demand is
A. elastic.
124.
The price of old baseball cards rises rapidly with increases in demand because
D.
the demand for old baseball cards is price elastic.

6-65
Copyright © 2018 McGraw-Hill Education. All rights reserved. No reproduction or distribution without the prior
written consent of McGraw-Hill Education.
Learning Objective: 06-03 List the factors that affect price elasticity of demand and
describe some applications of price elasticity of demand.
Learning Objective: 06-04 Describe price elasticity of supply and how it can be applied.
Test Bank: I
Topic:
Price Elasticity of Demand
T o p i c :
Price Elasticity of Supply
Type: Table
125.
The supply curve of a one-of-a-kind original painting is
A.
relatively elastic.
126.
The supply curve of antique reproductions is
D.
unit elastic.
127.
Suppose the income elasticity of demand for toys is +2.00. This means that

C.
a 10 percent increase in income will decrease the purchase of toys by 2 percent.
D.
toys are an inferior good.
128.
If the income elasticity of demand for store brand macaroni and cheese is −3.00, this
means that
A.
store brand macaroni and cheese is a substitute for name brand macaroni and cheese.
129.
The formula for cross elasticity of demand is percentage change in
A.
quantity demanded of X/percentage change in price of X.

130.
Cross elasticity of demand measures how sensitive purchases of a specific product are
to changes in
D.
the general price level.
131.
The larger the positive cross elasticity coefficient of demand between products X and
Y, the
A. stronger their complementariness.
132.
We would expect the cross elasticity of demand between Pepsi and Coke to be
A.
positive, indicating normal goods.
6-68
Copyright © 2018 McGraw-Hill Education. All rights reserved. No reproduction or distribution without the prior
written consent of McGraw-Hill Education.
Blooms: Apply
Di f f i c u l t y :
03 Hard
Learning Objective: 06-05 Apply cross elasticity of demand and income elasticity of
demand.
Test Bank: I
Topic:
Cross Elasticity and Income Elasticity of Demand
133.
We would expect the cross elasticity of demand between dress shirts and ties to be
A.
positive, indicating normal goods.
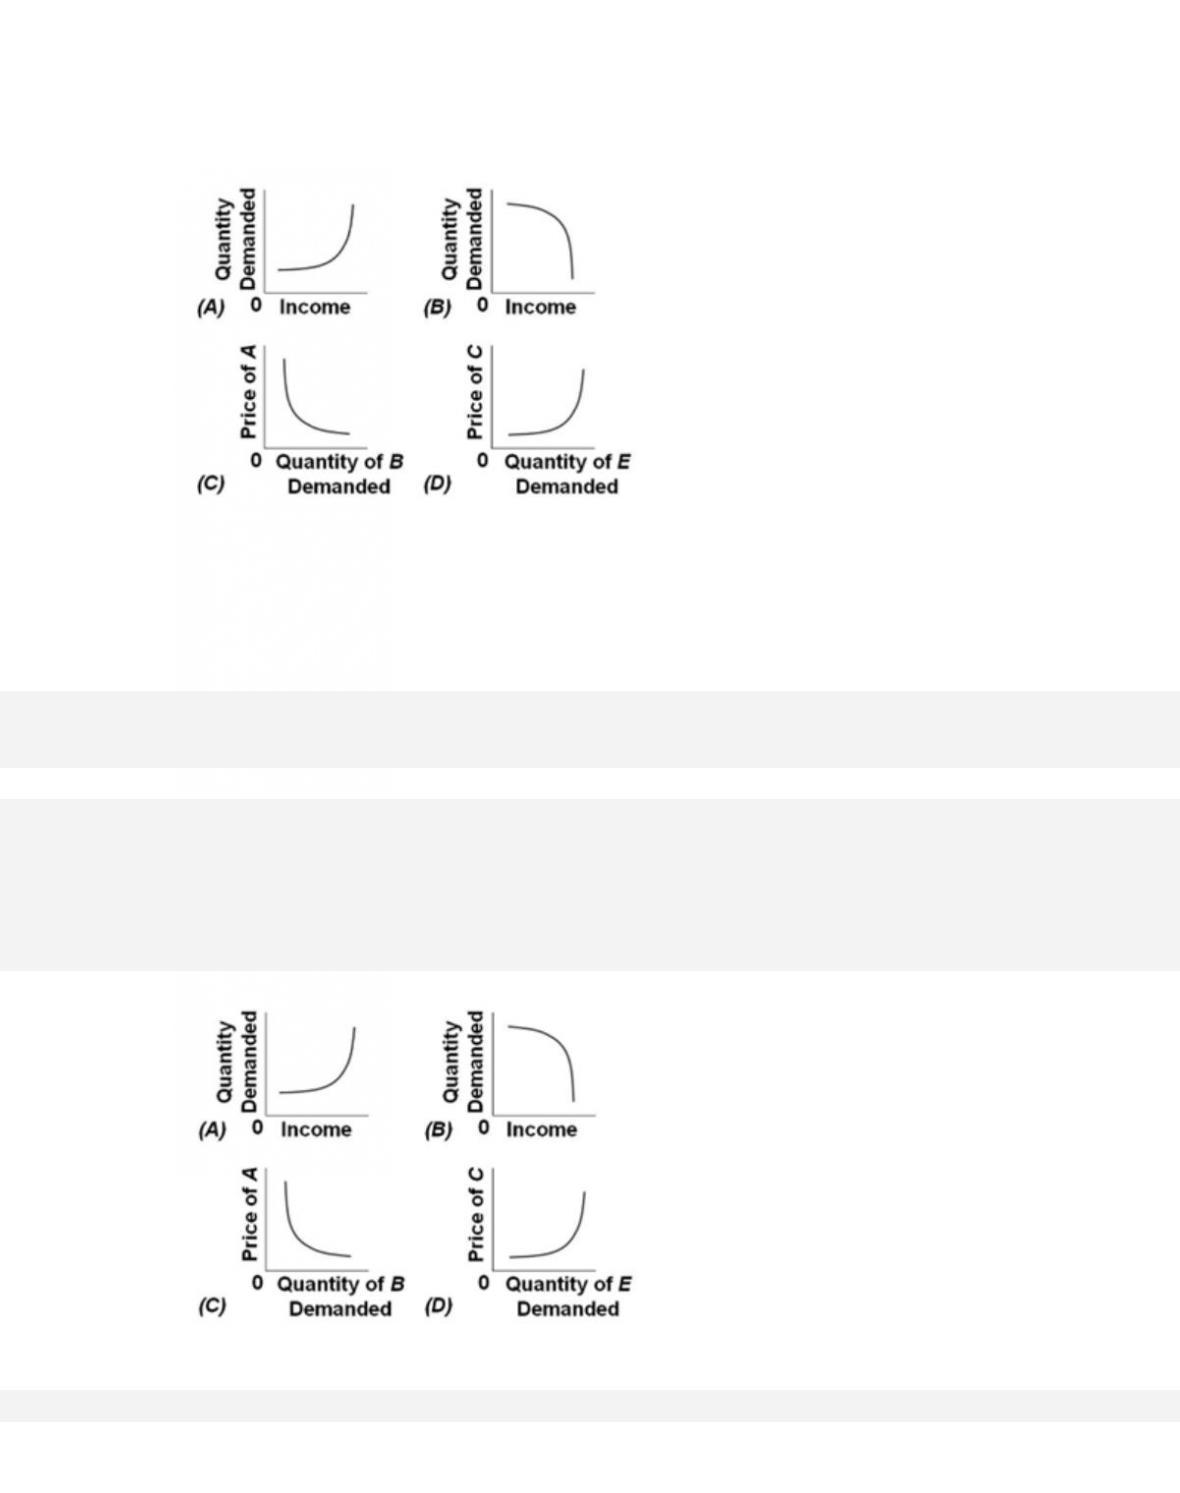
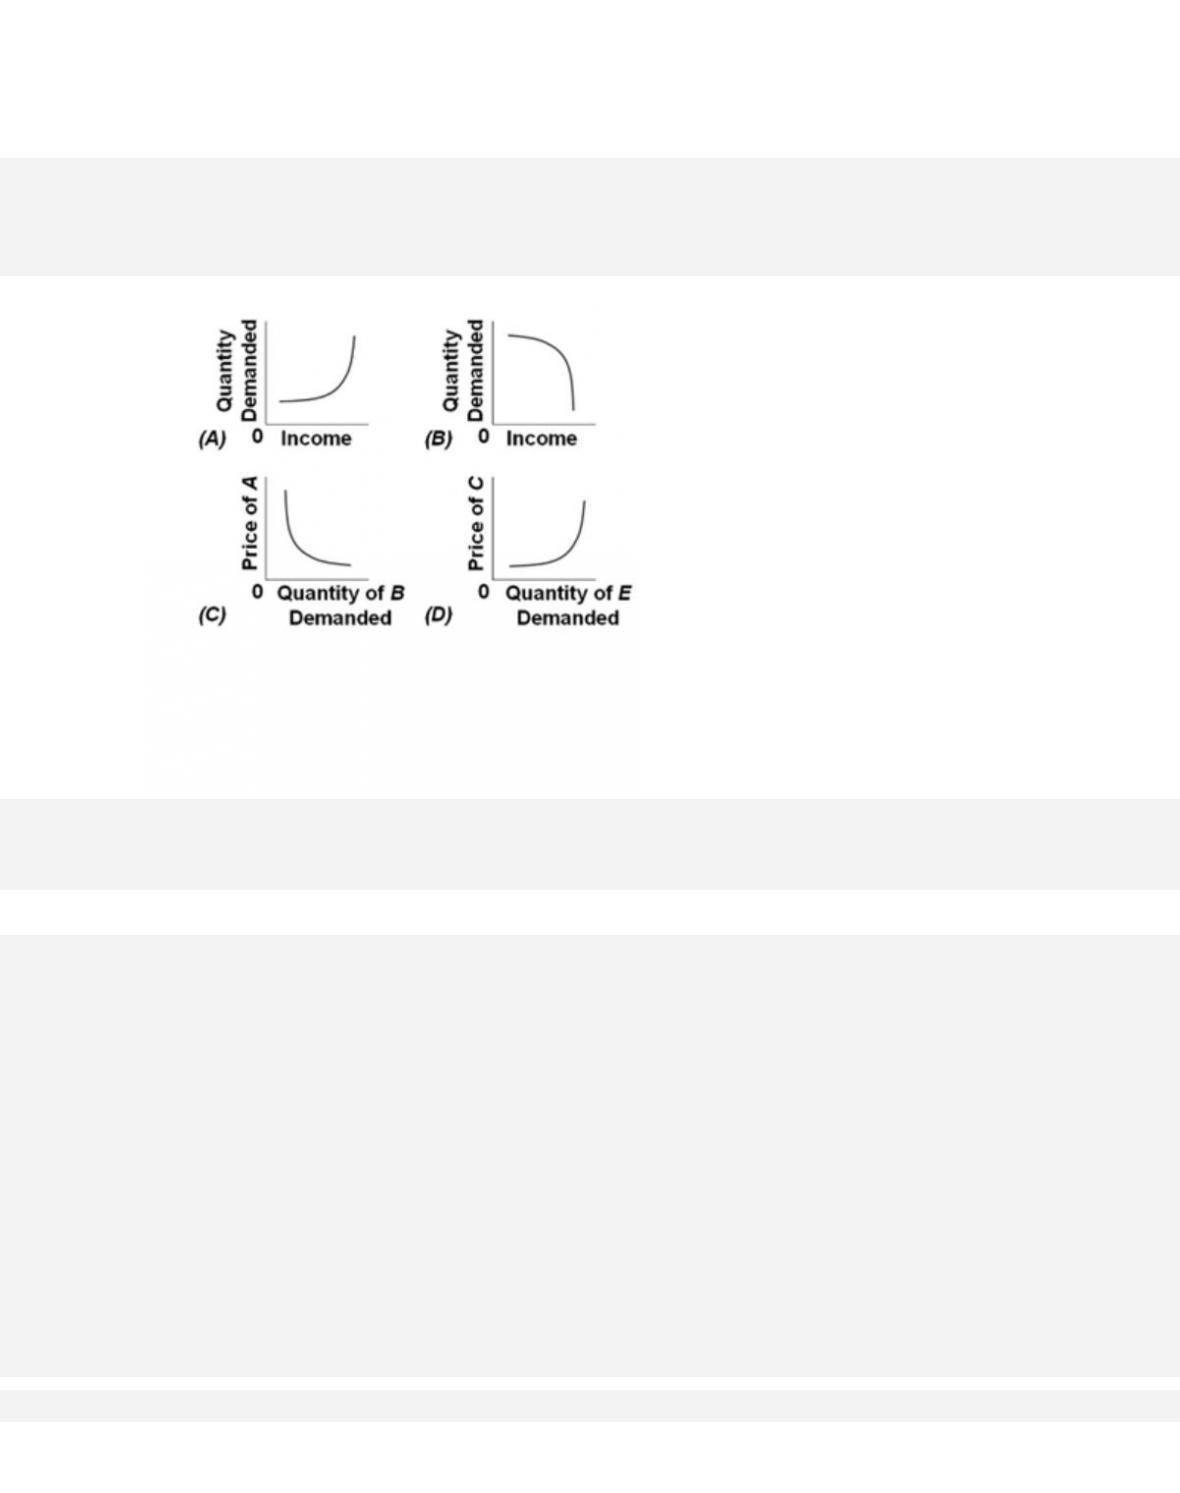
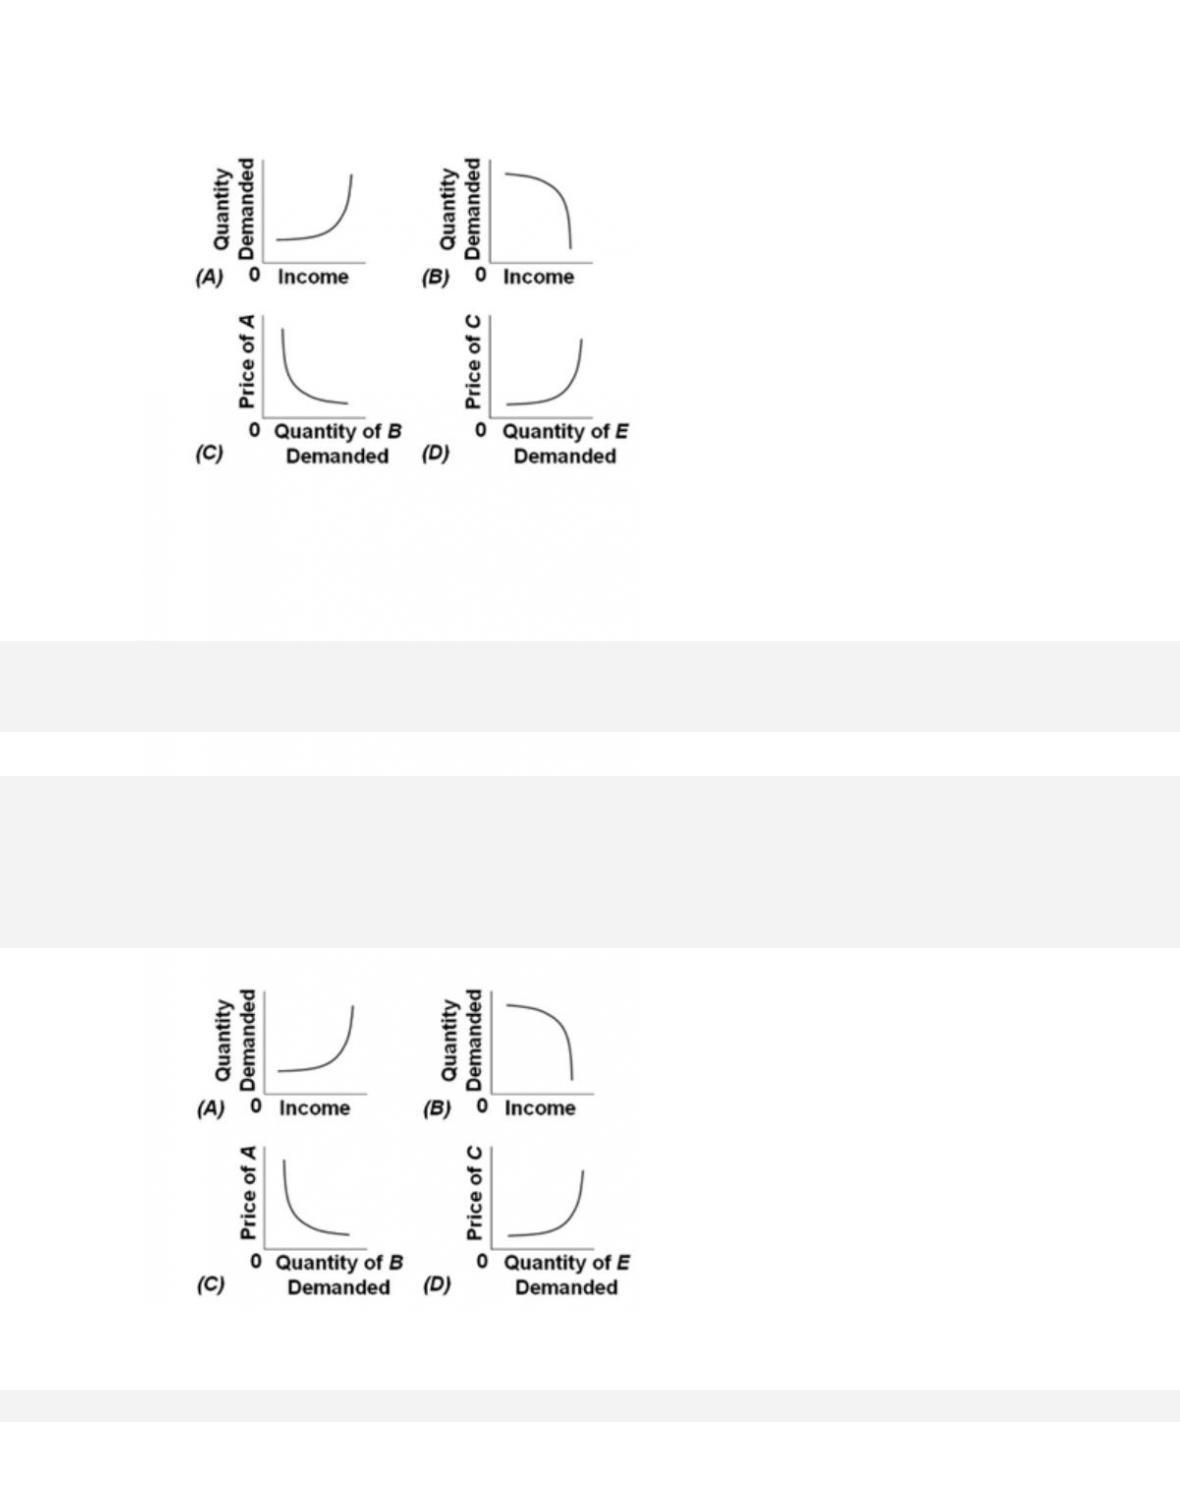
134.
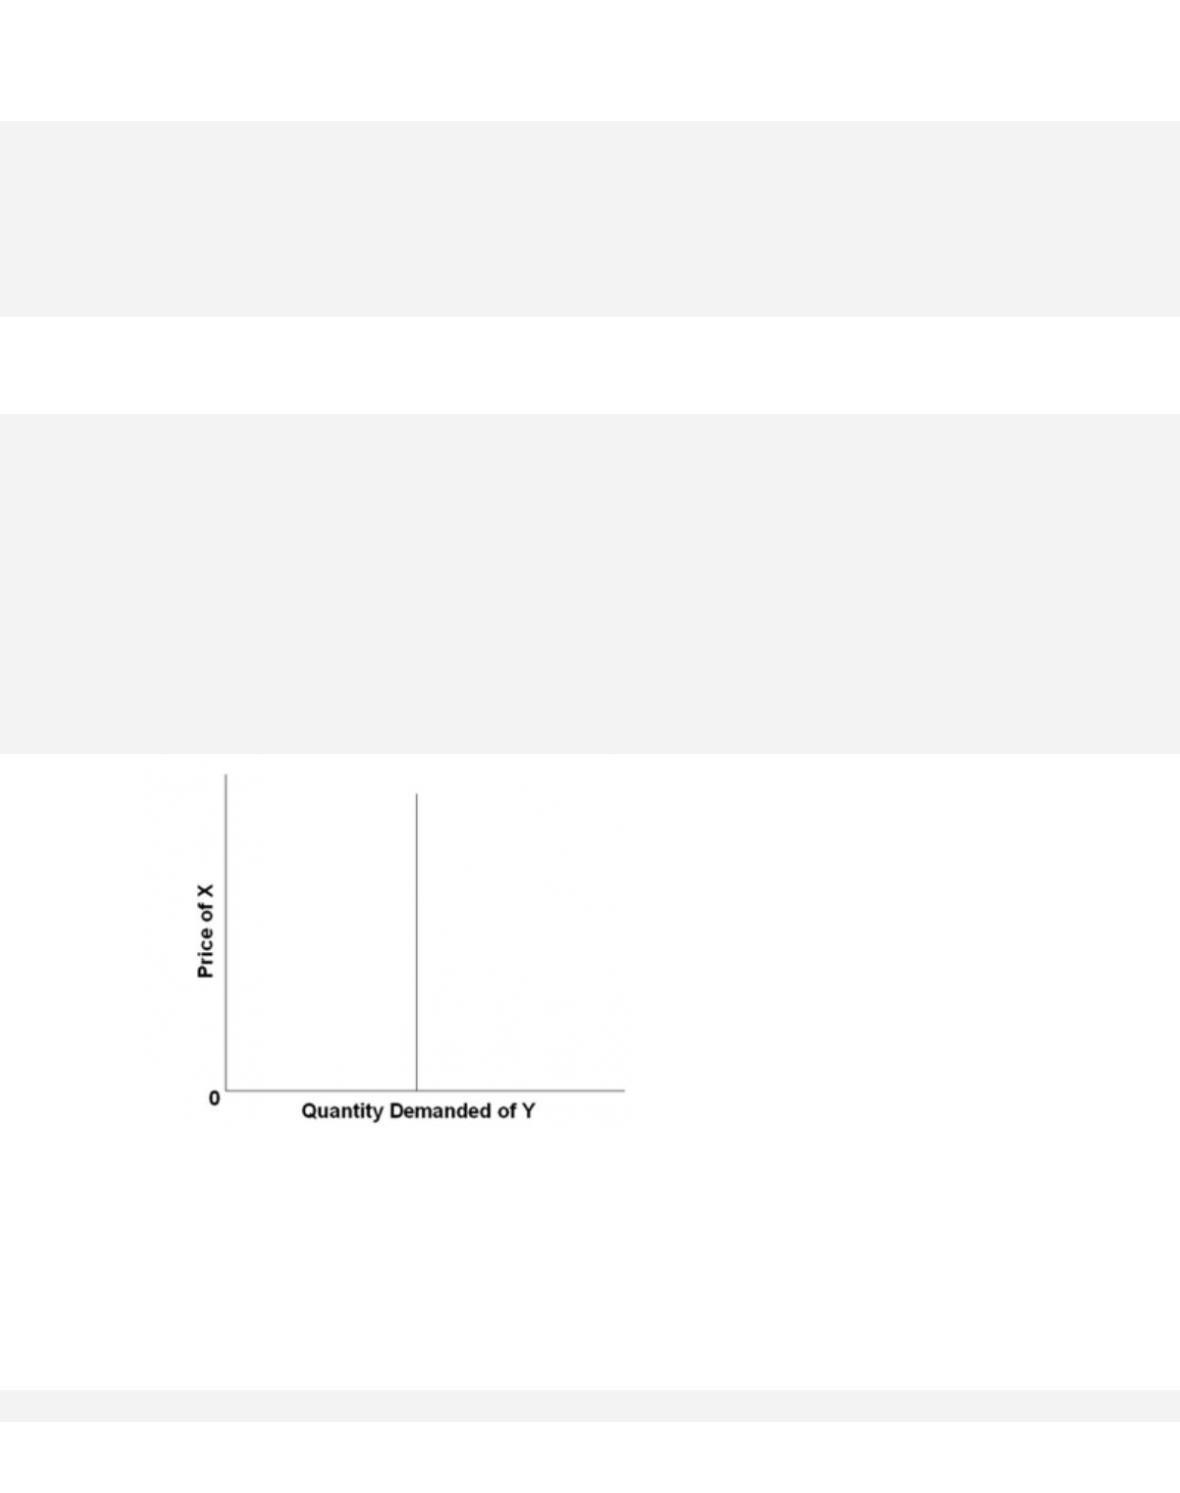
The diagram suggests that
A.
X and Y are both inferior goods.
B.
X and Y are both normal goods.

6-69
Copyright © 2018 McGraw-Hill Education. All rights reserved. No reproduction or distribution without the prior
written consent of McGraw-Hill Education.
C.
X and Y are substitute goods.
D.
X and Y are independent goods.
AACSB: Knowledge Application
Blooms: Apply
Di f f i c u l t y :
03 Hard
Learning Objective: 06-05 Apply cross elasticity of demand and income elasticity of
demand.
Test Bank: I
Topic:
Cross Elasticity and Income Elasticity of Demand
135. Compared to coffee, we would expect the cross elasticity of demand for
136.
We would expect the cross elasticity of demand for Pepsi to be greater in relation to
other soft drinks than that for soft drinks in general because
6-70
137.
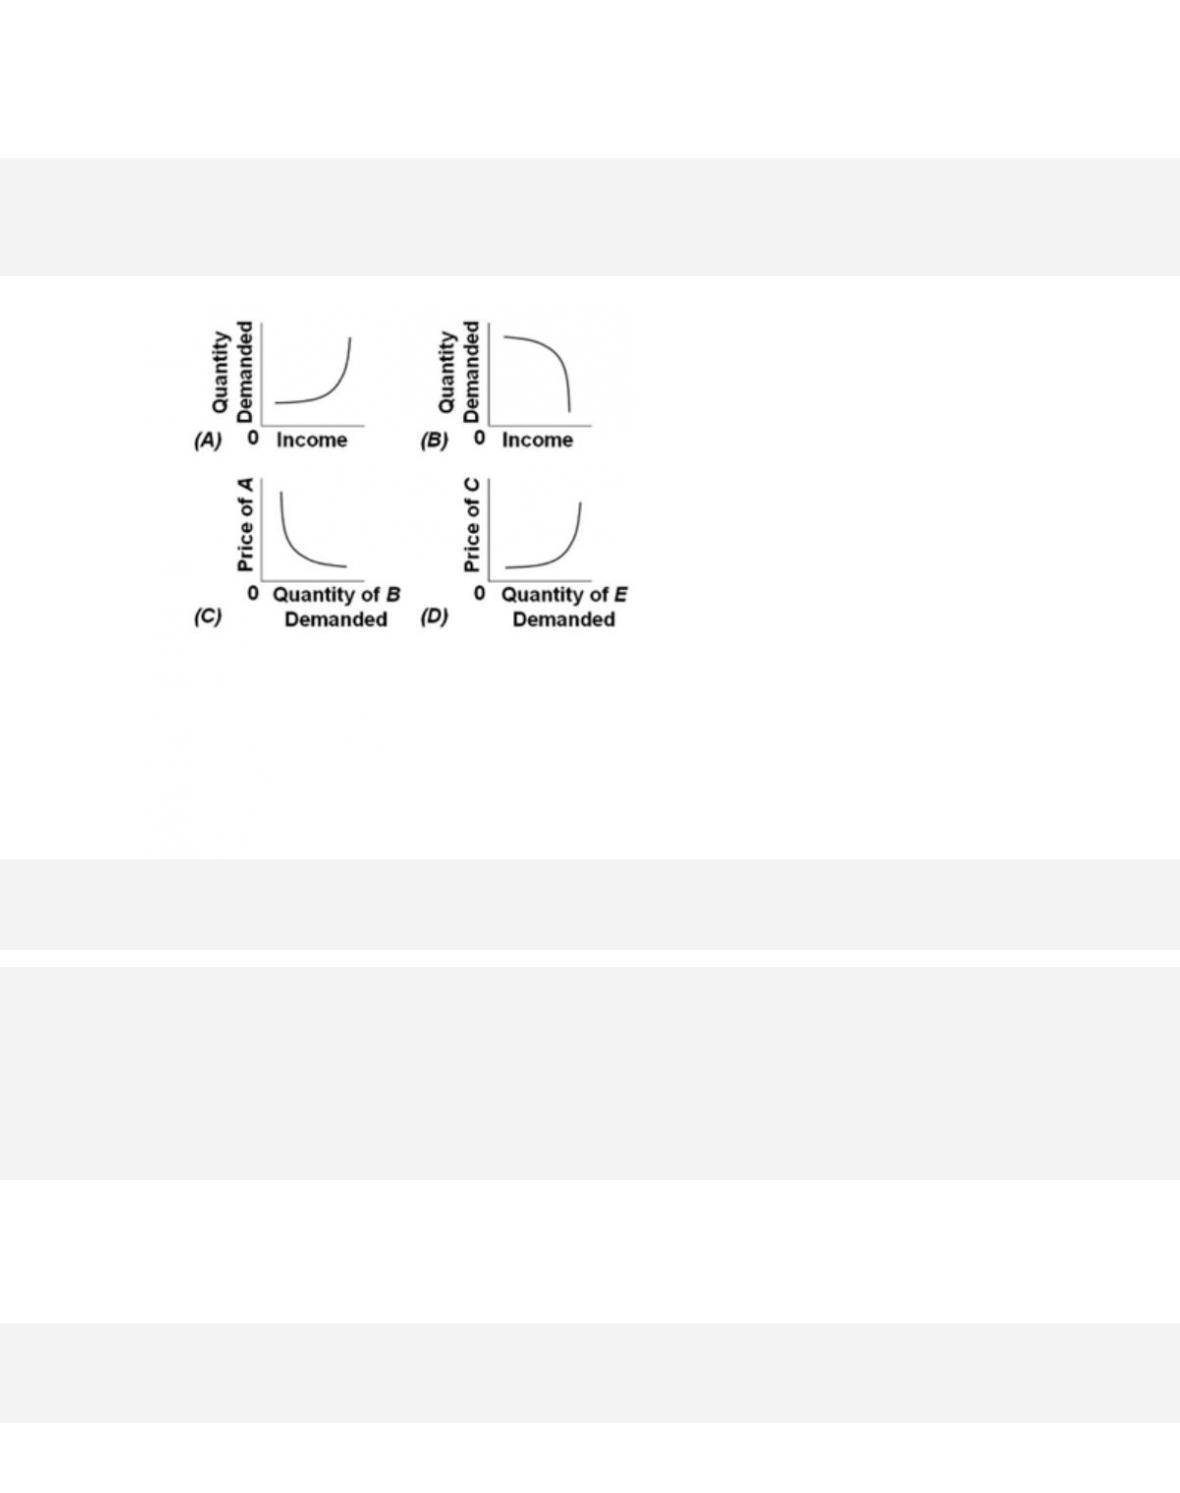
Refer to the diagrams. The case of substitute goods is represented by figure
A.
A.
138.
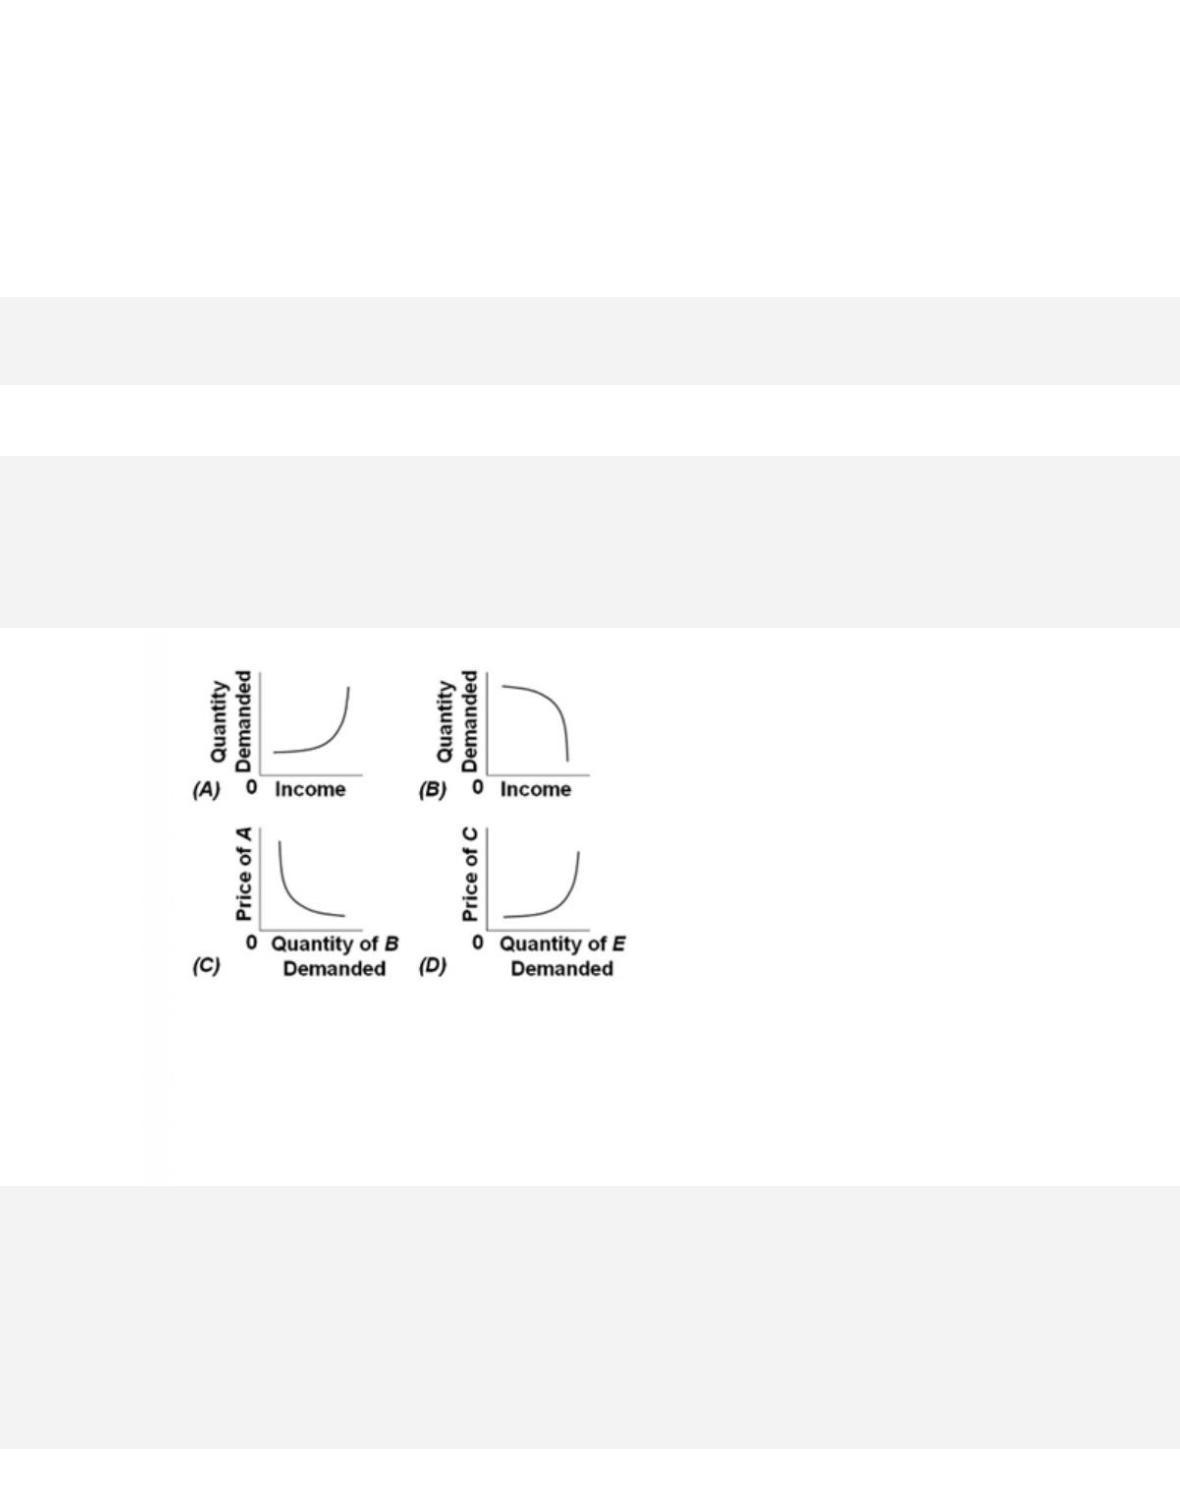
Refer to the diagrams. The case of a normal good is represented by figure
D.
D.
139.
Refer to the diagrams. The case of an inferior good is represented by figure
A. A.
6-72
Copyright © 2018 McGraw-Hill Education. All rights reserved. No reproduction or distribution without the prior
written consent of McGraw-Hill Education.
Di f f i c u l t y :
03 Hard
Learning Objective: 06-05 Apply cross elasticity of demand and income elasticity of
demand.
Test Bank: I
Topic:
Cross Elasticity and Income Elasticity of Demand
140.
Refer to the diagrams. The case of complementary goods is represented by figure
6-73
141.
Refer to the diagrams. In which case would the coefficient of income elasticity be positive?
142.
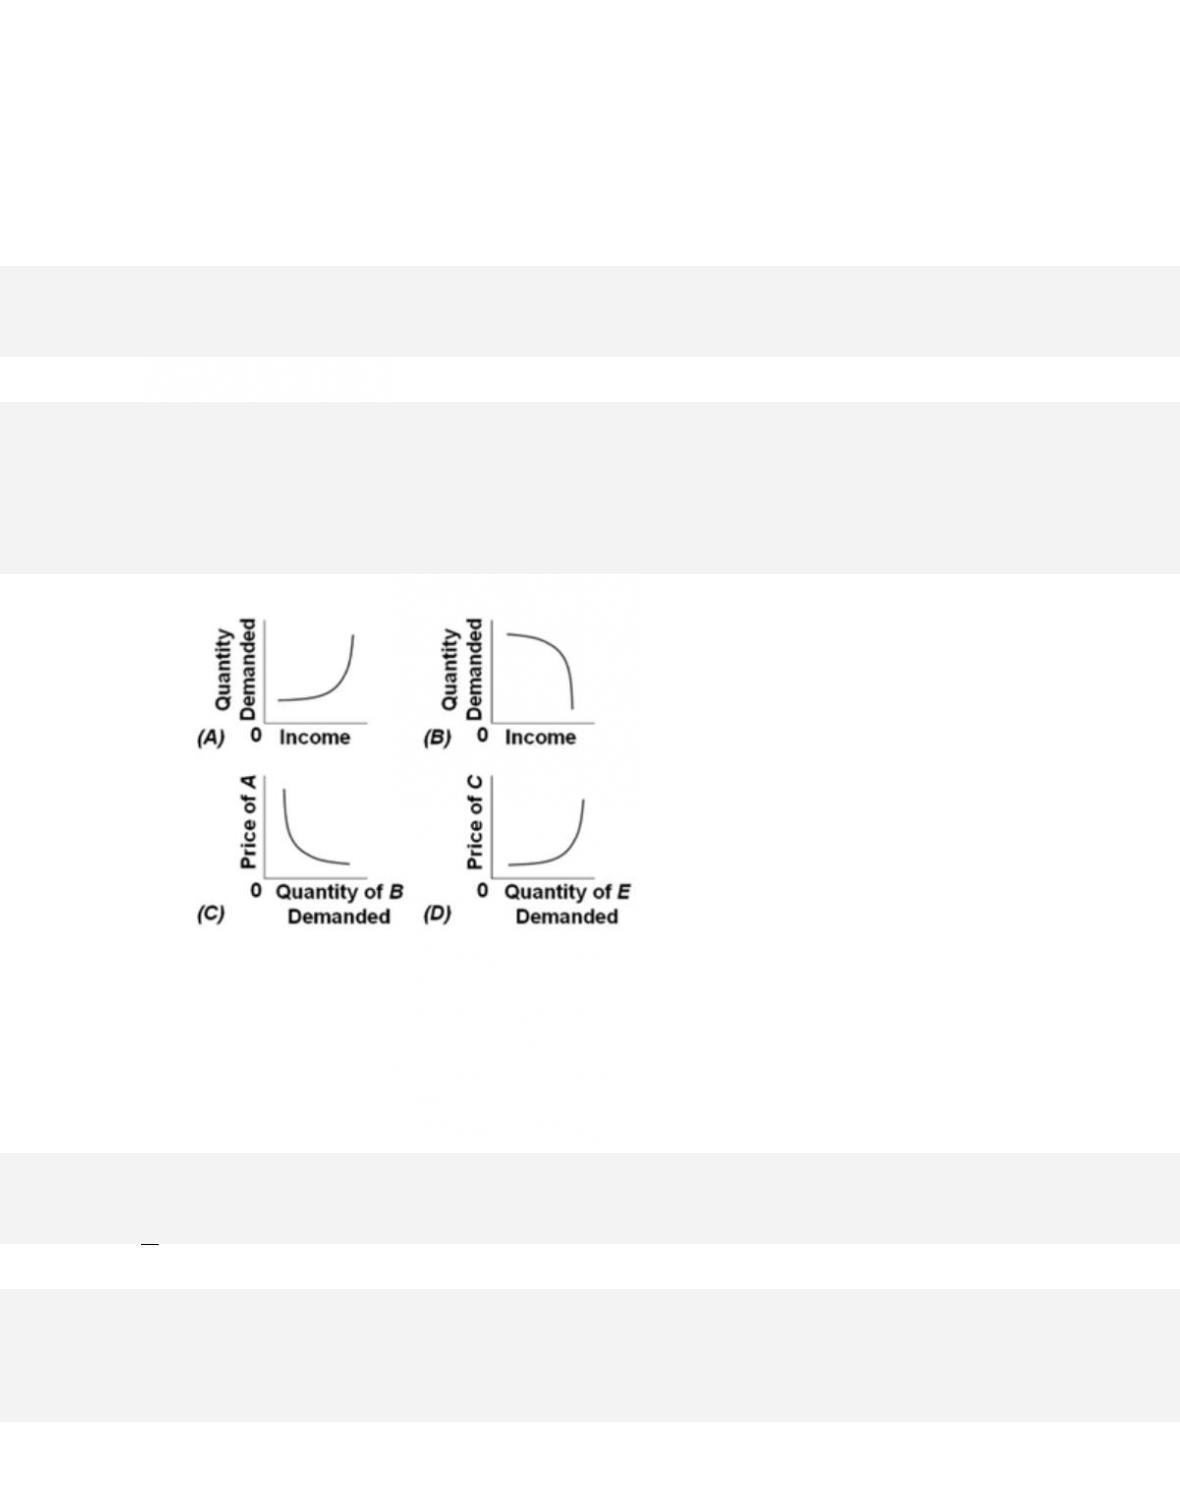
Refer to the diagrams. In which case would the coefficient of income elasticity be negative?
143.
Refer to the diagrams. In which case would the coefficient of cross elasticity of demand be
positive?
6-75
Copyright © 2018 McGraw-Hill Education. All rights reserved. No reproduction or distribution without the prior
written consent of McGraw-Hill Education.
Di f f i c u l t y :
03 Hard
Learning Objective: 06-05 Apply cross elasticity of demand and income elasticity of
demand.
Test Bank: I
Topic:
Cross Elasticity and Income Elasticity of Demand
144.
Refer to the diagrams. In which case would the coefficient of cross elasticity of demand be
negative?
145.
Suppose that a 10 percent increase in the price of normal good Y causes a 20 percent
increase in the quantity demanded of normal good X. The coefficient of cross elasticity of
demand is

6-76
Copyright © 2018 McGraw-Hill Education. All rights reserved. No reproduction or distribution without the prior
written consent of McGraw-Hill Education.
B.
negative, and therefore these goods are complements.
C.
positive, and therefore these goods are substitutes.
D. positive, and therefore these goods are complements.
AACSB: Knowledge Application
Accessibility:
Keyboard Navigation
Blooms: Apply
Di f f i c u l t y :
03 Hard
Learning Objective: 06-05 Apply cross elasticity of demand and income elasticity of
demand.
Test Bank: I
Topic:
Cross Elasticity and Income Elasticity of Demand
146.
Suppose that a 20 percent increase in the price of normal good Y causes a 10 percent
decline in the quantity demanded of normal good X. The coefficient of cross elasticity of
demand is
147.
Assume that a 4 percent increase in income across the economy produces an 8 percent
increase in the quantity demanded of good X. The coefficient of income elasticity of demand
is

6-77
Copyright © 2018 McGraw-Hill Education. All rights reserved. No reproduction or distribution without the prior
written consent of McGraw-Hill Education.
Learning Objective: 06-05 Apply cross elasticity of demand and income elasticity of
demand.
Test Bank: I
Topic:
Cross Elasticity and Income Elasticity of Demand
148.
Assume that a 6 percent increase in income in the economy produces a 3 percent
increase in the quantity demanded of good X. The coefficient of income elasticity of demand
is
149.
Assume that a 3 percent increase in income across the economy produces a 1 percent
decline in the quantity demanded of good X. The coefficient of income elasticity of demand
for
good X is
150.
Which type of goods is most adversely affected by recessions?

6-78
Copyright © 2018 McGraw-Hill Education. All rights reserved. No reproduction or distribution without the prior
written consent of McGraw-Hill Education.
B.
Goods for which the income elasticity coefficient is relatively high and positive.
C.
Goods for which the cross elasticity coefficient is positive.
D.
Goods for which the cross elasticity coefficient is negative.
AACSB: Knowledge Application
Accessibility:
Keyboard Navigation
Blooms: Apply
Di f f i c u l t y :
03 Hard
Learning Objective: 06-05 Apply cross elasticity of demand and income elasticity of
demand.
Test Bank: I
Topic:
Cross Elasticity and Income Elasticity of Demand
151.
Which of the following goods (with their respective income elasticity coefficients in
parentheses) will most likely suffer a decline in demand during a recession?
A.
dinner at a nice restaurant (+1.8)
152.
Which of the following goods will least likely suffer a decline in demand during a
recession?

6-79
Copyright © 2018 McGraw-Hill Education. All rights reserved. No reproduction or distribution without the prior
written consent of McGraw-Hill Education.
Test Bank: I
Topic:
Cross Elasticity and Income Elasticity of Demand
153.
(Consider This) Elastic demand is analogous to a , and inelastic demand to a .
154.
(Consider This) Elasticity can be thought of as degree of relative
155.
(Consider This) The supply of higher education in the United States is

6-80
Copyright © 2018 McGraw-Hill Education. All rights reserved. No reproduction or distribution without the prior
written consent of McGraw-Hill Education.
Learning Objective: 06-01 Discuss price elasticity of demand and how it is calculated.
Test Bank: I
Topic:
Price Elasticity of Demand
156.
(Consider This) Which of the following best explains the significant increases in the
equilibrium prices for higher education in the United States since the 1980s?
A.
The demand for higher education is highly price inelastic, and the supply has decreased
157.
(Last Word) Suppose that a firm has "pricing power" and can segregate its market into
two distinct groups based on differences in elasticities of demand. The firm might charge
A. a lower price to the group that has the less elastic demand.
158.
(Last Word) Microsoft charges a substantially lower price for a software upgrade than


