169.
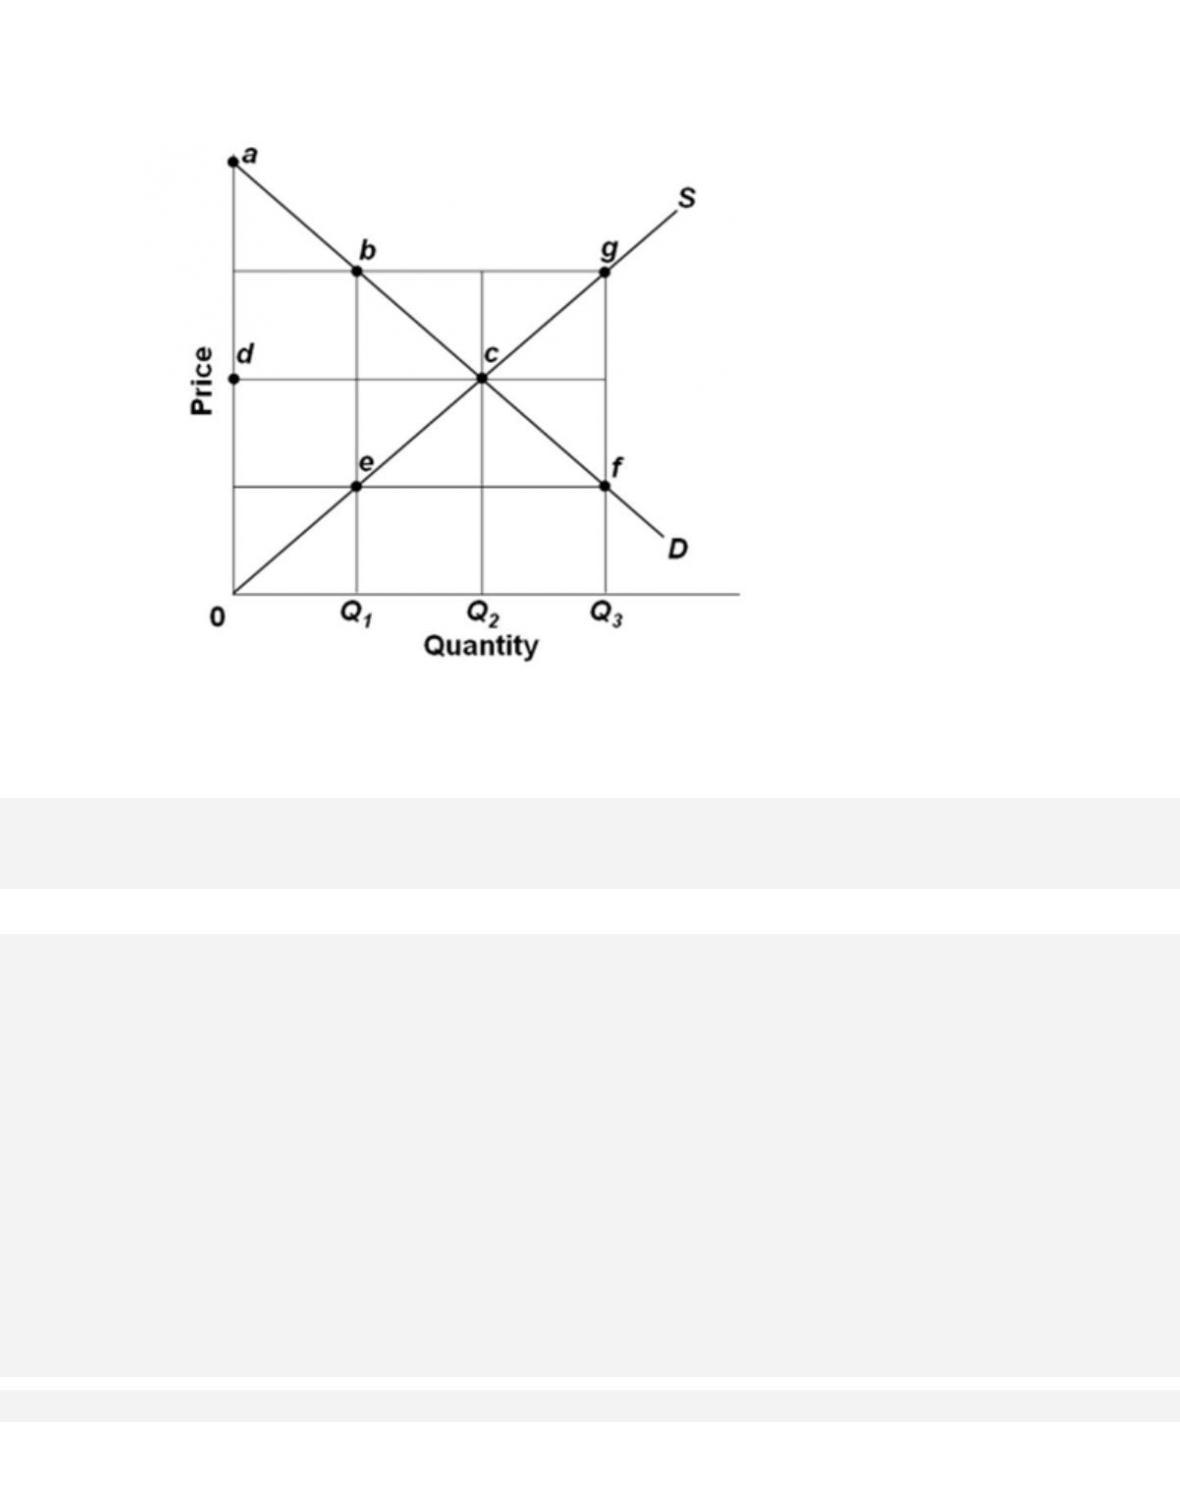
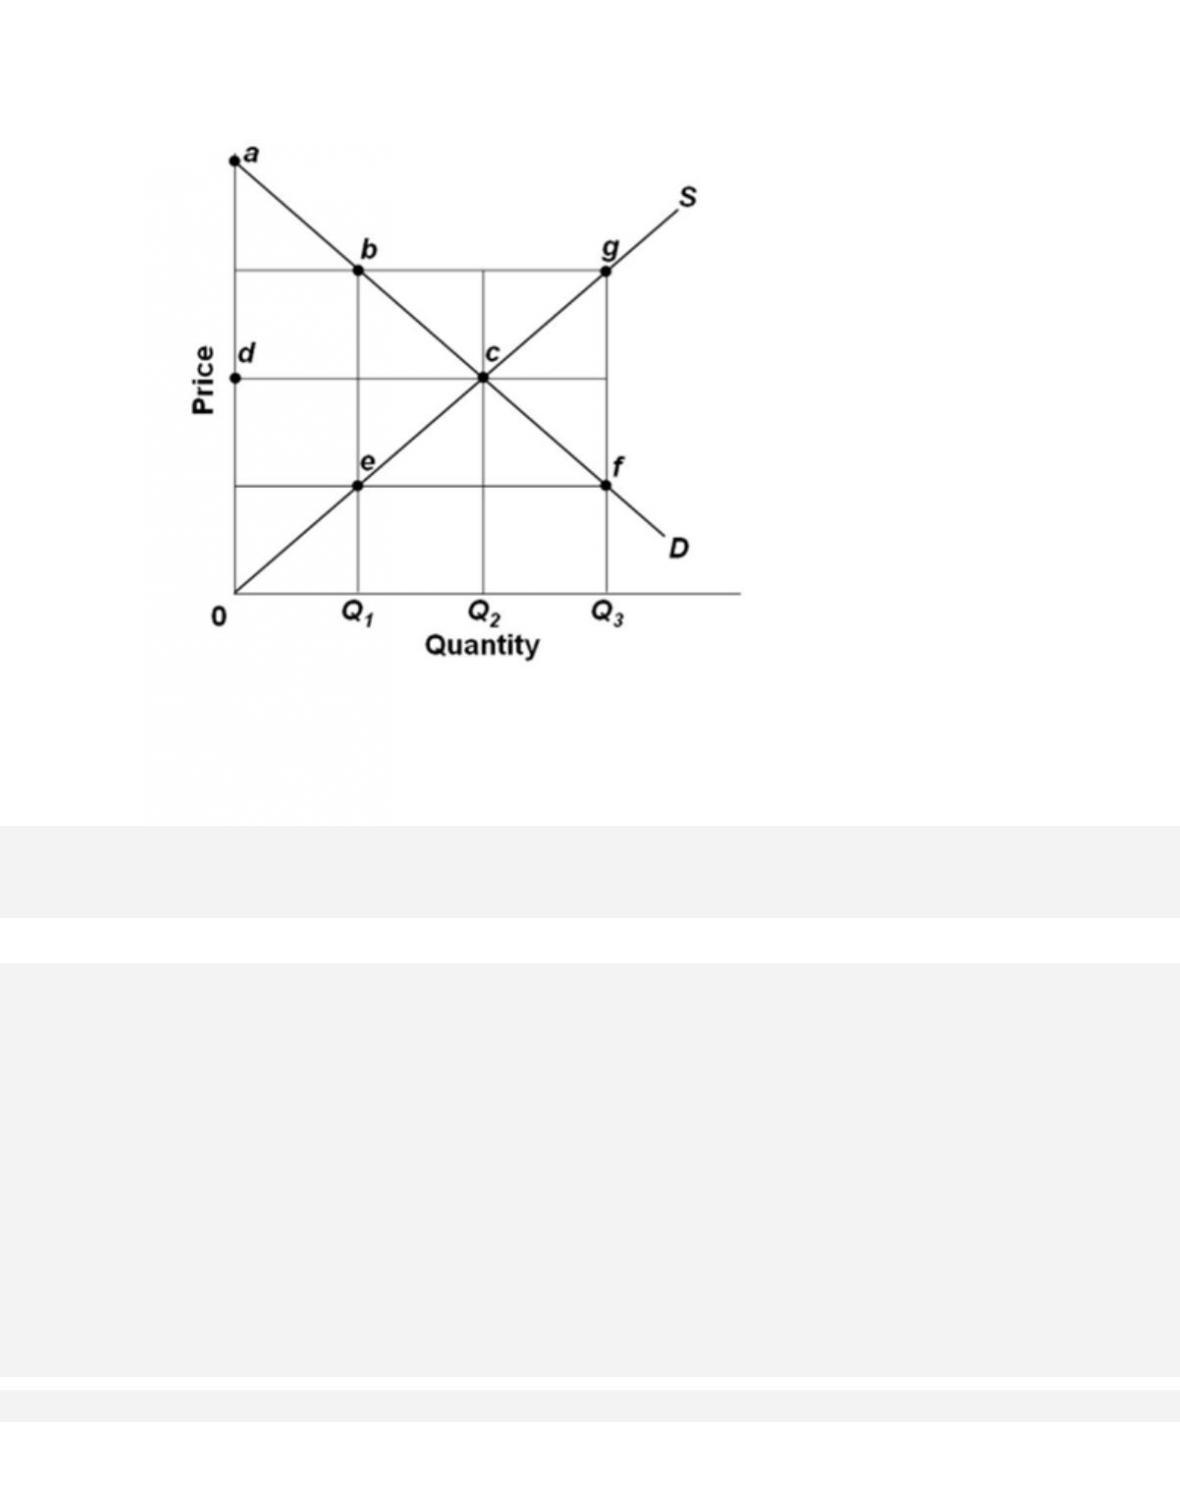
Refer to the provided graph of a competitive market. If the output level is Q2, then there will be
170.
Refer to the provided graph of a competitive market. If the output level is Q1, then there are
efficiency losses indicated by the area
171.
Refer to the provided graph of a competitive market. If the output level is Q1, then the sum of
the consumer and producer surplus is
172.
Refer to the provided graph of a competitive market. If the output level increases from Q2 to
Q3, then the
173.
What are the two characteristics that differentiate private goods from public goods?

4-85
Copyright © 2018 McGraw-Hill Education. All rights reserved. No reproduction or distribution without the prior
written consent of McGraw-Hill Education.
C.
marginal cost and marginal benefit
D.
ownership and usage
174.
Private firms can hardly produce a public good profitably because of
175.
Among the following examples, the one that best illustrates a public good is

176.
A public good
A.
generally results in substantial negative externalities.
177.
Assume there is no way to prevent someone from using an interstate highway, regardless of
whether or not he or she helps pay for it. This characteristic is called
178.
Which of the following statements concerning a pure public good is false?
A.
It is impossible to exclude nontaxpayers from the enjoyment of the public good.

4-87
Copyright © 2018 McGraw-Hill Education. All rights reserved. No reproduction or distribution without the prior
written consent of McGraw-Hill Education.
A c c e s s i b i l i t y :
Keyboard Navigation
Blooms: Understand
D i f f i c u l t y :
02 Medium
Learning Objective: 04–03 Describe free riding and public goods, and illustrate why private
firms cannot normally produce public goods.
Test Bank: II
Topic:
Public Goods
179.
The market demand curve for a public good
A.
is derived in the same manner as demand curves for private goods.
4-88
180.
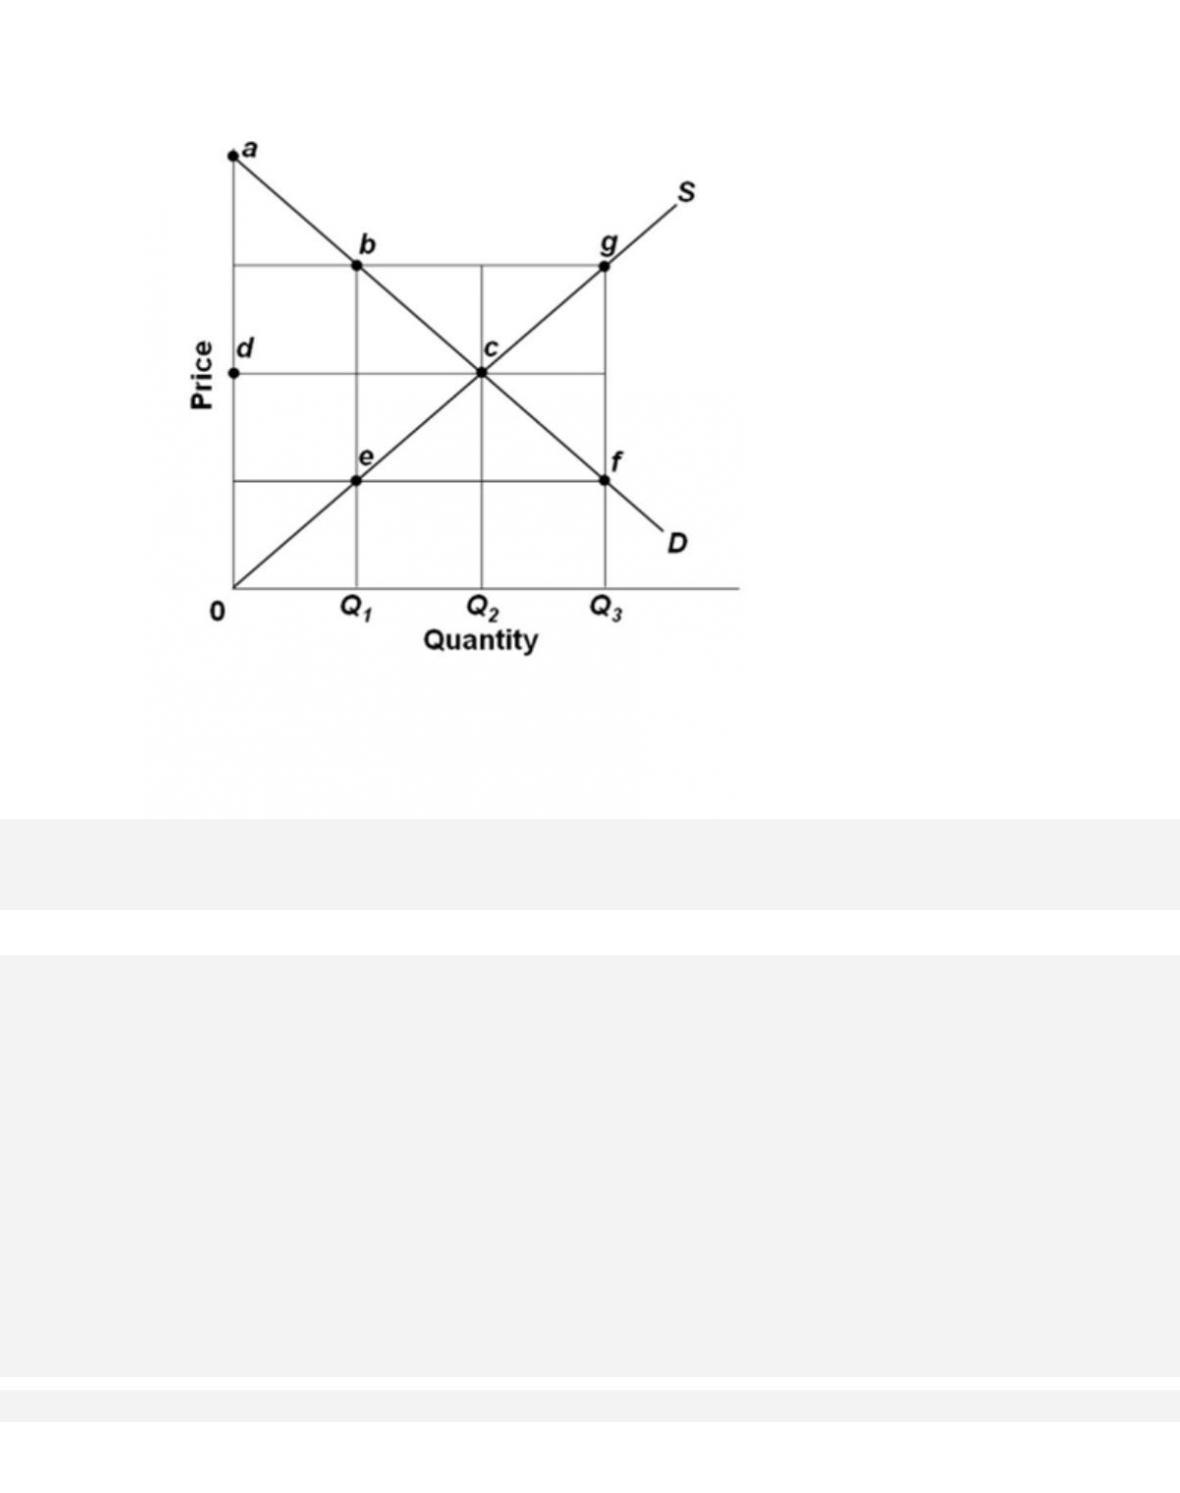
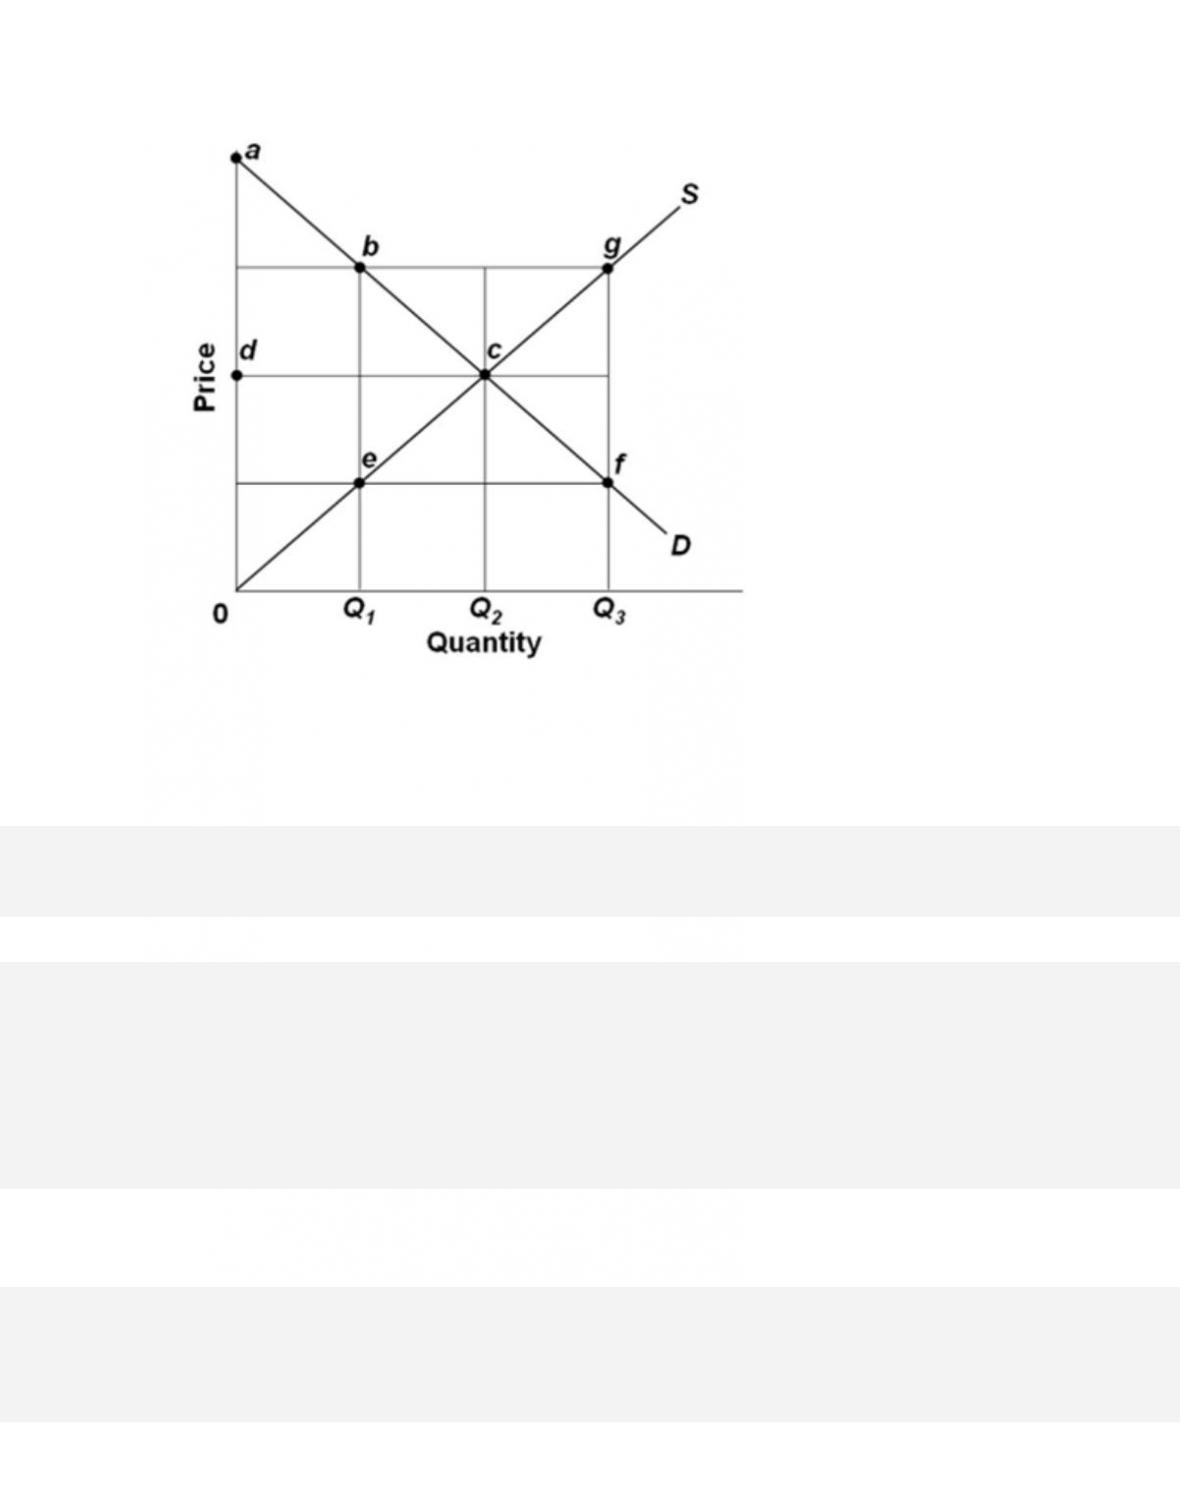
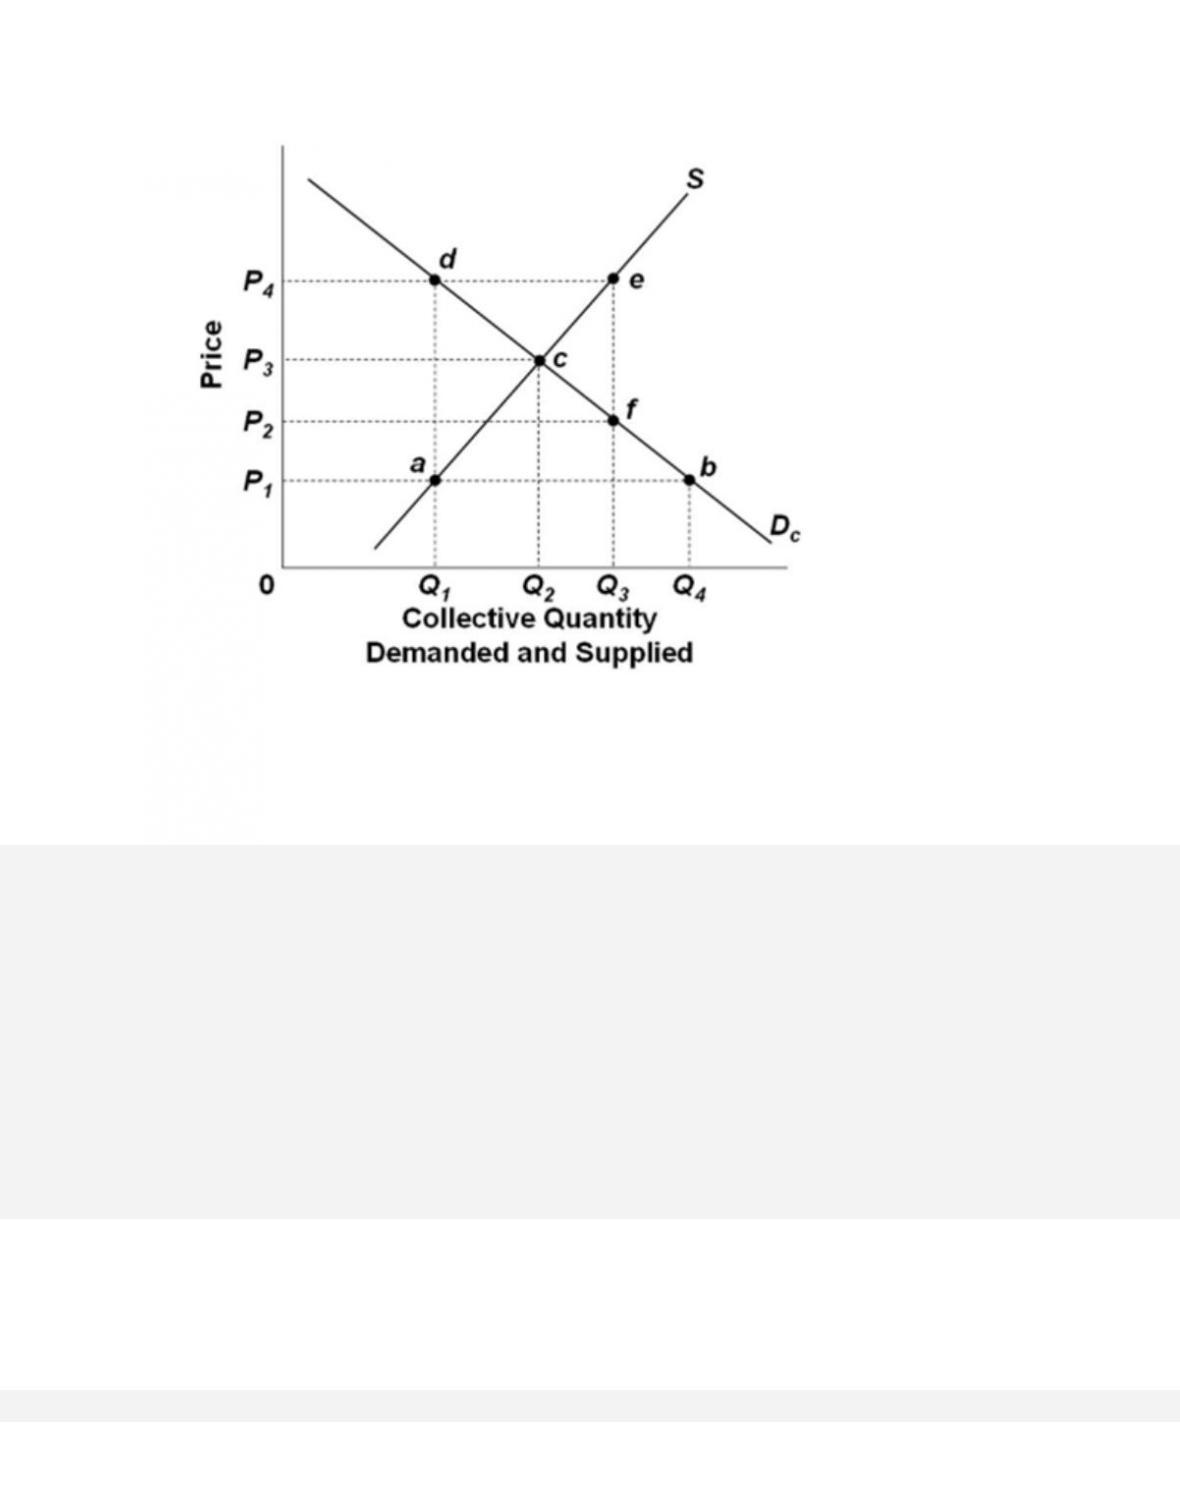
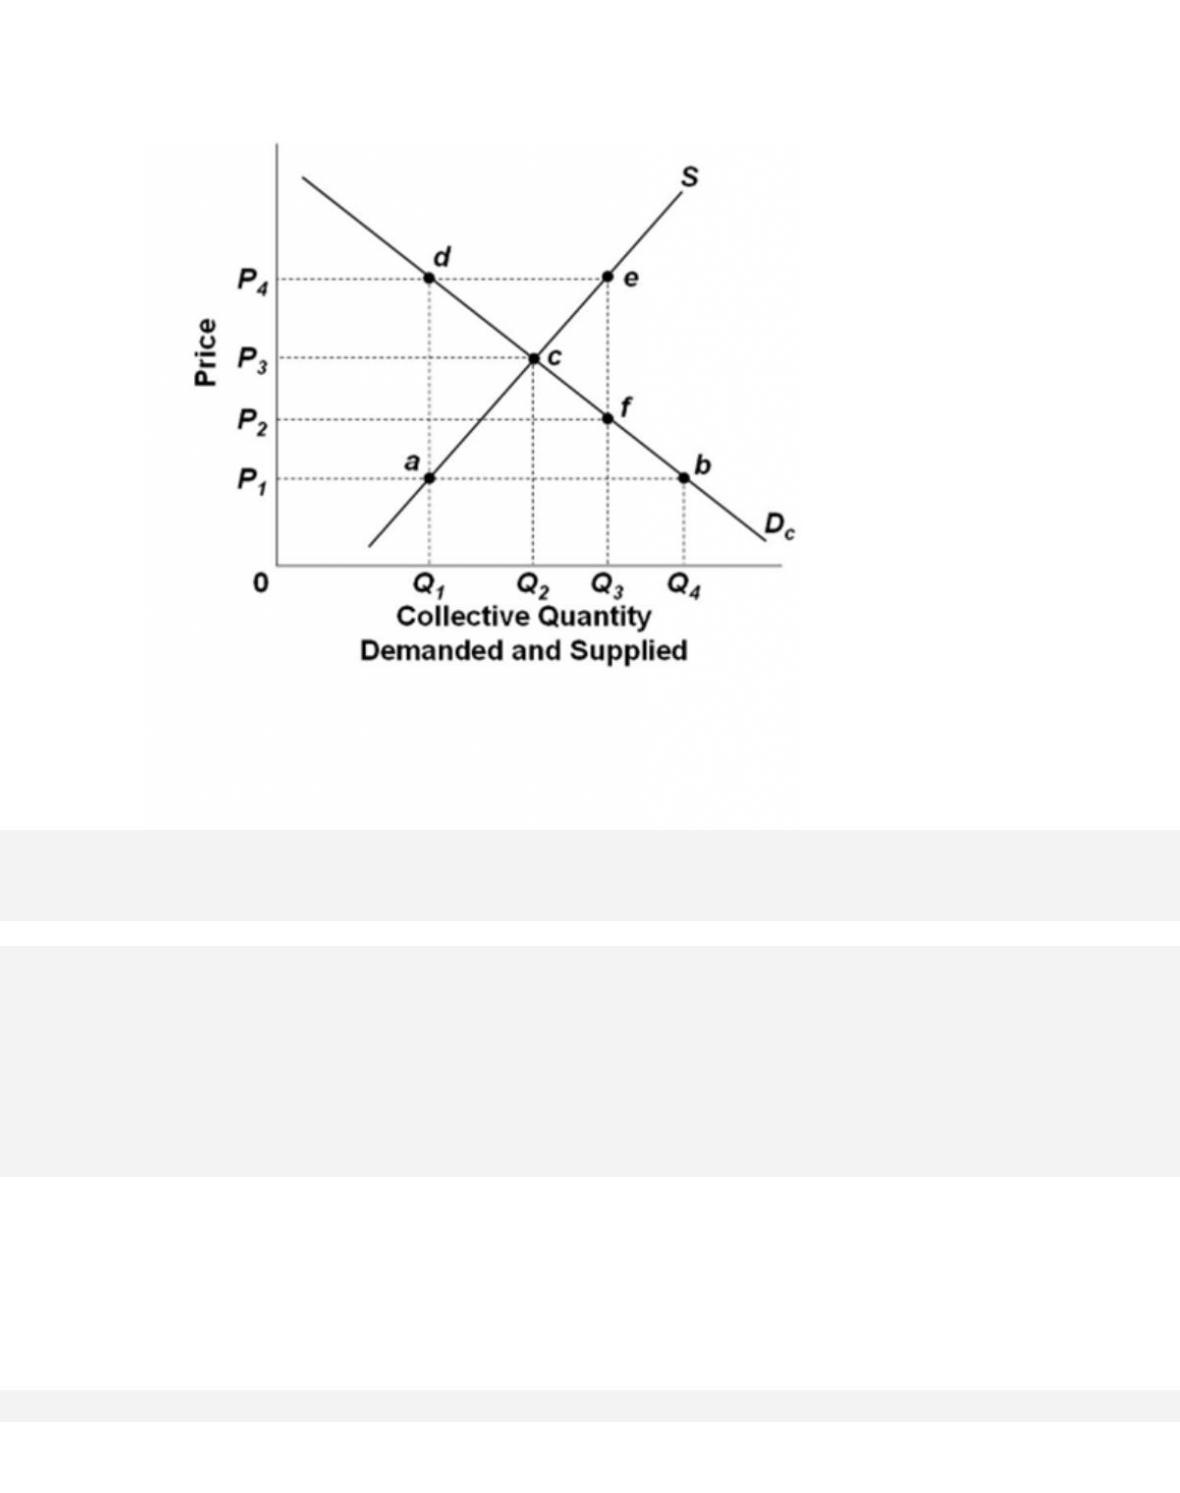
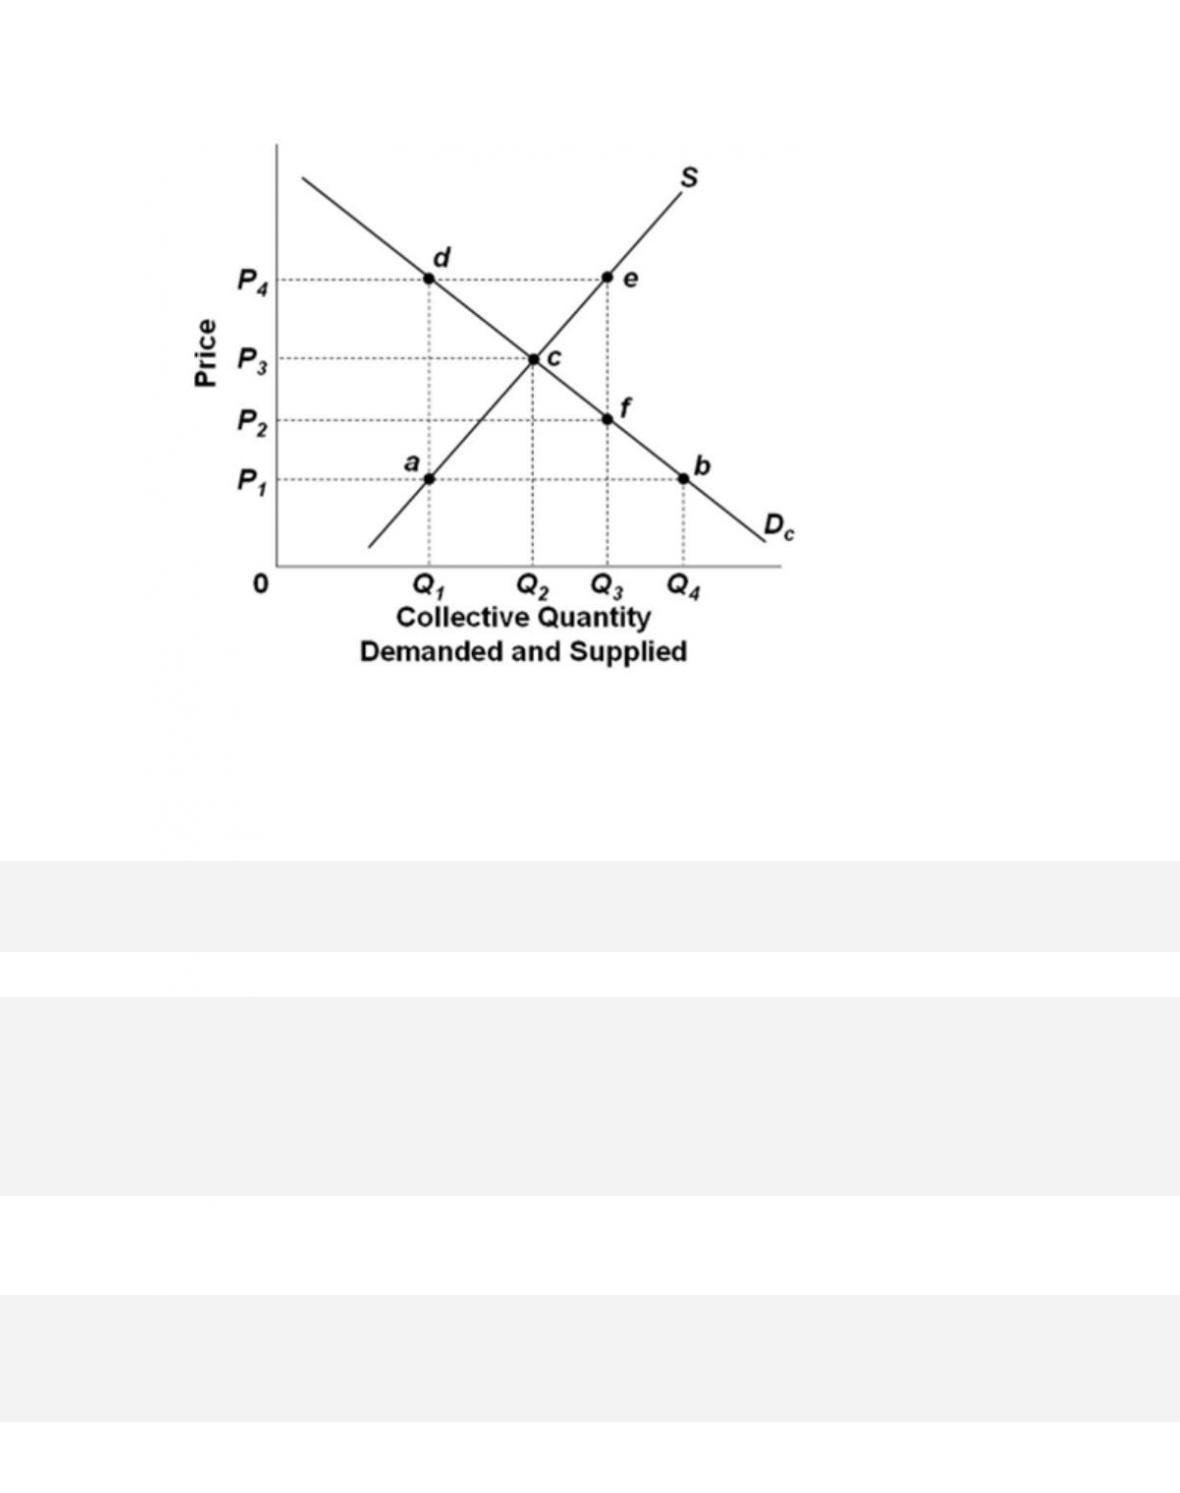
Refer to the provided supply and demand graph for a public good. Point c on the graph shows
where the
A. total benefit equals the total cost of the public good.
4-89
181.
Refer to the provided supply and demand graph for a public good. If Q1 units of the public good
are produced, then
182.
Refer to the provided supply and demand graph for a public good. Which line segment would
indicate the amount by which the marginal benefit of this public good exceeds the marginal cost
at a certain quantity?
183.
Street entertainers face the free-rider problem when they perform because of the

4-91
Copyright © 2018 McGraw-Hill Education. All rights reserved. No reproduction or distribution without the prior
written consent of McGraw-Hill Education.
C. nonexcludability characteristic.
D. rivalry characteristic.
184.
For the music industry, the rise of Internet file-sharing of music has
185.
Government can reallocate resources away from private goods toward public goods,
usually through

4-92
186.
Answer this question on the basis of the following information for a public good. Pa and Pb
represent the prices that citizens (a) and (b), the only two people in this nation, are willing to
pay for additional units of a quantity (Qc) of the public good. Qs represents the
quantity of the
public good supplied by government at each of the collective prices.
Qc
Pa
Pb
Qs
1
$4
$5
5
2
3
4
4
3
2
4
3
4
2
3
2
5
1
2
1
The collective willingness of this nation to pay for the fourth unit of the public good is
A. $7.
187. Answer this question on the basis of the following information for a public good. Pa and
Pb represent the prices that citizens (a) and (b), the only two people in this nation, are willing to
pay for additional units of a quantity (Qc) of the public good. Qs represents the
quantity of the
public good supplied by government at each of the collective prices.
Qc
Pa
Pb
Qs
1
$4
$5
5
2
3
4
4
3
2
4
3
4
2
3
2
5
1
2
1

If only 1 unit of this public good is produced, then the marginal benefit is
A.
$3, and the marginal cost is $9.
188. Answer this question on the basis of the following information for a public good. Pa and
Pb represent the prices that citizens (a) and (b), the only two people in this nation, are willing to
pay for additional units of a quantity (Qc) of the public good. Qs represents the
quantity of the
public good supplied by government at each of the collective prices.
Qc
Pa
Pb
Qs
1
$4
$5
5
2
3
4
4
3
2
4
3
4
2
3
2
5
1
2
1
In equilibrium, the marginal benefit and cost of the public good will be
A. $7.

4-94
Copyright © 2018 McGraw-Hill Education. All rights reserved. No reproduction or distribution without the prior
written consent of McGraw-Hill Education.
firms cannot normally produce public goods.
Test Bank: II
Topic:
Public Goods
189. New Normal University has found it necessary to institute a crime-control program on its
campus to deal with the high costs of theft and vandalism. The university is now considering
several alternative levels of crime control. This table shows the expected total
annual costs
and benefits of these alternatives.
Total
Costs Per
Year
Total Benefits Per Year
(reduction in the costs
of
crime)
Level One -1 Security
Officer
$20,000
$ 80,000
Level Two -1 Security
Officer With Guard Dog
30,000
120,000
Level Three -1 Security
Officer With Guard Dog
and Patrol Car
40,000
140,000
Level Four -2 Security
Officers With Guard Dog
50,000
155,000
Level Five -2 Security
Officers With Guard Dog
and Patrol Car
60,000
160,000
The marginal benefits of crime control for Level Two are
190.
New Normal University has found it necessary to institute a crime-control program on its

4-95
campus to deal with the high costs of theft and vandalism. The university is now considering
several alternative levels of crime control. This table shows the expected total
annual costs
and benefits of these alternatives.
Total
Costs Per
Year
Total Benefits Per Year
(reduction in the costs
of
crime)
Level One -1 Security
Officer
$20,000
$ 80,000
Level Two -1 Security
Officer With Guard Dog
30,000
120,000
Level Three -1 Security
Officer With Guard Dog
and
Patrol Car
40,000
140,000
Level Four -2 Security
Officers With Guard Dog
50,000
155,000
Level Five -2 Security
Officers With Guard Dog
and Patrol Car
60,000
160,000
If New Normal University undertakes program Level Three,
191. New Normal University has found it necessary to institute a crime-control program on its
campus to deal with the high costs of theft and vandalism. The university is now considering
several alternative levels of crime control. This table shows the expected total
annual costs
and benefits of these alternatives.
Total
Costs
Total Benefits Per Year

4-96
Per
Year
(reduction in the costs
of
crime)
Level One -1 Security
Officer
$20,000
$ 80,000
Level Two -1 Security
Officer
With Guard Dog
30,000
120,000
Level Three -1 Security
Officer With Guard Dog
and
Patrol Car
40,000
140,000
Level Four -2 Security
Officers With Guard Dog
50,000
155,000
Level Five -2 Security
Officers
With Guard Dog
and Patrol
Car
60,000
160,000
Based on cost-benefit analysis, New Normal University should undertake Level
192. Assume that a government is considering a new social program and may choose to include
in this program one of four progressively larger projects. The marginal cost and the marginal
benefits of each of the four projects are given in the table below.
Project
Marginal Cost
Marginal Benefit
A
$1 Billion
$2 Billion
B
3 Billion
3 Billion
C
5 Billion
7 Billion
D
7 Billion
8 Billion
Which project should the government select to achieve the maximum net benefit?

193. Assume that a government is considering a new social program and may choose to include
in this program one of four progressively larger projects. The marginal cost and the marginal
benefits of each of the four projects are given in the table below.
Project
Marginal Cost
Marginal
Benefit
A
$1 Billion
$2 Billion
B
3 Billion
3 Billion
C
5 Billion
7 Billion
D
7 Billion
8 Billion
Suppose that the government chooses to do project C. What is the total cost and total benefit of
doing project C?

4-98
Copyright © 2018 McGraw-Hill Education. All rights reserved. No reproduction or distribution without the prior
written consent of McGraw-Hill Education.
Test Bank: II
Topic:
Public Goods
194.
Assume that a government is considering a new social program and may choose to include
in this program one of four progressively larger projects. The marginal cost and the marginal
benefits of each of the four projects are given in the table below.
Project
Marginal Cost
Marginal Benefit
A
$1 Billion
$2 Billion
B
3 Billion
3 Billion
C
5 Billion
7 Billion
D
7 Billion
8 Billion
Refer to the provided table and information. What is the net benefit of project D?
195.
A government is considering undertaking a construction project of an increasing scale
(ranging from 1, 2, 3, to 4). The estimated marginal costs and marginal benefits of each
successive scale of the project are given in the table below.
Project
Marginal Cost
(in millions)
Marginal Benefit
(in
millions)
1
$8
$11
2
11
13
3
18
17
4
28
23
What is the total amount that the government should spend on the construction project to attain

maximum net benefits for the society?
196.
A government is considering undertaking a construction project of an increasing scale
(ranging from 1, 2, 3, to 4). The estimated marginal costs and marginal benefits of each
successive scale of the project are given in the table below.
Project
Marginal Cost
(in millions)
Marginal
Benefits(in
millions)
1
$8
$11
2
11
13
3
18
17
4
28
23
What is the total cost and total benefit of the scale-3 project?

4-100
Copyright © 2018 McGraw-Hill Education. All rights reserved. No reproduction or distribution without the prior
written consent of McGraw-Hill Education.
firms cannot normally produce public goods.
Test Bank: II
Topic:
Public Goods
197.
A government is considering undertaking a construction project of an increasing scale
(ranging from 1, 2, 3, to 4). The estimated marginal costs and marginal benefits of each
successive scale of the project are given in the table below.
Project
Marginal Cost
(in million )
Marginal Benefit
(in
millions)
1
$8
$11
2
11
13
3
18
17
4
28
23
What is the net benefit of project scale 2?
198.
Which of the following is an example of a negative externality?