
4-21
Test Bank: I
Topic:
Public Goods
46. Answer the question on the basis of the following information for a public good. Pa and Pb
are the prices that individuals A and B are willing to pay for the last unit of a public good, rather
than do without it. These people are the only two members of society.
Q
Pa
Pb
1
$3
$5
2
2
4
3
1
3
4
0
2
5
0
1
The collective willingness of this society to pay for the second unit of this public good is
47. Answer the question on the basis of the following information for a public good. Pa and Pb
are the prices that individuals A and B are willing to pay for the last unit of a public good, rather
than do without it. These people are the only two members of society.
Q
Pa
Pb
1
$3
$5
2
2
4
3
1
3
4
0
2
5
0
1
If the marginal cost of producing this good at the optimal quantity is $4, the optimal quantity

must be
48. Answer the question on the basis of the following information for a public good. Pa and Pb
are the prices that individuals A and B are willing to pay for the last unit of a public good, rather
than do without it. These people are the only two members of society.
Q
Pa
Pb
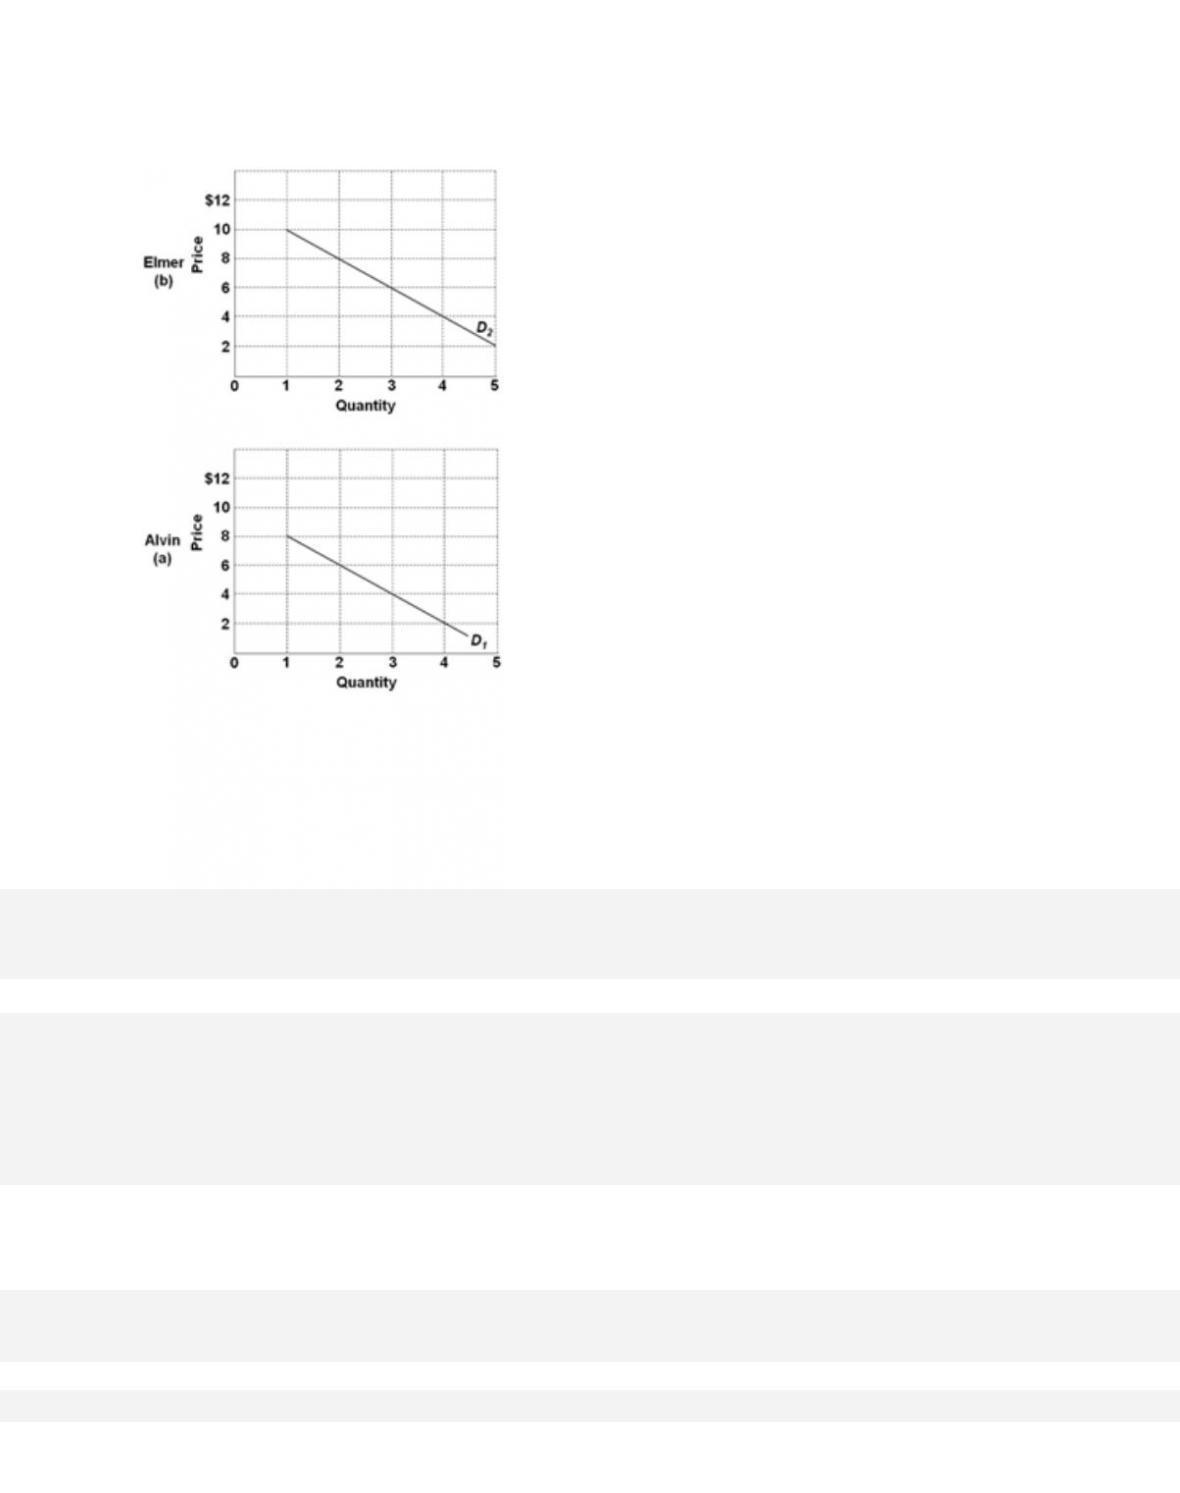
1
$3
$5
2
2
4
3
1
3
4
0
2
5
0
1
Suppose government has already produced 4 units of this public good. The amount individual B
is willing voluntarily to pay for the fourth unit is

4-23
Copyright © 2018 McGraw-Hill Education. All rights reserved. No reproduction or distribution without the prior
written consent of McGraw-Hill Education.
Topic:
Public Goods
49. Answer the question on the basis of the following information for a public good. Pa and Pb
are the prices that individuals A and B are willing to pay for the last unit of a public good, rather
than do without it. These people are the only two members of society.
Q
Pa
Pb
1
$3
$5
2
2
4
3
1
3
4
0
2
5
0
1
If this good were a private good instead of a public one, the total quantity demanded at a $3
market price would be
A.
2 units.
50.
A demand curve for a public good is determined by
D.
multiplying the per-unit cost of the public good by the quantity made available.

4-24
Copyright © 2018 McGraw-Hill Education. All rights reserved. No reproduction or distribution without the prior
written consent of McGraw-Hill Education.
firms cannot normally produce public goods.
Test Bank: I
Topi c:
Public Goods
51.
Suppose that Mick and Cher are the only two members of society and are willing to pay $10
and $8, respectively, for the third unit of a public good. Also, assume that the marginal cost of
the third unit is $17. We can conclude that
A.
the third unit should not be produced.
52.
Alex, Kara, and Susie are the only three people in a community. Alex is willing to pay $20
for the fifth unit of a public good; Kara, $15; and Susie, $25. Government should produce the
fifth unit of the public good if the marginal cost is less than or equal to
A. $25.
for the third unit of a public good; Kara is willing to pay $25. If the marginal cost of producing
the third unit is $100, what is the minimum amount that Susie must be willing to
pay for it to
be efficient for government to produce the third unit?

4-25
Copyright © 2018 McGraw-Hill Education. All rights reserved. No reproduction or distribution without the prior
written consent of McGraw-Hill Education.
A. $35
B. $100
C. $65
D. The amount cannot be determined with the information provided.
54.
For which one of the following goods would we need to sum individual demand curves
vertically to obtain the total demand curve?
A.
frozen yogurt
55.
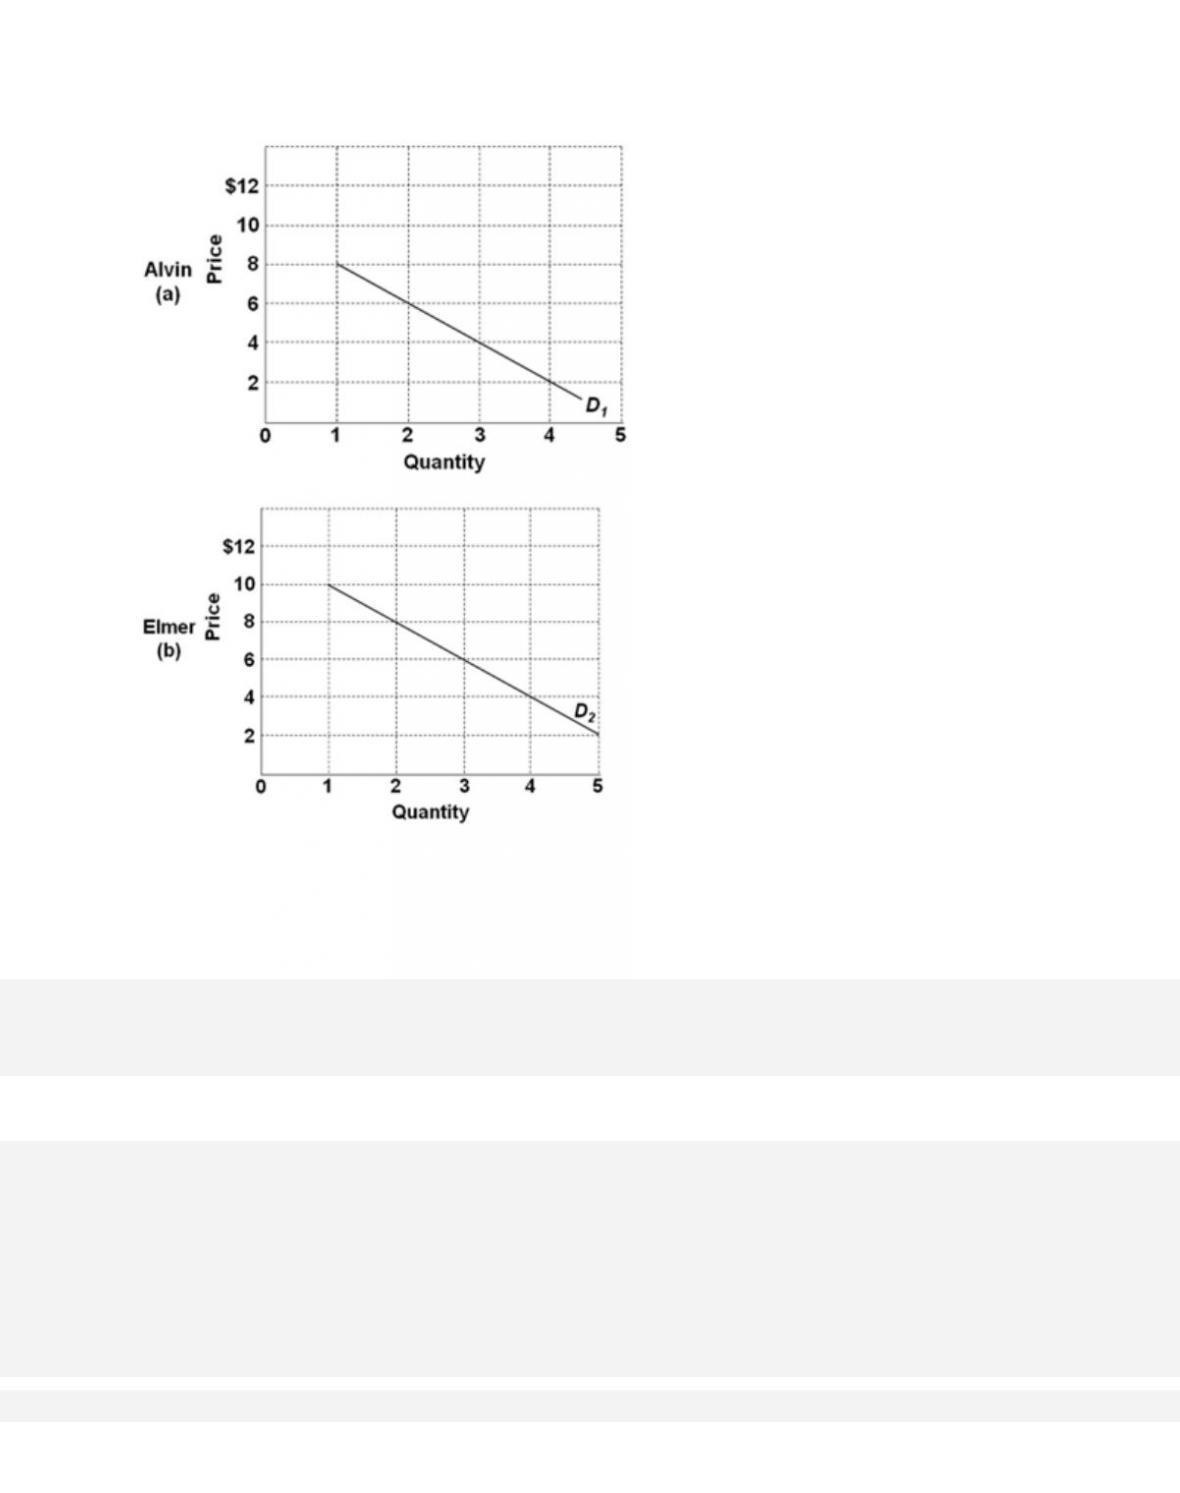
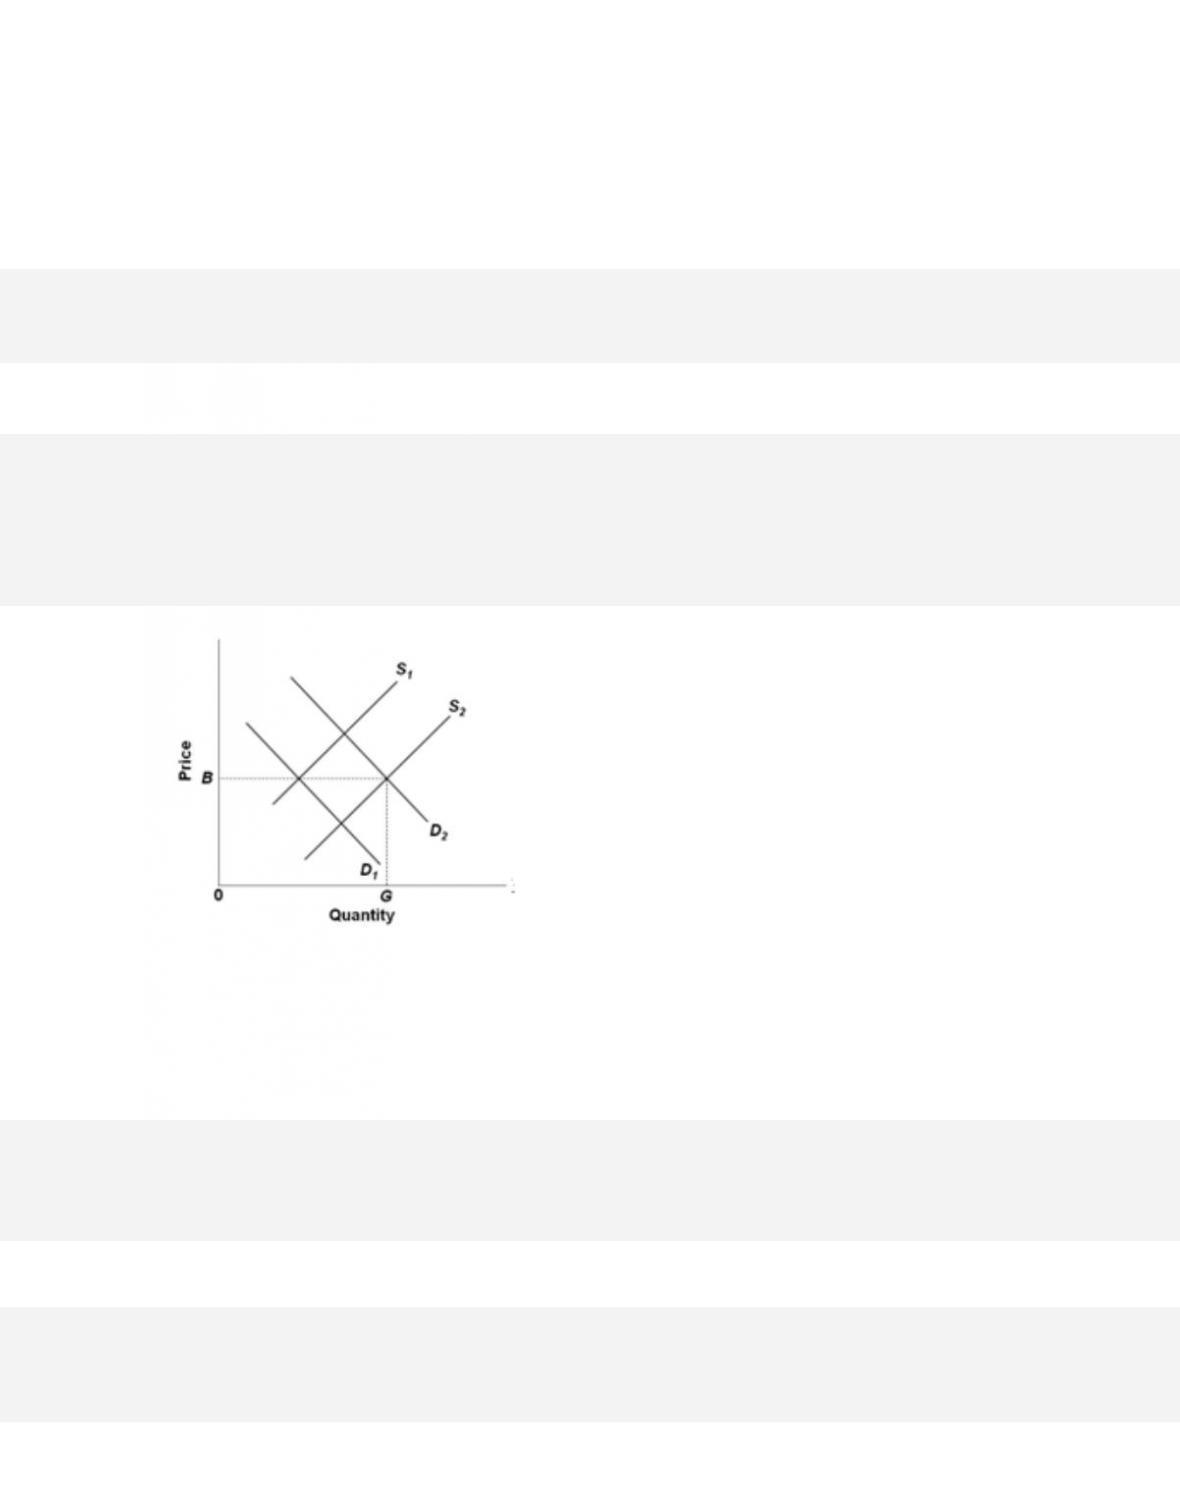
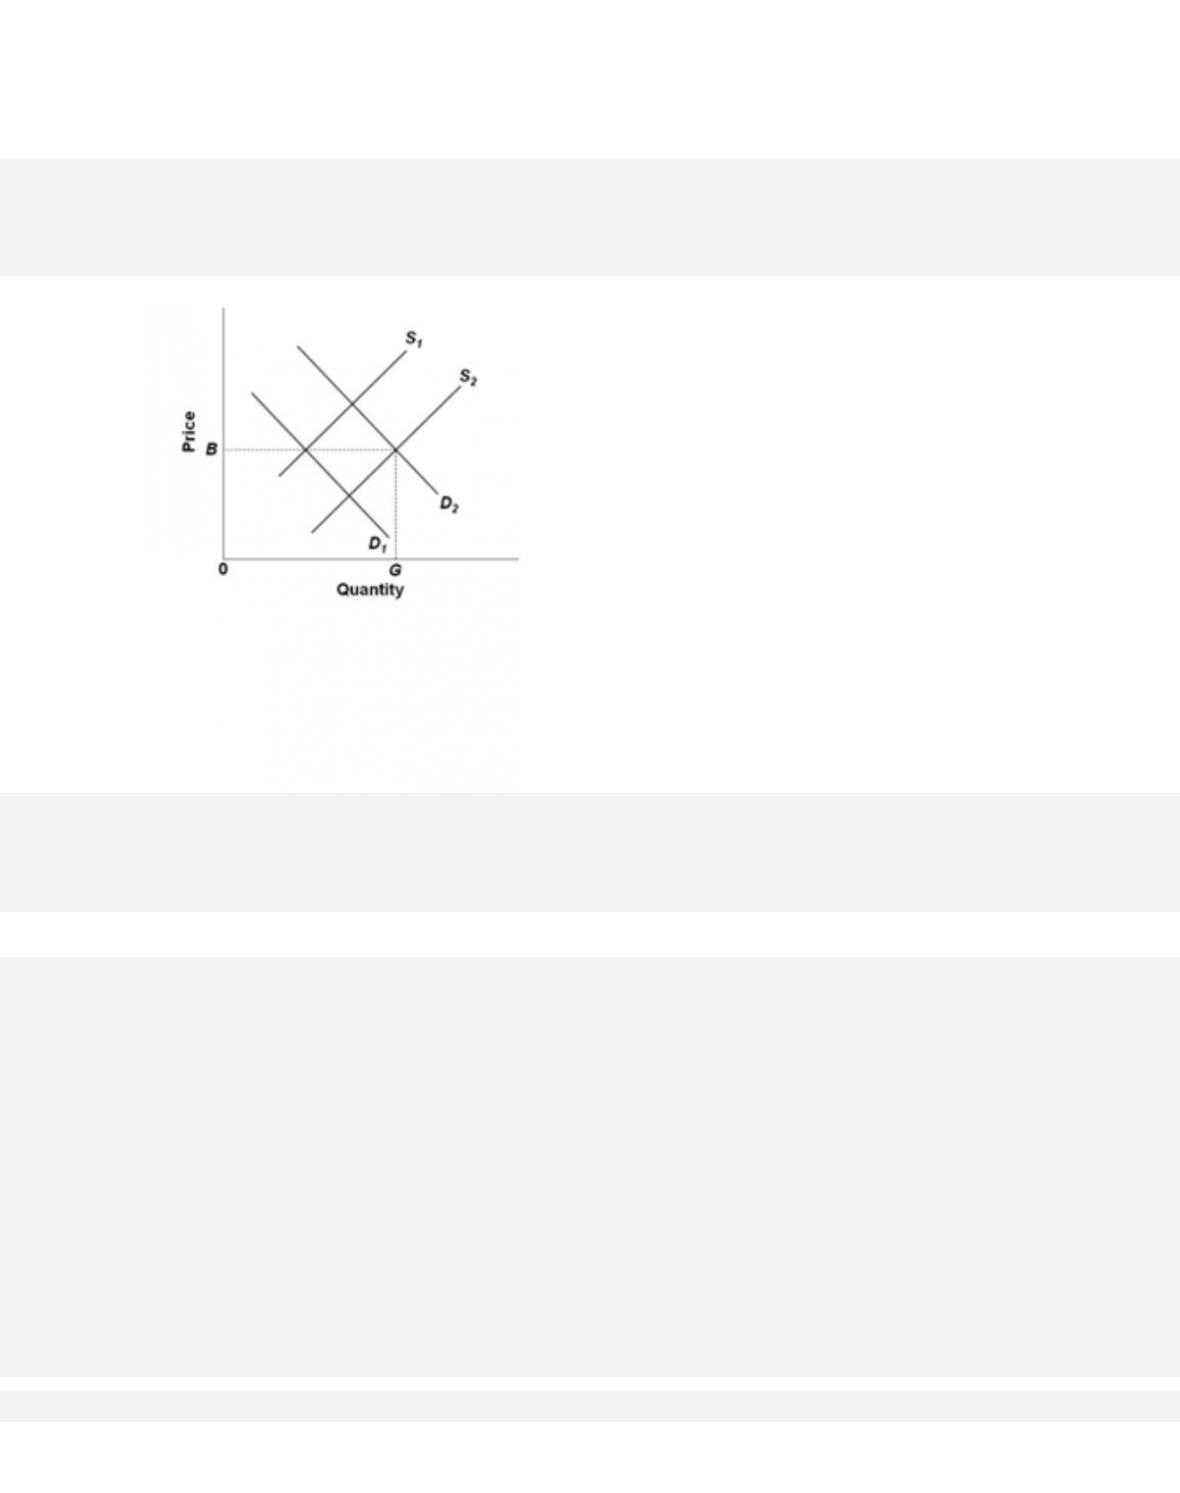
Refer to the diagrams, in which figures (a) and (b) show demand curves reflecting the prices
Alvin and Elmer are willing to pay for a public good, rather than do without it. The collective
willingness to pay for the first unit of this public good is
D. $6.
4-27
56.
Refer to the diagrams, in which figures (a) and (b) show demand curves reflecting the prices
Alvin and Elmer are willing to pay for a public good, rather than do without it. If the marginal
cost of the optimal quantity of this public good is $10, the optimal quantity must
be
A.
1 unit.
57.
Cost-benefit analysis attempts to
A.
compare the real worth, rather than the market values, of various goods and services.

4-28
Copyright © 2018 McGraw-Hill Education. All rights reserved. No reproduction or distribution without the prior
written consent of McGraw-Hill Education.
D. compare the benefits and costs associated with any economic project or activity.
58. The following data are for a series of increasingly extensive flood-control projects.
Total Cost Per
Year
Total Benefit Per
Year
Plan
A = Levees
$10,000
$16,000
Plan
B = Small
Reservoir
24,000
36,000
Plan
C = Medium
Reservoir
44,000
52,000
Plan
D = Large
Reservoir
72,000
64,000
For Plan D marginal costs and marginal benefits are
A. $72,000 and $64,000, respectively.
59. The following data are for a series of increasingly extensive flood-control projects.
Total Cost Per
Year
Total Benefit Per
Year

4-29
Plan
A = Levees
$10,000
$16,000
Plan
B = Small
Reservoir
24,000
36,000
Plan
C = Medium
Reservoir
44,000
52,000
Plan
D = Large
Reservoir
72,000
64,000
On the basis of cost-benefit analysis, government should undertake
A.
Plan D.
60. The following data are for a series of increasingly extensive flood-control projects.
Total Cost Per
Year
Total Benefit Per
Year
Plan
A = Levees
$10,000
$16,000
Plan
B = Small
Reservoir
24,000
36,000
Plan
C = Medium
Reservoir
44,000
52,000
Plan
D = Large
Reservoir
72,000
64,000
Plan C entails

4-30
D. an underallocation of resources to flood control.
61. Answer the question on the basis of the following information for four highway programs of
increasing scope. All figures are in millions of dollars.
Program
Total Cost
Total Benefit
A
$2
$9
B
6
16
C
12
21
D
20
23
The data indicate that
62. Answer the question on the basis of the following information for four highway programs of
increasing scope. All figures are in millions of dollars.
Program
Total Cost
Total Benefit
A
$2
$9
B
6
16
C
12
21

D
20
23
On the basis of the data, we can say that
63.
According to the marginal-cost–marginal-benefit rule,
64.
Economists consider governments to be “wasteful”

4-32
Copyright © 2018 McGraw-Hill Education. All rights reserved. No reproduction or distribution without the prior
written consent of McGraw-Hill Education.
A c c e ss ib i l i ty :
Keyboard Navigation
Blooms: Understand
D i f fi c ul t y:
02 Medium
Learning Objective: 04–03 Describe free riding and public goods, and illustrate why private
firms cannot normally produce public goods.
Test Bank: I
Topic:
Cost-Benefit Analysis
65.
A positive externality or spillover benefit occurs when
66.
A negative externality or spillover cost occurs when
4-33
67.
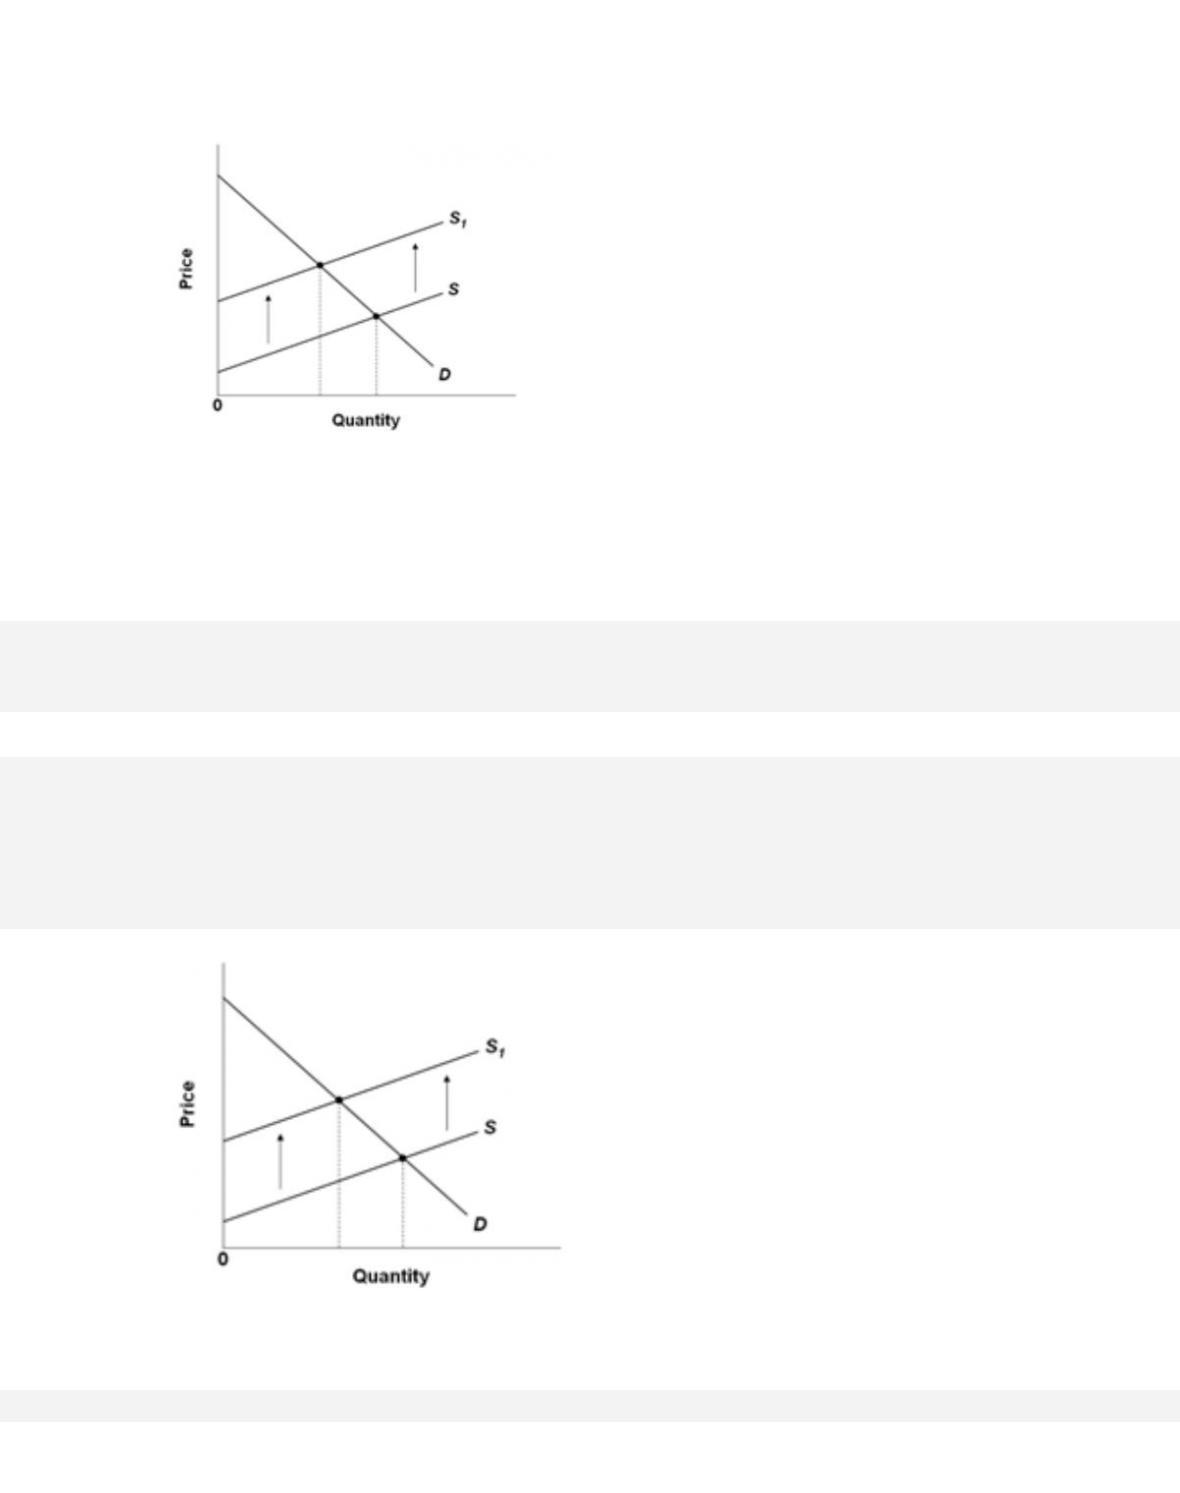
Refer to the diagram, in which S is the market supply curve and S1 is a supply curve comprising
all costs of production, including external costs. Assume that the number of people affected by
these external costs is large. Without government interference, this market
will reach
68.
Refer to the diagram, in which S is the market supply curve and S1 is a supply curve comprising
all costs of production, including external costs. Assume that the number of people affected by
these external costs is large. If the government wishes to establish an optimal
allocation of
resources in this market, it should
69.
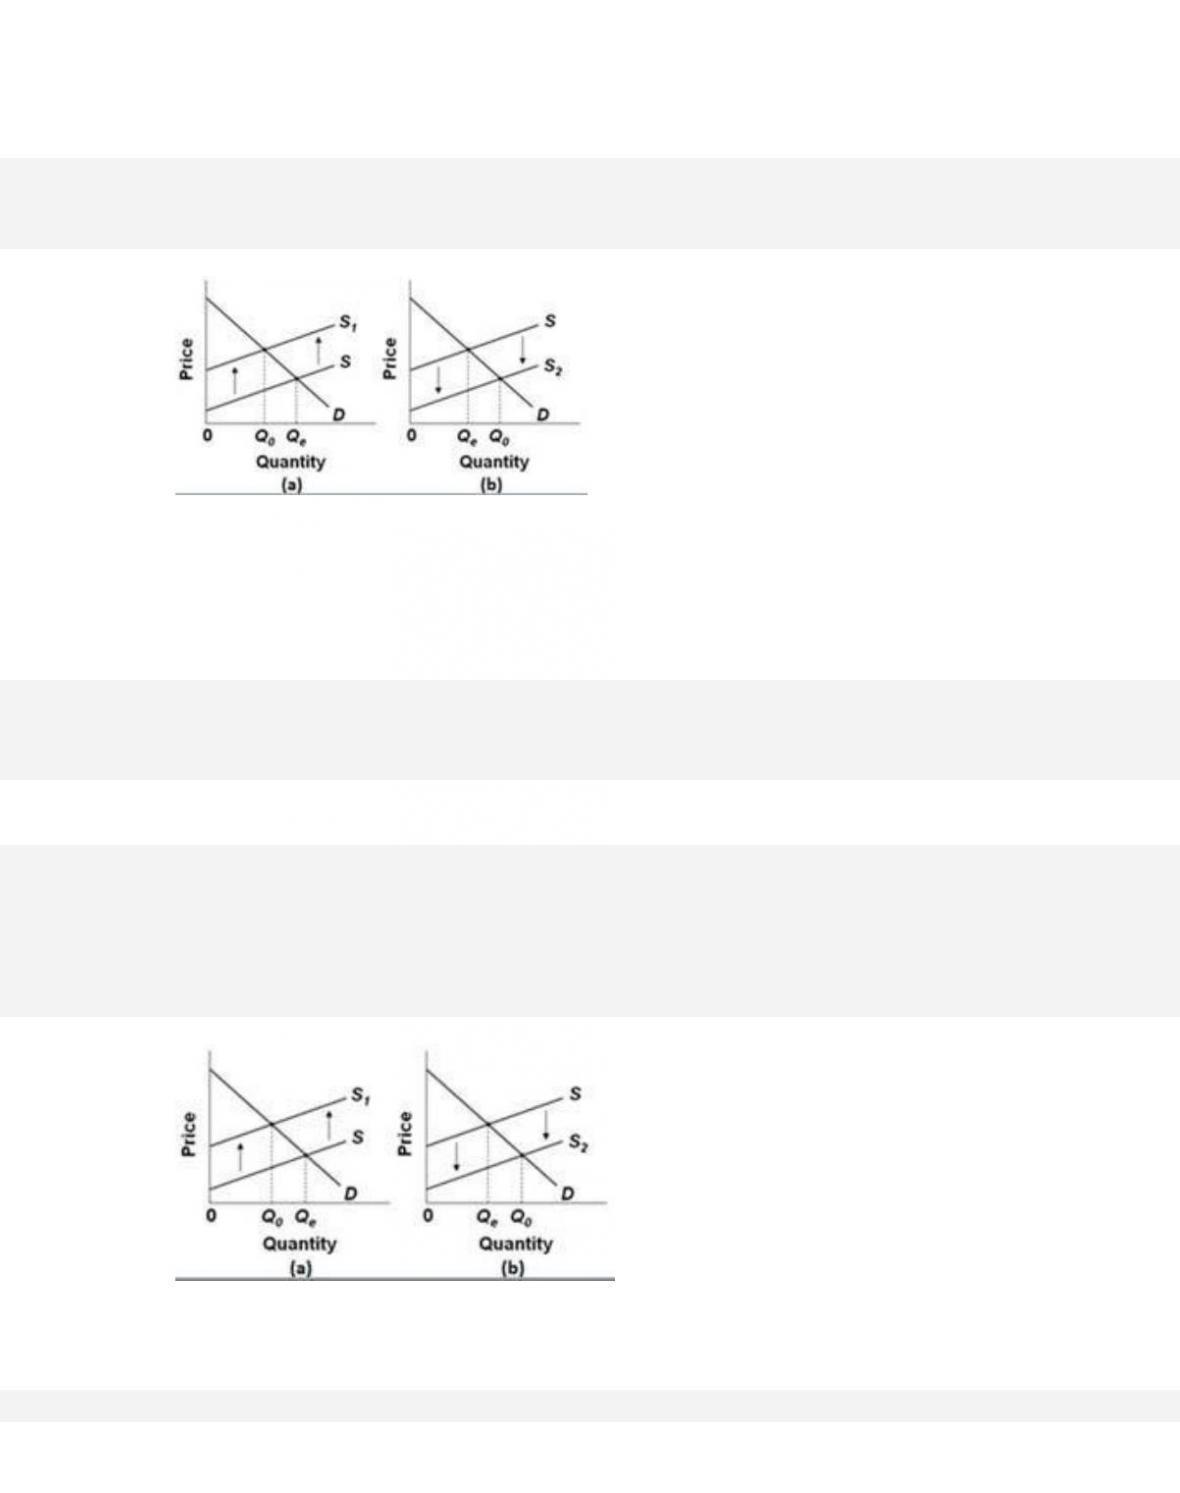
Refer to the diagrams for two separate product markets. Assume that society’s optimal level of
output in each market is Q0 and that government purposely shifts the market supply curve from
S to S1 in diagram (a) on the left and from S to S2 in diagram (b) on the right.
We can
conclude that the government is correcting for
D.
positive externalities in both diagrams.
4-35
Copyright © 2018 McGraw-Hill Education. All rights reserved. No reproduction or distribution without the prior
written consent of McGraw-Hill Education.
Learning Objective: 04–04 Explain how positive and negative externalities cause under- and
overallocations of resources.
Test Bank: I
Topi c:
Externalities
70.
Refer to the diagrams for two separate product markets. Assume that society’s optimal level of
output in each market is Q0 and that government purposely shifts the market supply curve from
S to S1 in diagram (a) on the left and from S to S2 in diagram (b) on the right.
The shift of the
supply curve from S to S1 in diagram (a) might be caused by a per-unit
D.
tax on the buyers of this product.
71.
Refer to the diagrams for two separate product markets. Assume that society’s optimal level of
output in each market is Q0 and that government purposely shifts the market supply curve from
S to S1 in diagram (a) on the left and from S to S2 in diagram (b) on the right.
The shift of the
supply curve from S to S2 in diagram (b) might be caused by a per-unit
D.
tax on the buyers of this product.
72.
Refer to the competitive market diagram for product Z. Assume that the current market demand
and supply curves for Z are D1 and S1. If there are substantial external benefits associated with
the production of Z, then
D.
consumers are paying too much for the good.
4-37
Copyright © 2018 McGraw-Hill Education. All rights reserved. No reproduction or distribution without the prior
written consent of McGraw-Hill Education.
Di f fi cu l ty :
02 Medium
Learning Objective: 04–04 Explain how positive and negative externalities cause under- and
overallocations of resources.
Test Bank: I
Topi c:
Externalities
73.
Refer to the competitive market diagram for product Z. Assume that the current market demand
and supply curves for Z are D2 and S2. If there are substantial external benefits associated with
the production of Z, then
4-38
74.
Refer to the competitive market diagram for product Z. Assume that the current market demand
and supply curves for Z are D2 and S2. If there are substantial external costs associated with the
production of Z, then
75.
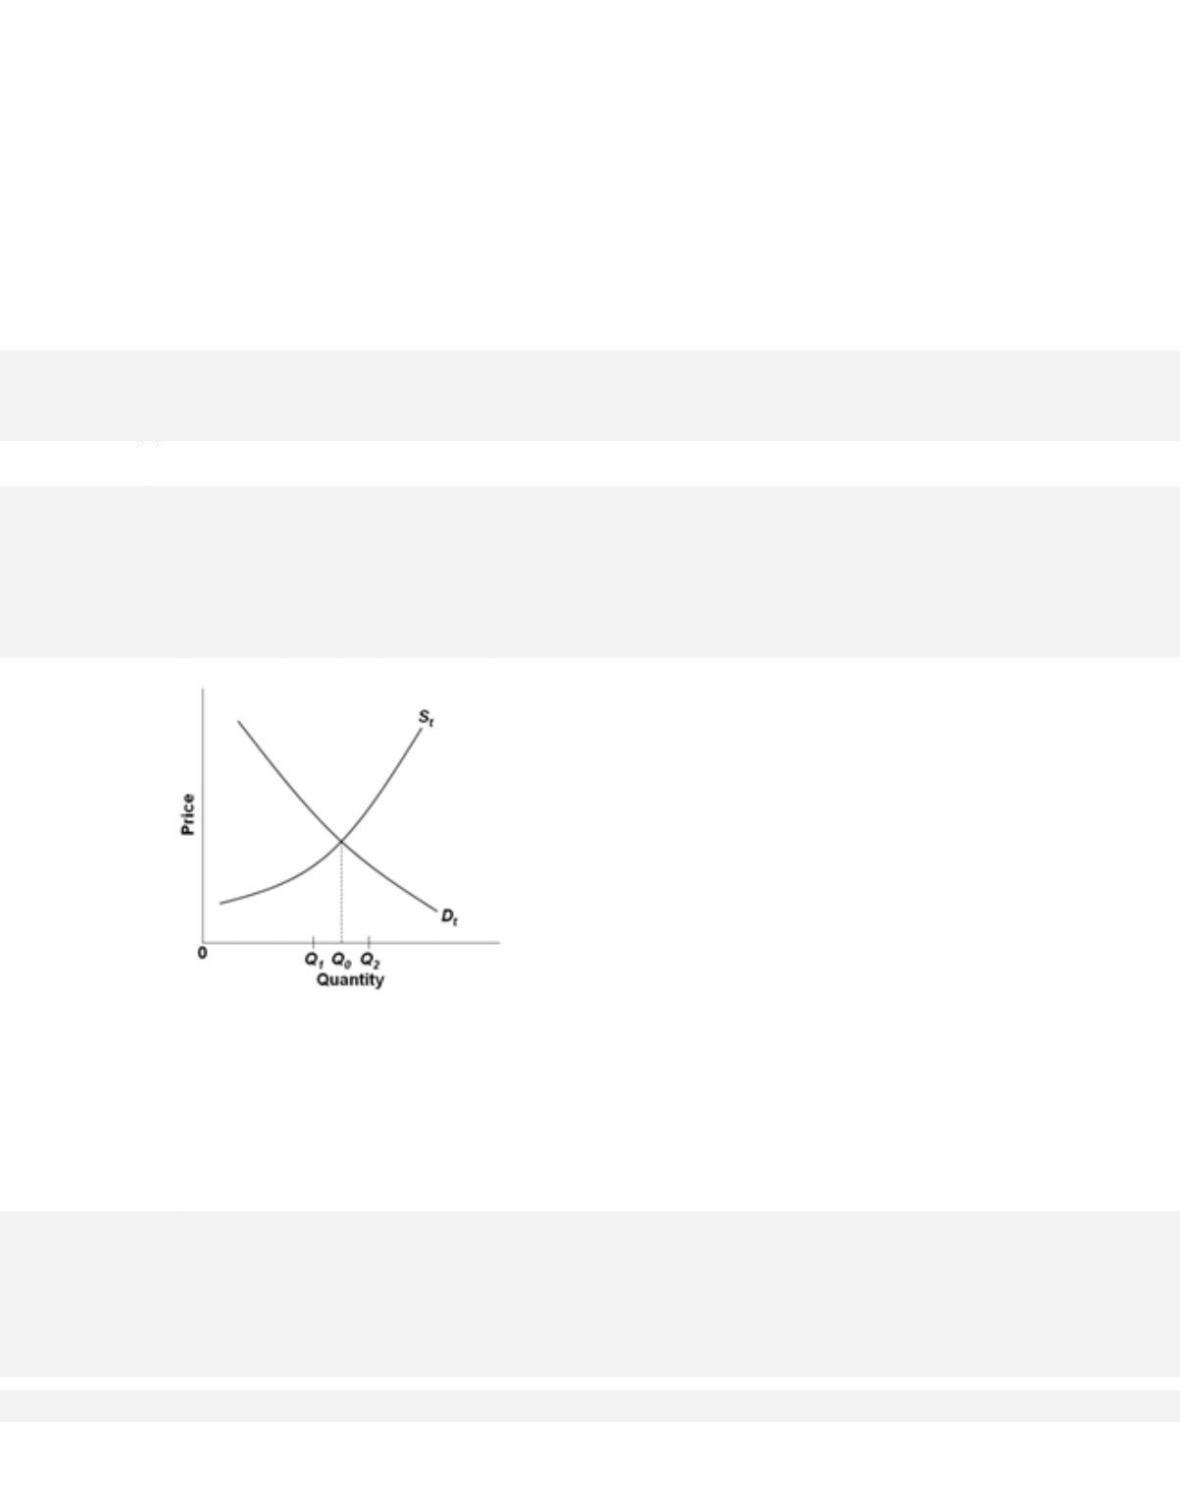
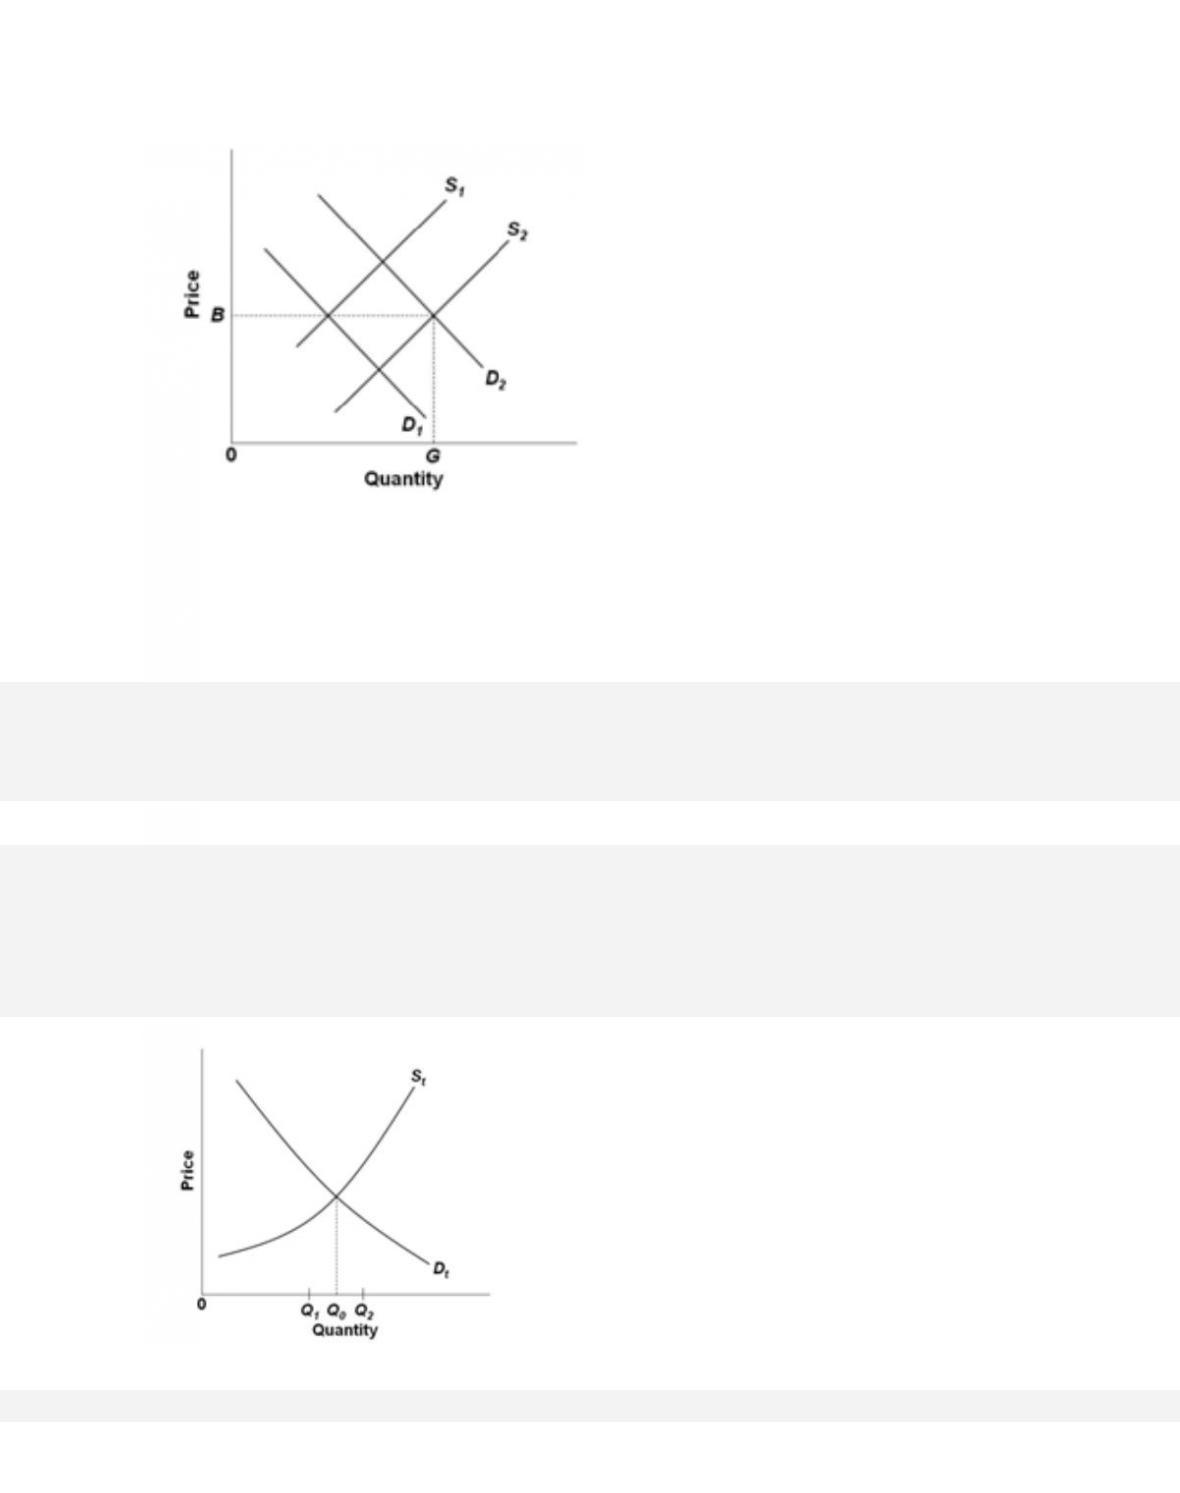
Refer to the diagram of the market for product X. Curve St embodies all costs (including
externalities), and Dt embodies all benefits (including externalities) associated with the
production and consumption of X. Assuming the market equilibrium output is Q1, we can
conclude that the existence of external
76.
Refer to the diagram of the market for product X. Curve St embodies all costs (including
externalities), and Dt embodies all benefits (including externalities) associated with the
production and consumption of X. Assuming the equilibrium output is Q2, we can conclude
that the existence of external

4-40
Copyright © 2018 McGraw-Hill Education. All rights reserved. No reproduction or distribution without the prior
written consent of McGraw-Hill Education.
AACSB: Knowledge Application
Blooms: Understand
Di ff i cu lt y:
02 Medium
Learning Objective: 04–04 Explain how positive and negative externalities cause under- and
overallocations of resources.
Test Bank: I
Topic:
Externalities
77.
If a good that generates positive externalities was produced and priced to take into account
these spillover benefits, then its
78.
Pigovian taxes
79.
Suppose that the Anytown city government asks private citizens to donate money to support
the town‘s annual holiday lighting display. Assuming that the citizens of Anytown enjoy the
lighting display, the request for donations suggests that