
3-161
prices and quantities.
Topic:
Changes in Supply, Demand, and Equilibrium
334. A and B are substitute goods, but A and C are complementary goods. If the cost of
producing A decreases, then the demand for
A. both B and C will decrease.
335. The price of pork may increase as a result of
A. a decrease in the cost of feed for pigs.
B. decreased advertising of pork.
336. Over a period of time, the equilibrium price of a good increases and the quantity decreases.
All of the following could account for this situation, except
A. an increase in the costs of production.

3-162
337. Which would best explain a decrease in both the price and the quantity of a product over a
period of time?
A. a decrease in people’s incomes, and the product is an inferior good
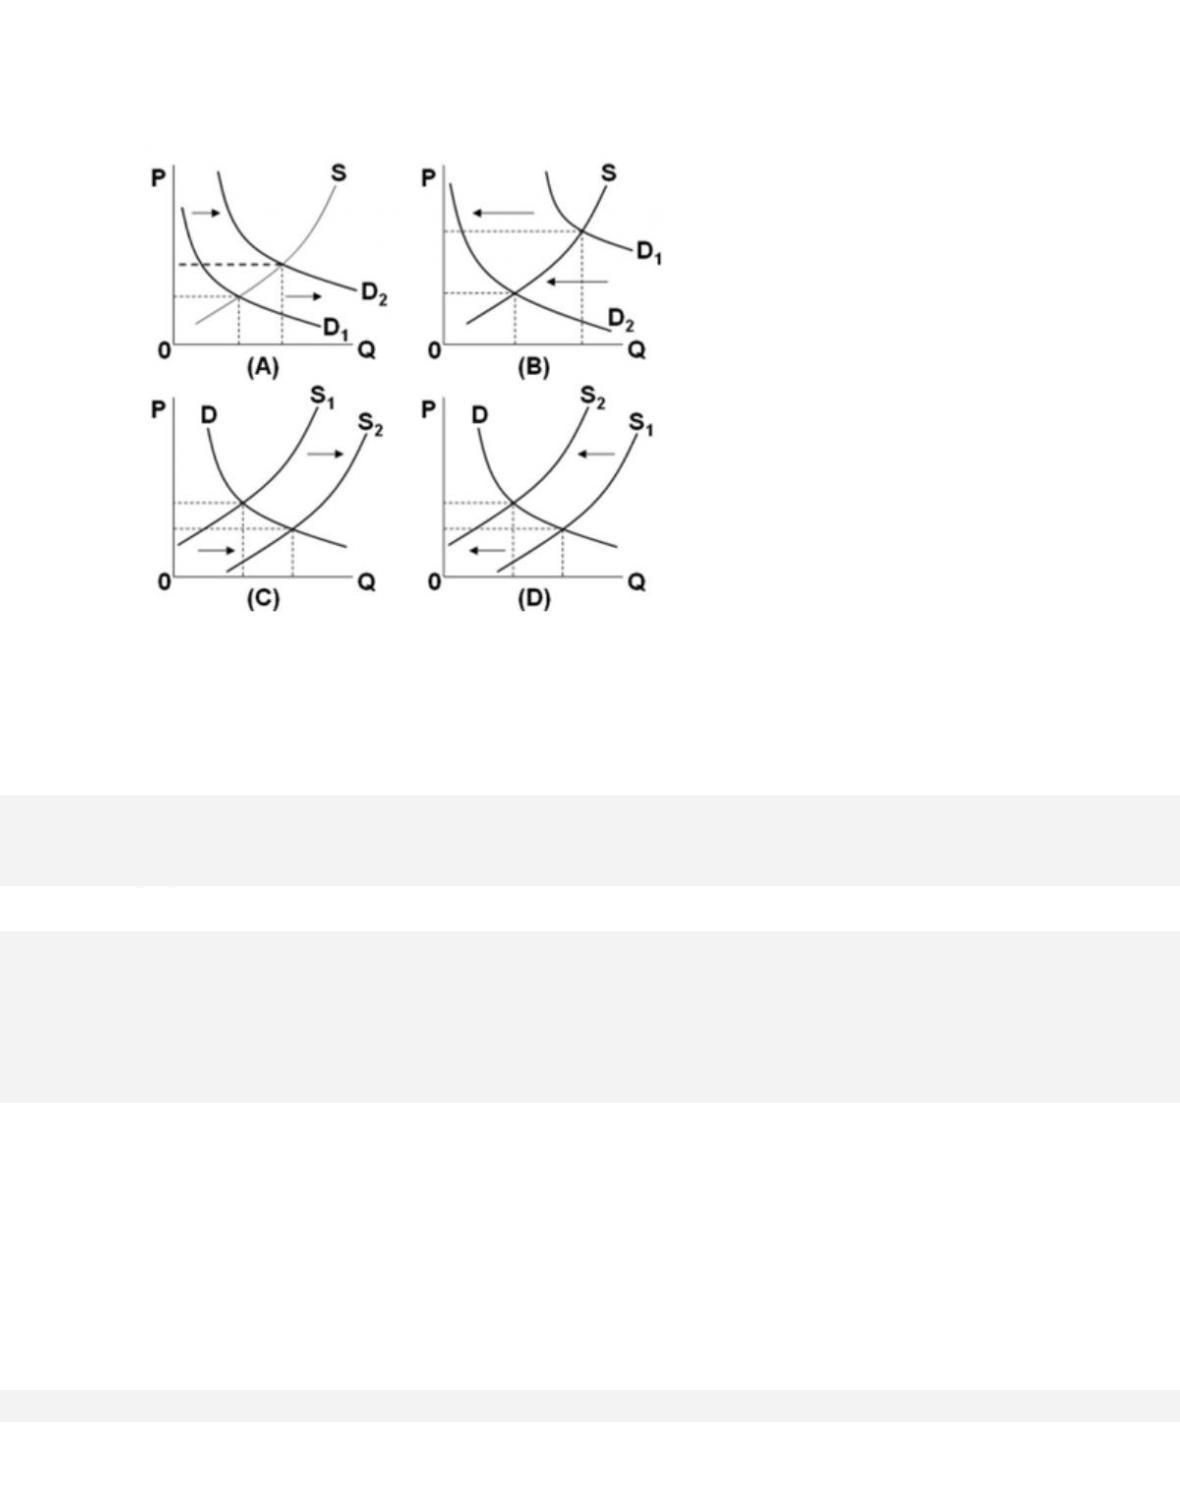
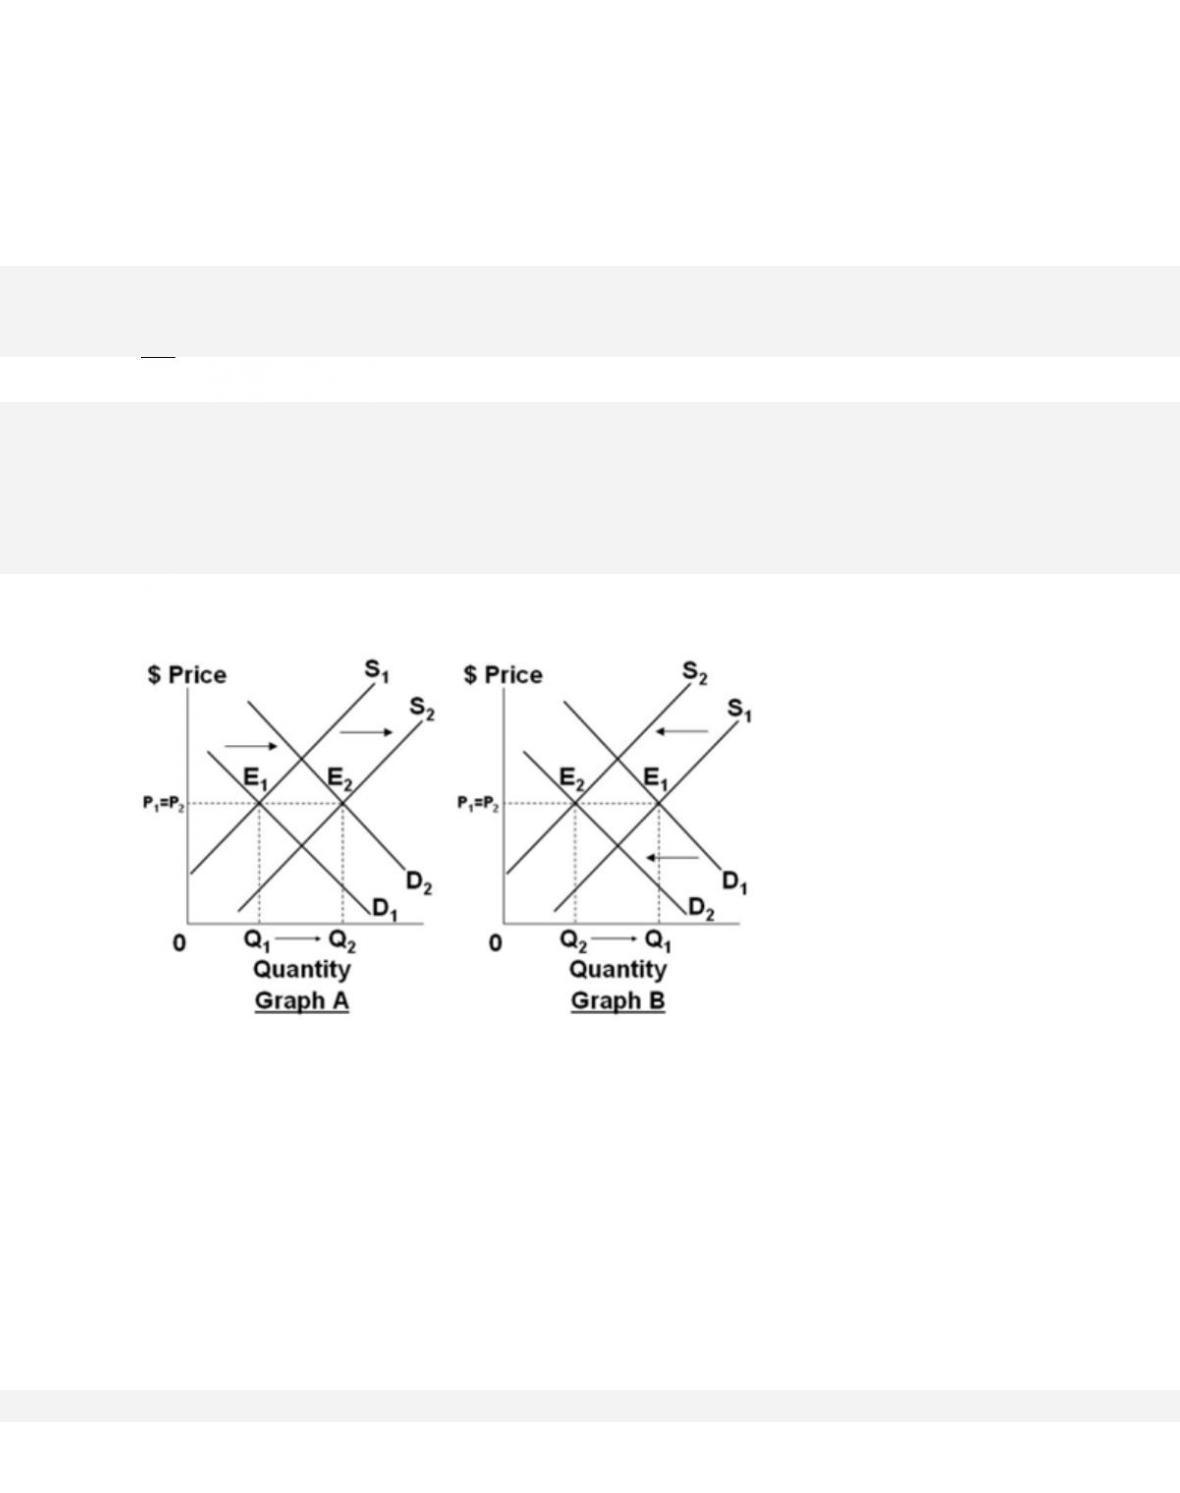
338. In the diagrams below, the subscript “1” refers to the initial position of the curve, while the
subscript “2” refers to the final position after the curve shifts.
3-163
Which diagram illustrates the effects on the peanut butter market, if severe flooding destroys a
large portion of the peanut crop in the economy?
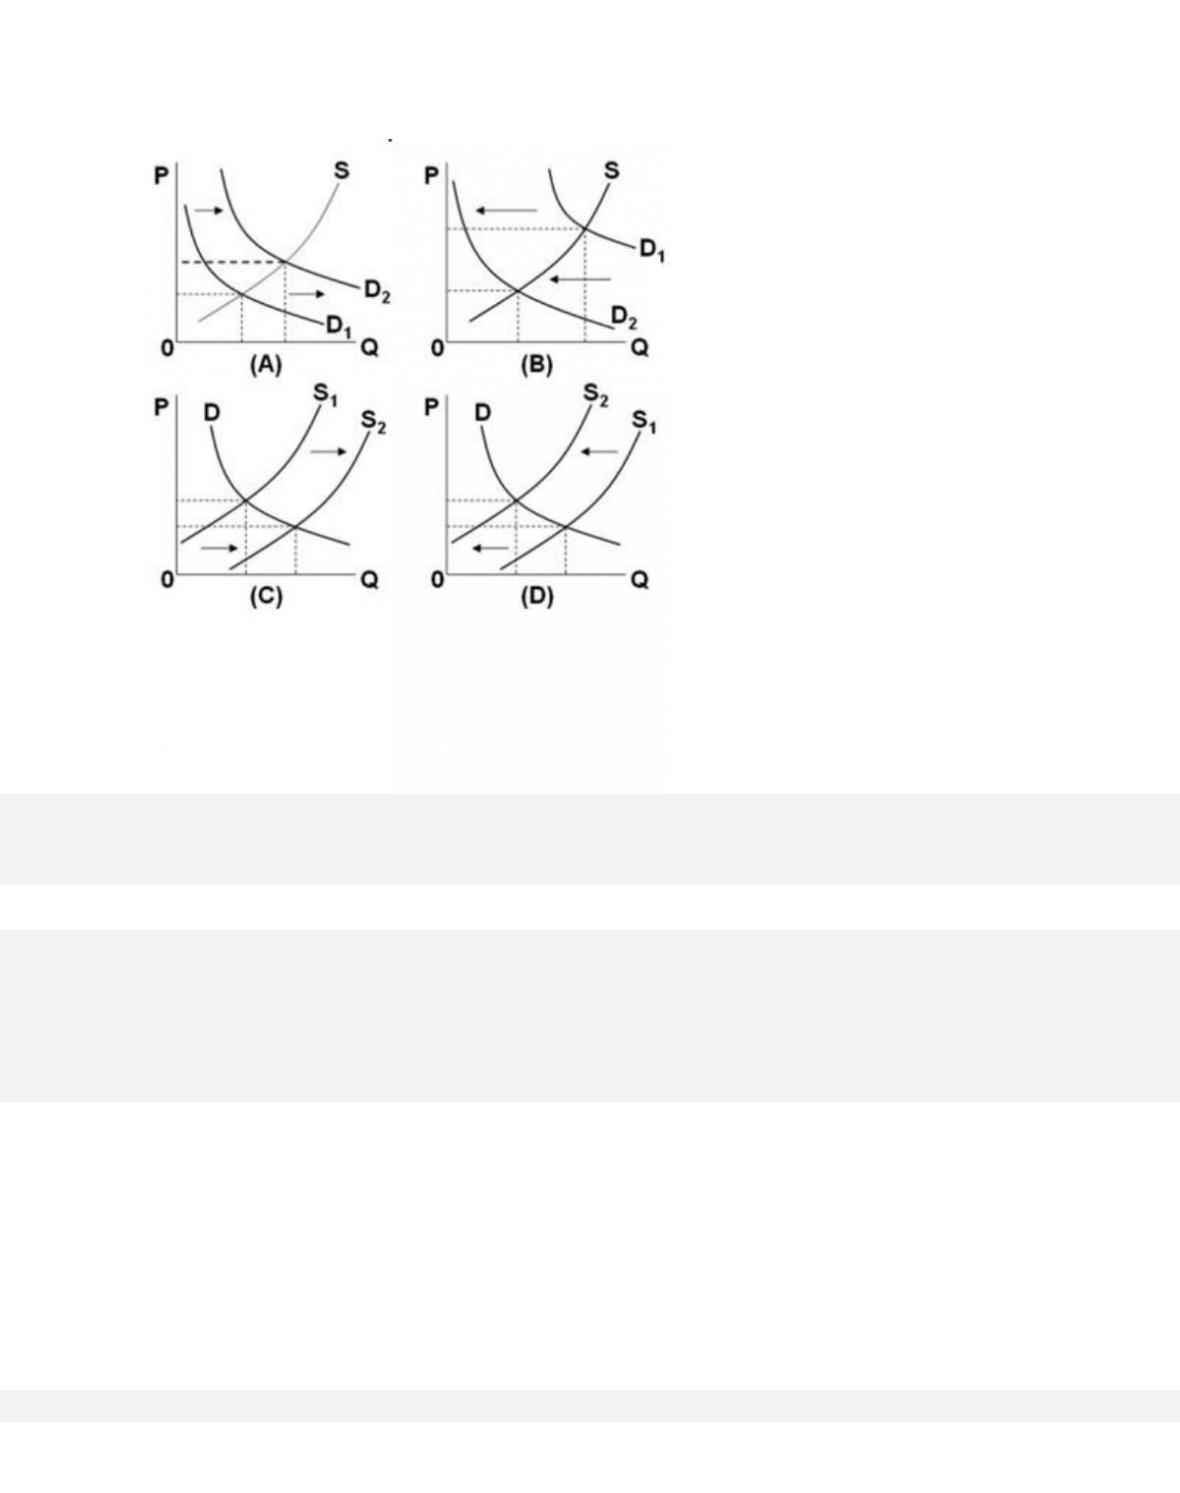
339. In the diagrams below, the subscript “1” refers to the initial position of the curve, while the
subscript “2” refers to the final position after the curve shifts.
3-164
Which diagram illustrates the effect on the natural-gas market of the widespread use of
“fracking,” or hydraulic fracturing, by gas-drilling companies?
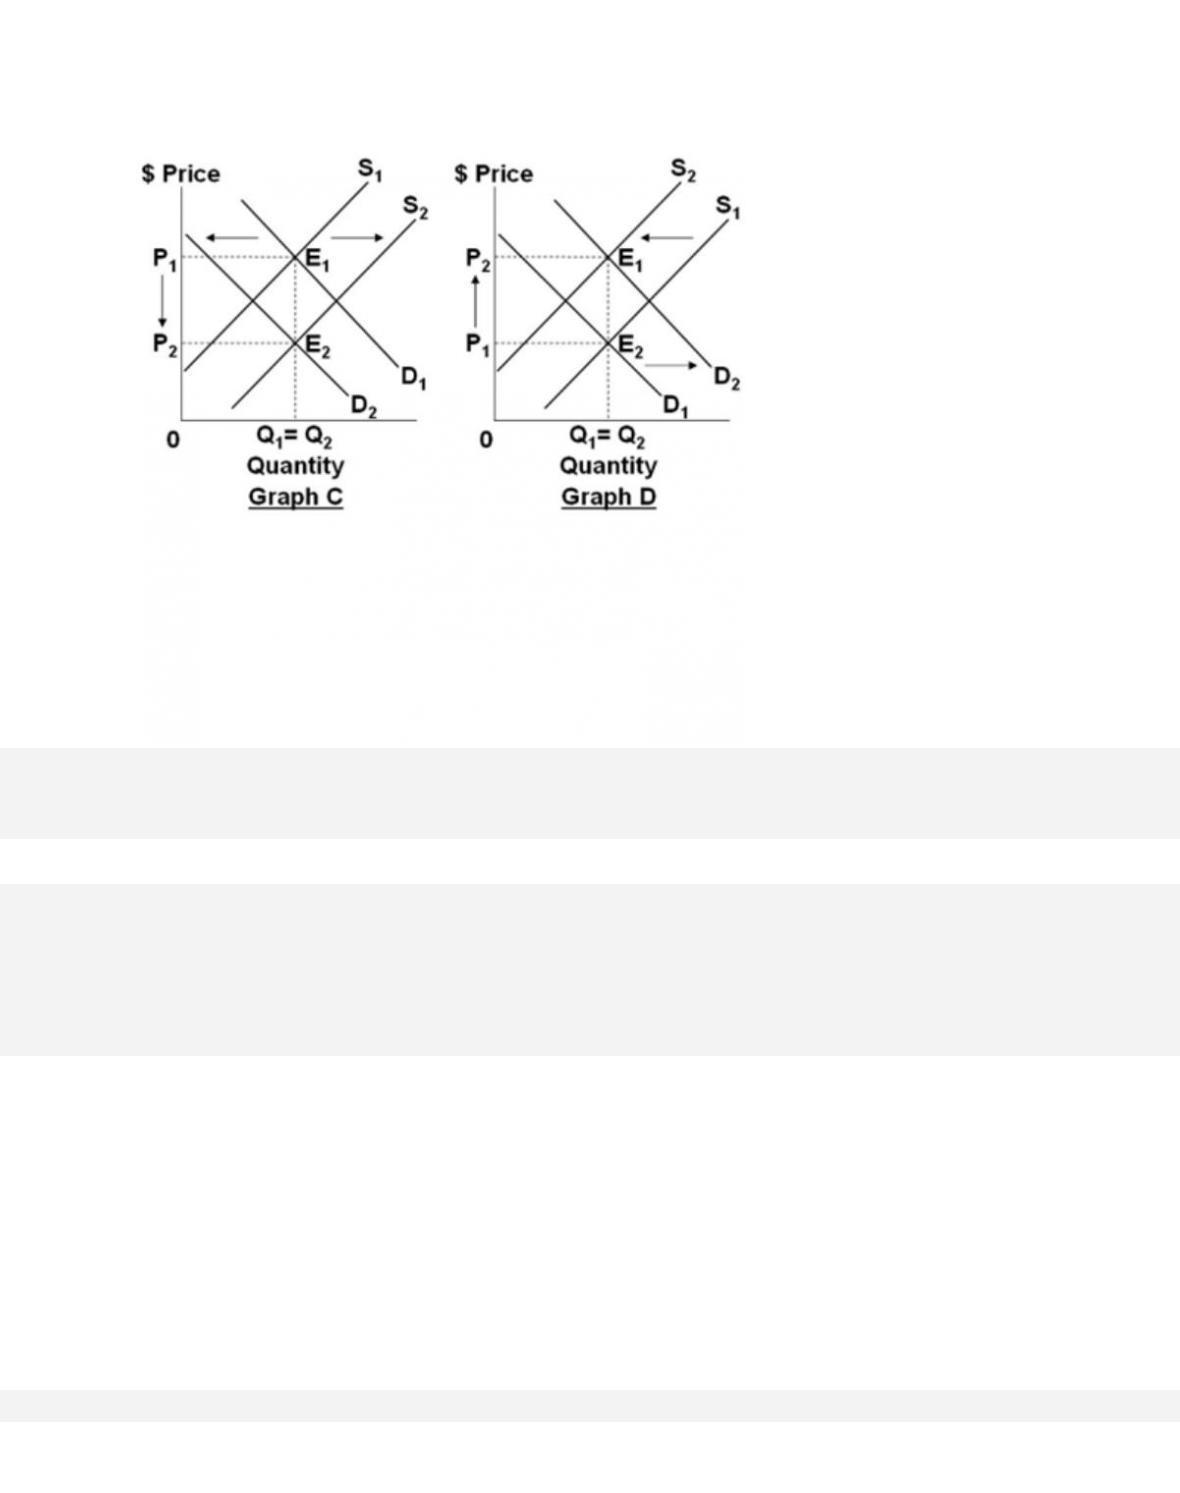
340. In the diagrams below, the subscript “1” refers to the initial position of the curve, while the
subscript “2” refers to the final position after the curve shifts.
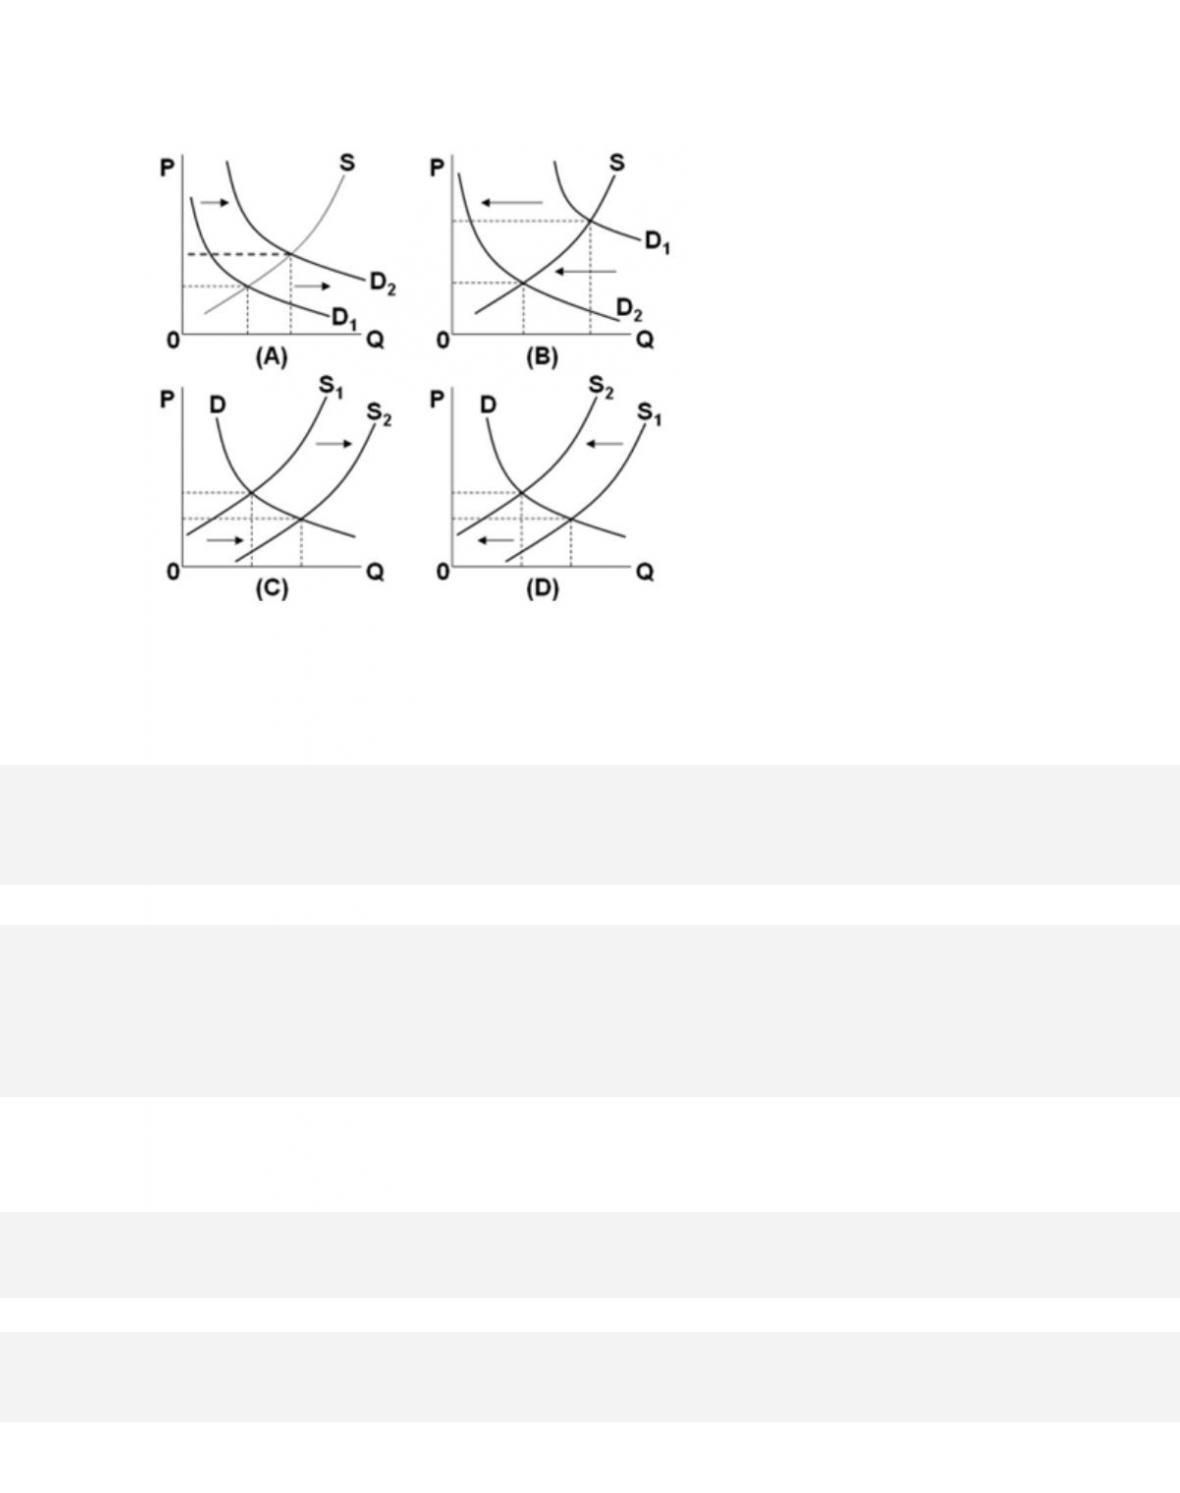
In which diagrams would we see a shortage at the initial price after the indicated curve has
shifted?
341. An increase in demand for oil along with a simultaneous increase in supply of oil will
A. decrease price and increase quantity.

3-166
Copyright © 2018 McGraw-Hill Education. All rights reserved. No reproduction or distribution without the prior
written consent of McGraw-Hill Education.
A c c e s s i b i l i t y :
Keyboard Navigation
Blooms: Understand
Difficulty:
02 Medium
Learning Objective: 03–05 Explain how changes in supply and demand affect equilibrium
prices and quantities.
Test Bank: II
Topic:
Changes in Supply, Demand, and Equilibrium
342. A decrease in demand and an increase in supply will
A. affect price in an indeterminate way and decrease the equilibrium quantity.
343. What is the likely effect on the market for wine of a simultaneous increase in both consumer
incomes and producer taxes on wine?
A. an increase in both price and quantity
344. What combination of changes would most likely decrease the equilibrium price?
A. when supply decreases and demand increases

3-167
Copyright © 2018 McGraw-Hill Education. All rights reserved. No reproduction or distribution without the prior
written consent of McGraw-Hill Education.
B. when demand increases and supply increases
C. when demand decreases and supply decreases
D. when supply increases and demand decreases
345. An increase in the demand for corn is more than offset by an increase in its supply. As a
result, the equilibrium price will
346. A large increase in the supply of HD–TV sets occurs simultaneously with a smaller
decrease in its demand. As a result, the equilibrium price will
3-168
Copyright © 2018 McGraw-Hill Education. All rights reserved. No reproduction or distribution without the prior
written consent of McGraw-Hill Education.
Test Bank: II
Topic:
Changes in Supply, Demand, and Equilibrium
347. An increase in demand coupled with a simultaneous and bigger decrease in supply will
cause equilibrium
D. price to go down and quantity to go up.
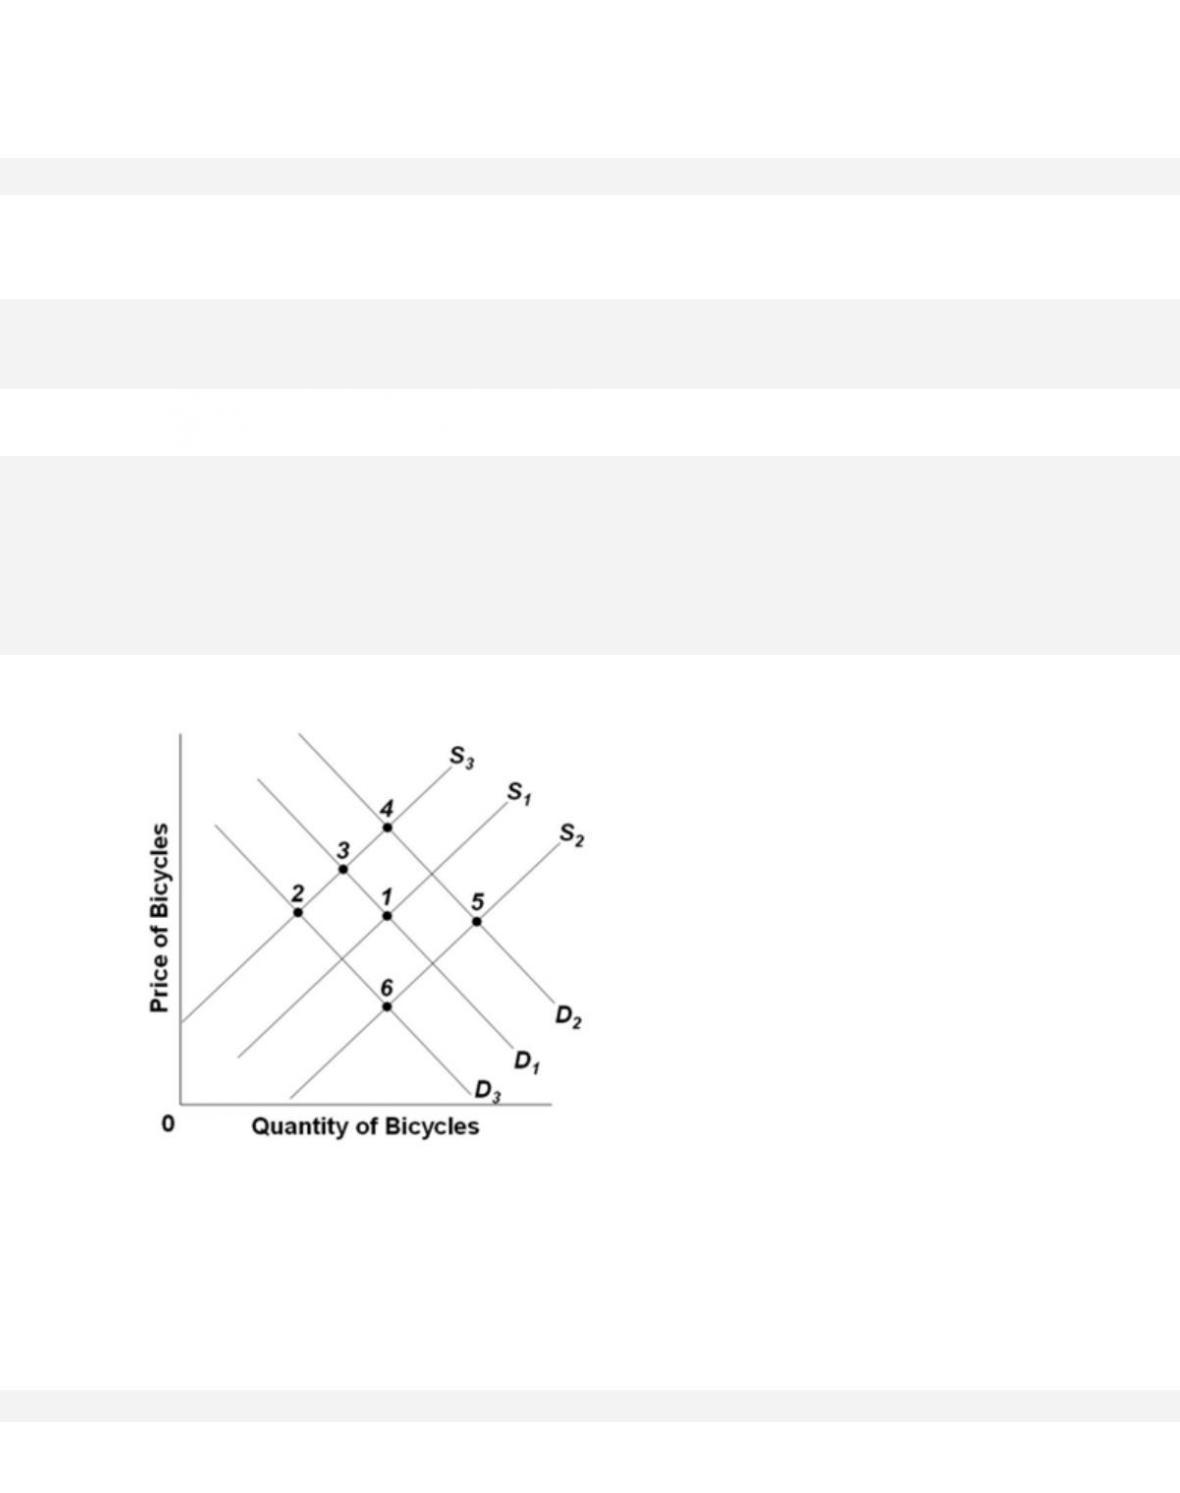
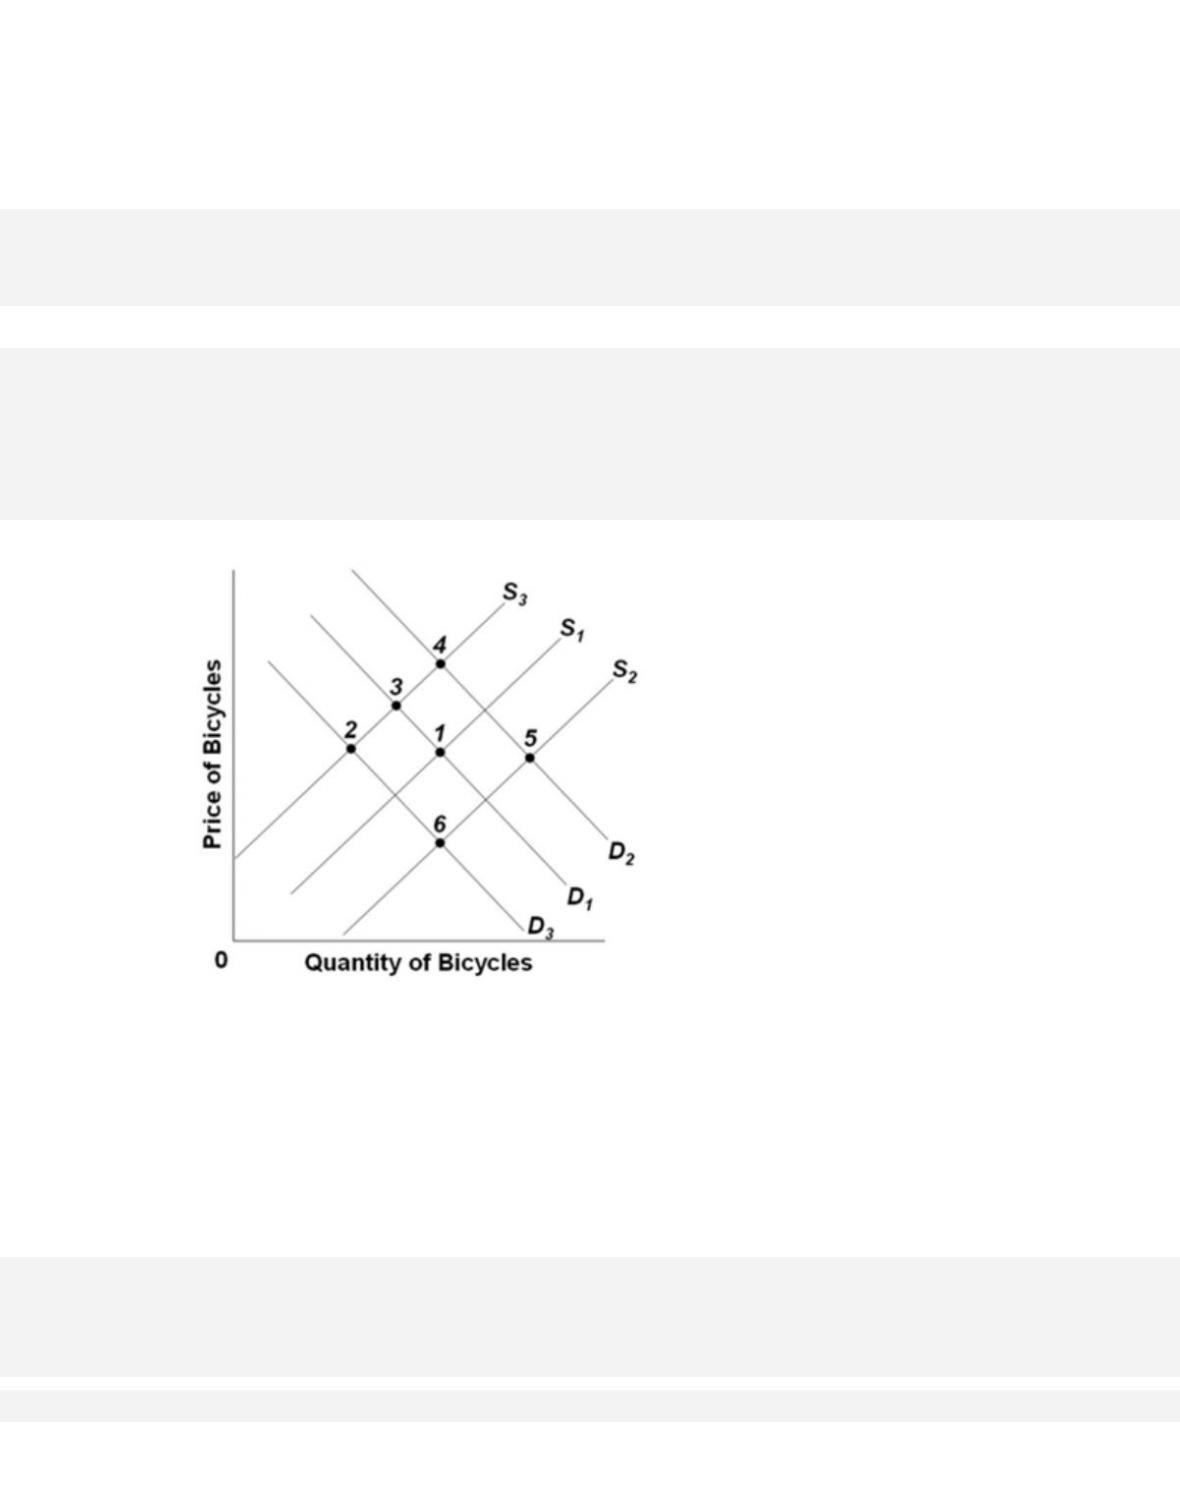
348.
Refer to the above graph, which shows the market for bicycles. S1 and D1 are the original
supply and demand curves. D2 and D3 and S2 and S3
are possible new demand and supply
curves. Starting from the initial equilibrium (point 1), which point on the graph is most likely to
be the new equilibrium after the introduction of technological improvements in bicycle
production and successful publicity campaigns by the government on the virtues of bicycling to
work?
349.
Refer to the above graph, which shows the market for bicycles. S1 and D1 are the original
supply and demand curves. D2 and D3 and S2 and S3
are possible new demand and supply
curves. Starting from the initial equilibrium (point 1), which point on the graph is most likely to
be the new equilibrium after an increase in wages of bicycle workers, and a significant increase
in the price of gasoline?
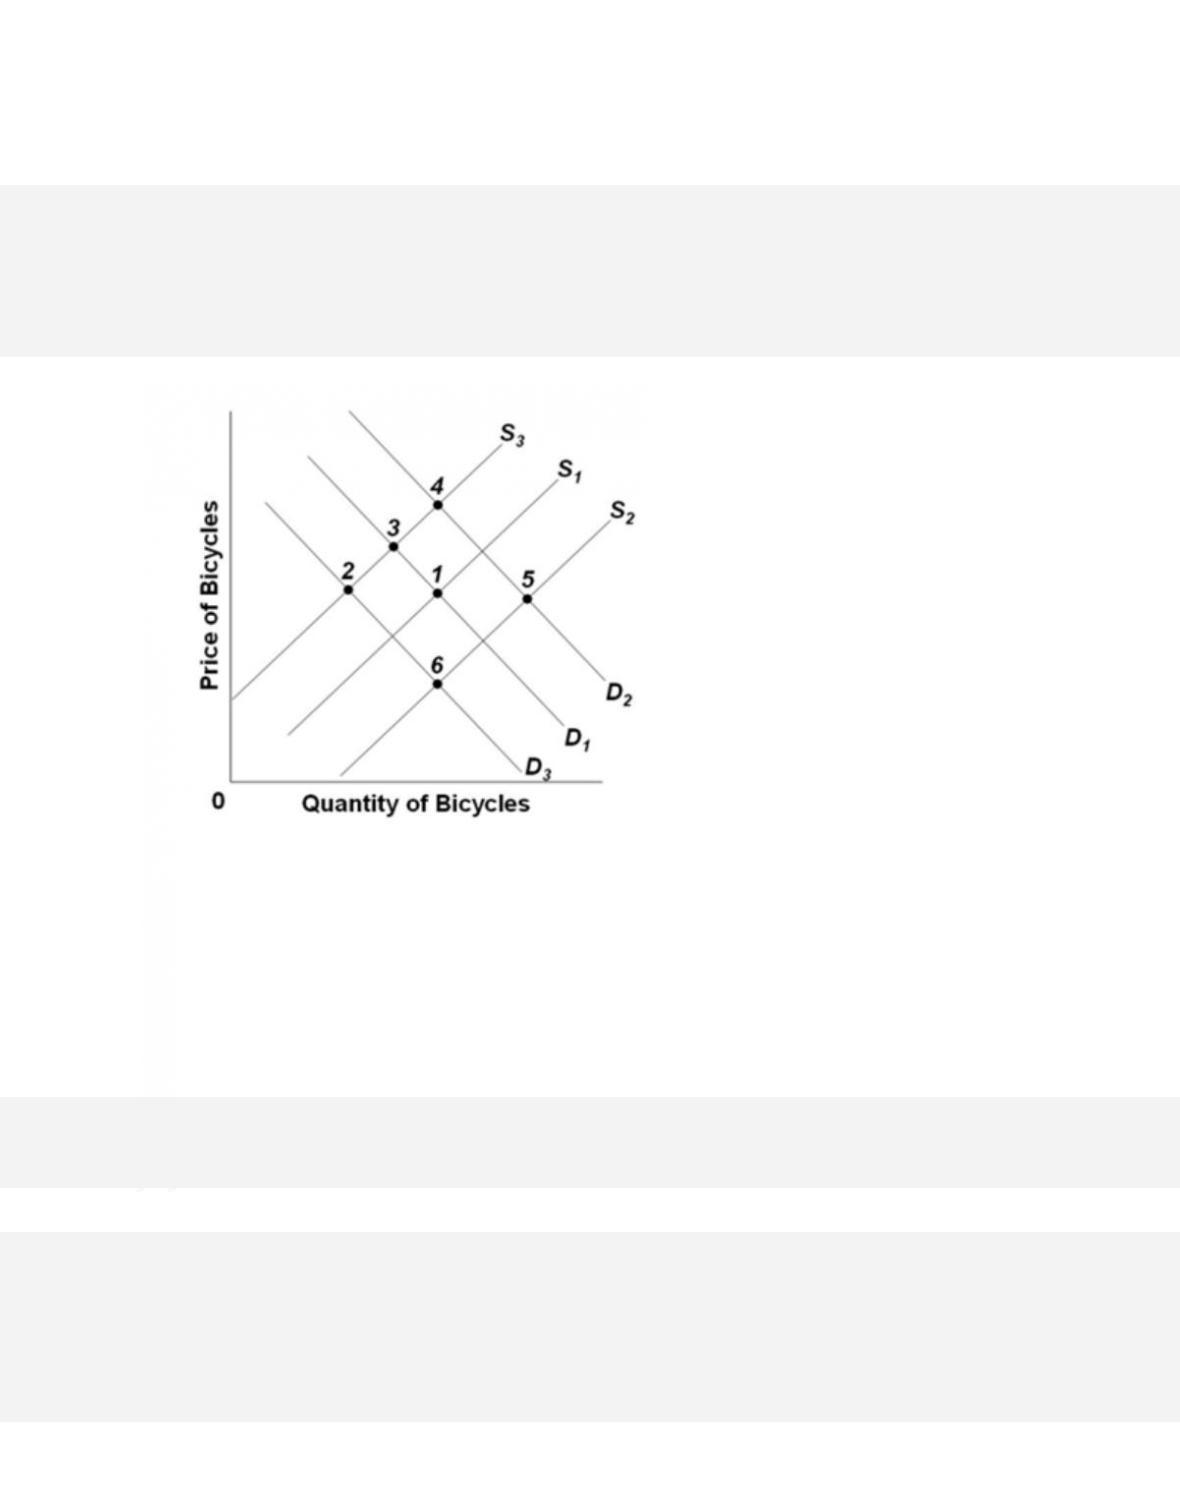
350.
Refer to the above graph, which shows the market for bicycles. S1 and D1 are the original
supply and demand curves. D2 and D3 and S2 and S3
are possible new demand and supply
curves. Starting from the initial equilibrium (point 1), what point on the graph is most likely to
be the new equilibrium after a sharp increase in traffic accidents involving cyclists and the
payment of subsidies to bicycle producers?
3-171
Copyright © 2018 McGraw-Hill Education. All rights reserved. No reproduction or distribution without the prior
written consent of McGraw-Hill Education.
Test Bank: II
Topic:
Changes in Supply, Demand, and Equilibrium
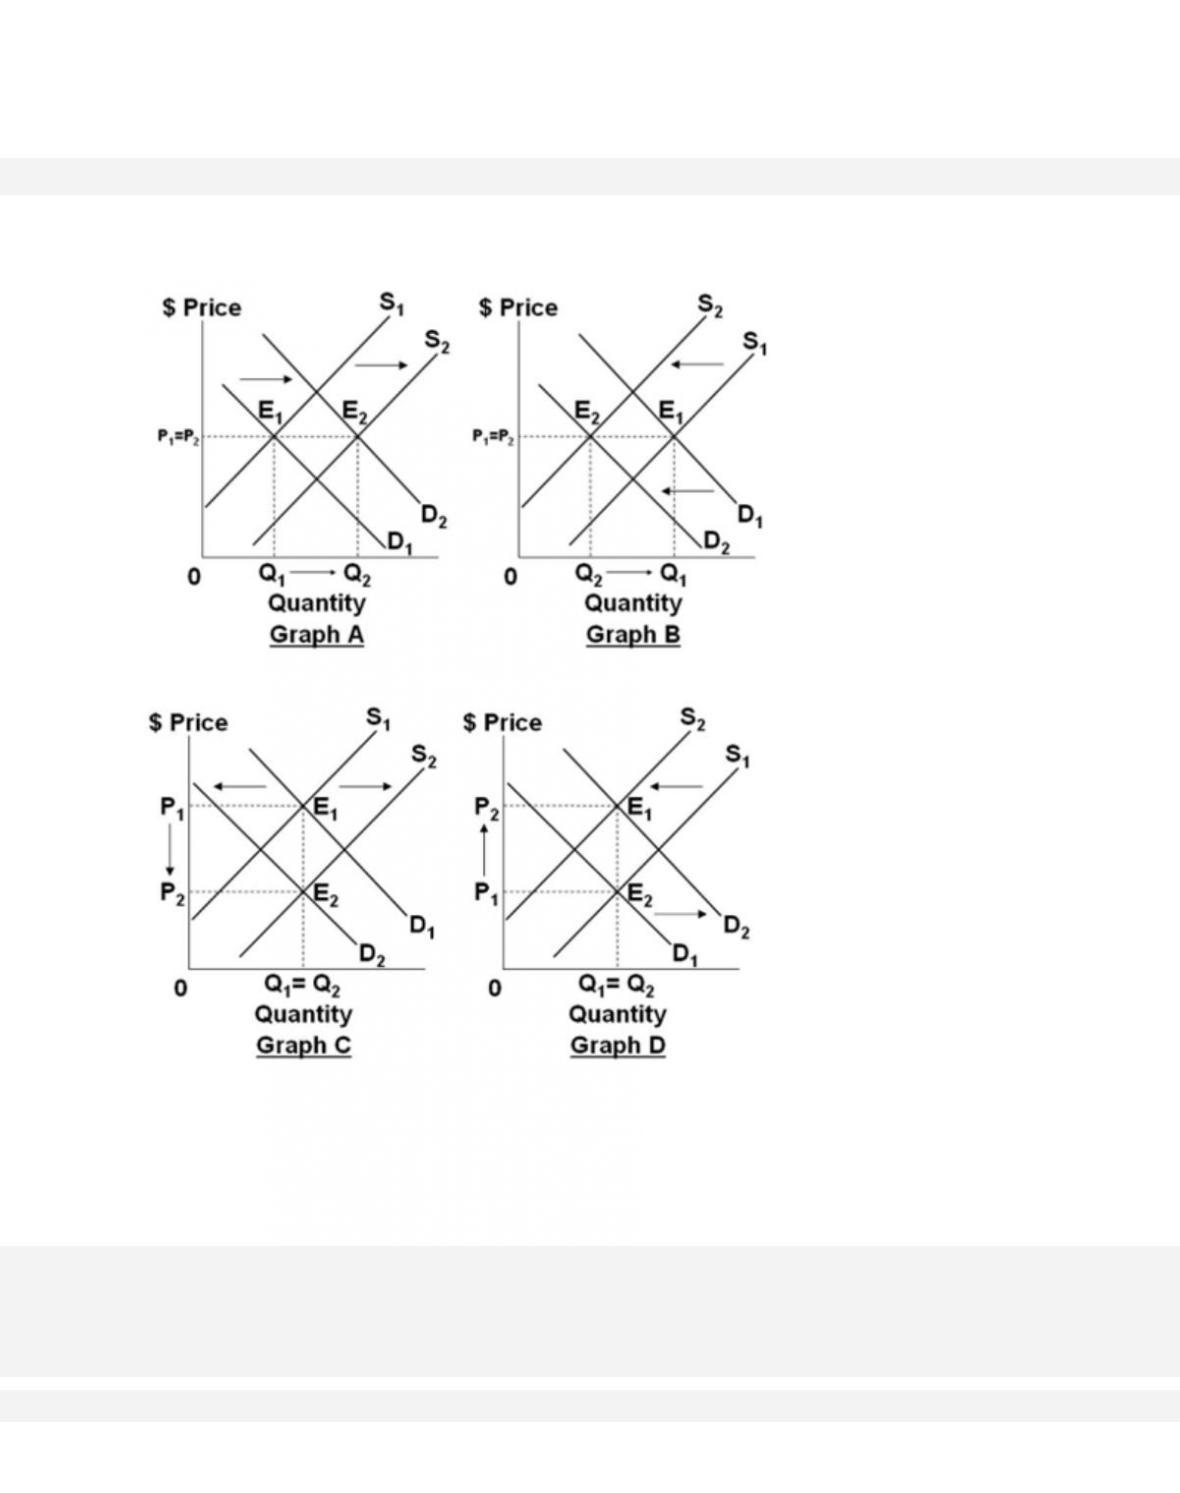
351.
Refer to the four graphs above. In which graph would the indicated shifts cause equilibrium
quantity to definitely rise, but the effect on price is indeterminate?
3-172
352.
Refer to the four graphs above. Select the graph that best shows the changes in demand and
supply in the market specified in the following situation: the market for beef, if a new diet fad
3-173
favoring beef consumption becomes hugely popular, while cattle producers see steeply rising
costs of cattle feed.
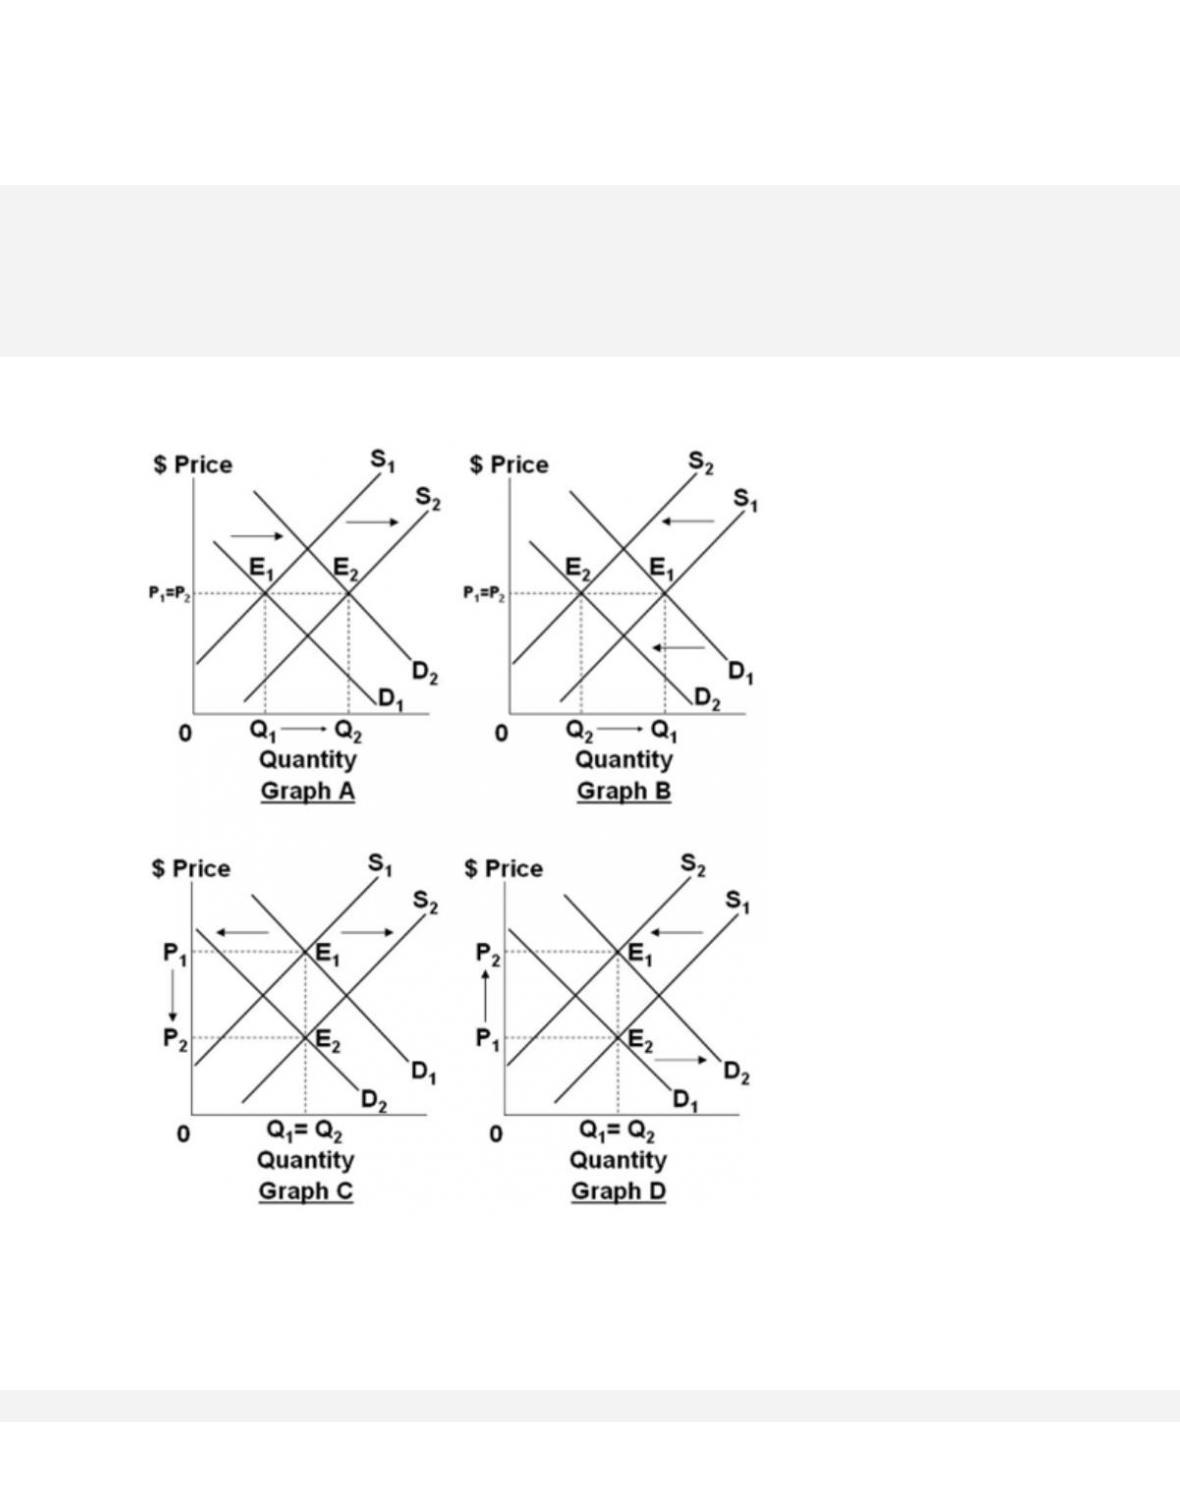
353.
3-174
Refer to the four graphs above. Select the graph that best shows the changes in demand and
supply in the market specified in the following situation: the market for corn, if gasoline
producers use more ethanol from corn and good weather during the growing season yields a
bumper harvest.
354.
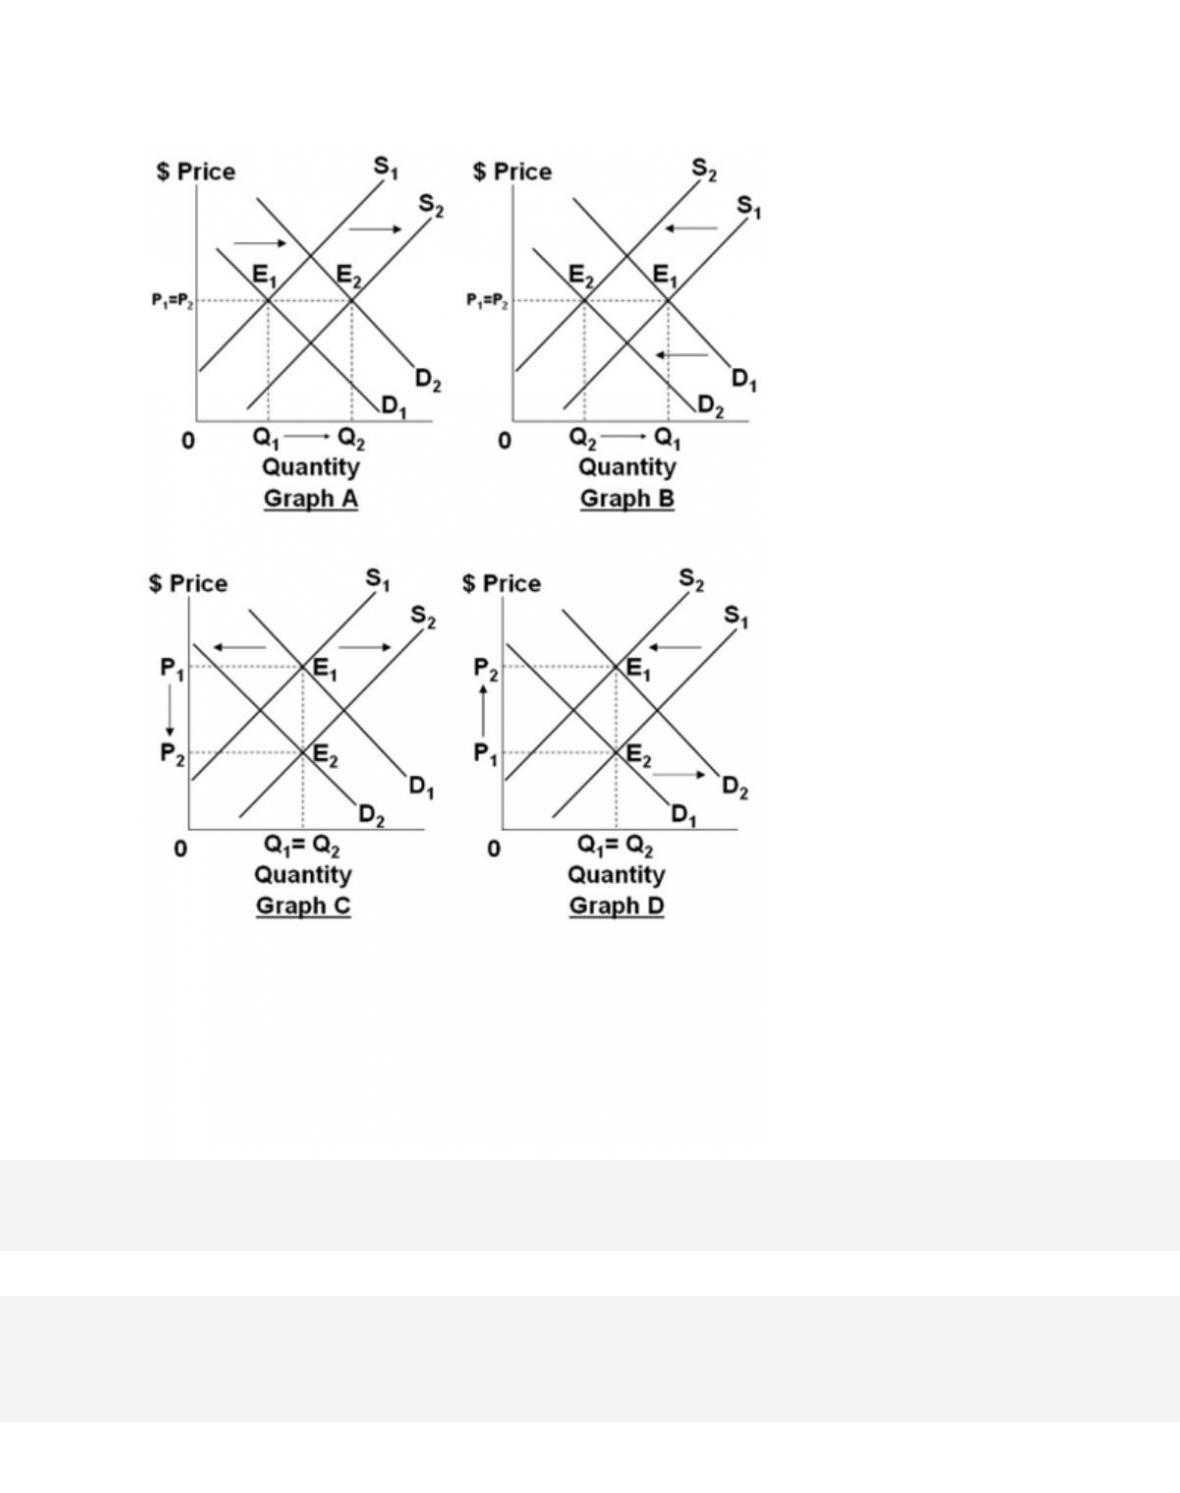
Refer to the four graphs above. Select the graph that best shows the changes in demand and
supply in the market specified in the following situation: the market for music CDs sold in
stores, if more consumers switch to music-downloads from the Internet and the cost of making
music CDs decreases because of technological improvement in production.

3-176
Copyright © 2018 McGraw-Hill Education. All rights reserved. No reproduction or distribution without the prior
written consent of McGraw-Hill Education.
Difficulty:
02 Medium
Learning Objective: 03–05 Explain how changes in supply and demand affect equilibrium
prices and quantities.
Test Bank: II
Topic:
Changes in Supply, Demand, and Equilibrium
355. If a price ceiling is set below the equilibrium price in a market,
A. rationing will be unnecessary.
356. A government-set price floor on a product
A. does not interfere with the rationing function of price in a market system.
357. Which is most likely to be observed in a community where legal ceilings are imposed on
residential rents?
3-177
Copyright © 2018 McGraw-Hill Education. All rights reserved. No reproduction or distribution without the prior
written consent of McGraw-Hill Education.
D. People moving into the community will have difficulty locating residential space to rent.
AACSB: Knowledge Application
A c c e s s i b i l i t y :
Keyboard Navigation
Blooms: Remember
Di f ficul ty:
01 Easy
Learning Objective: 03–06 Identify what government–set prices are and how they can cause
product surpluses and shortages.
Test Bank: II
Topic:
Application: Government-Set Prices
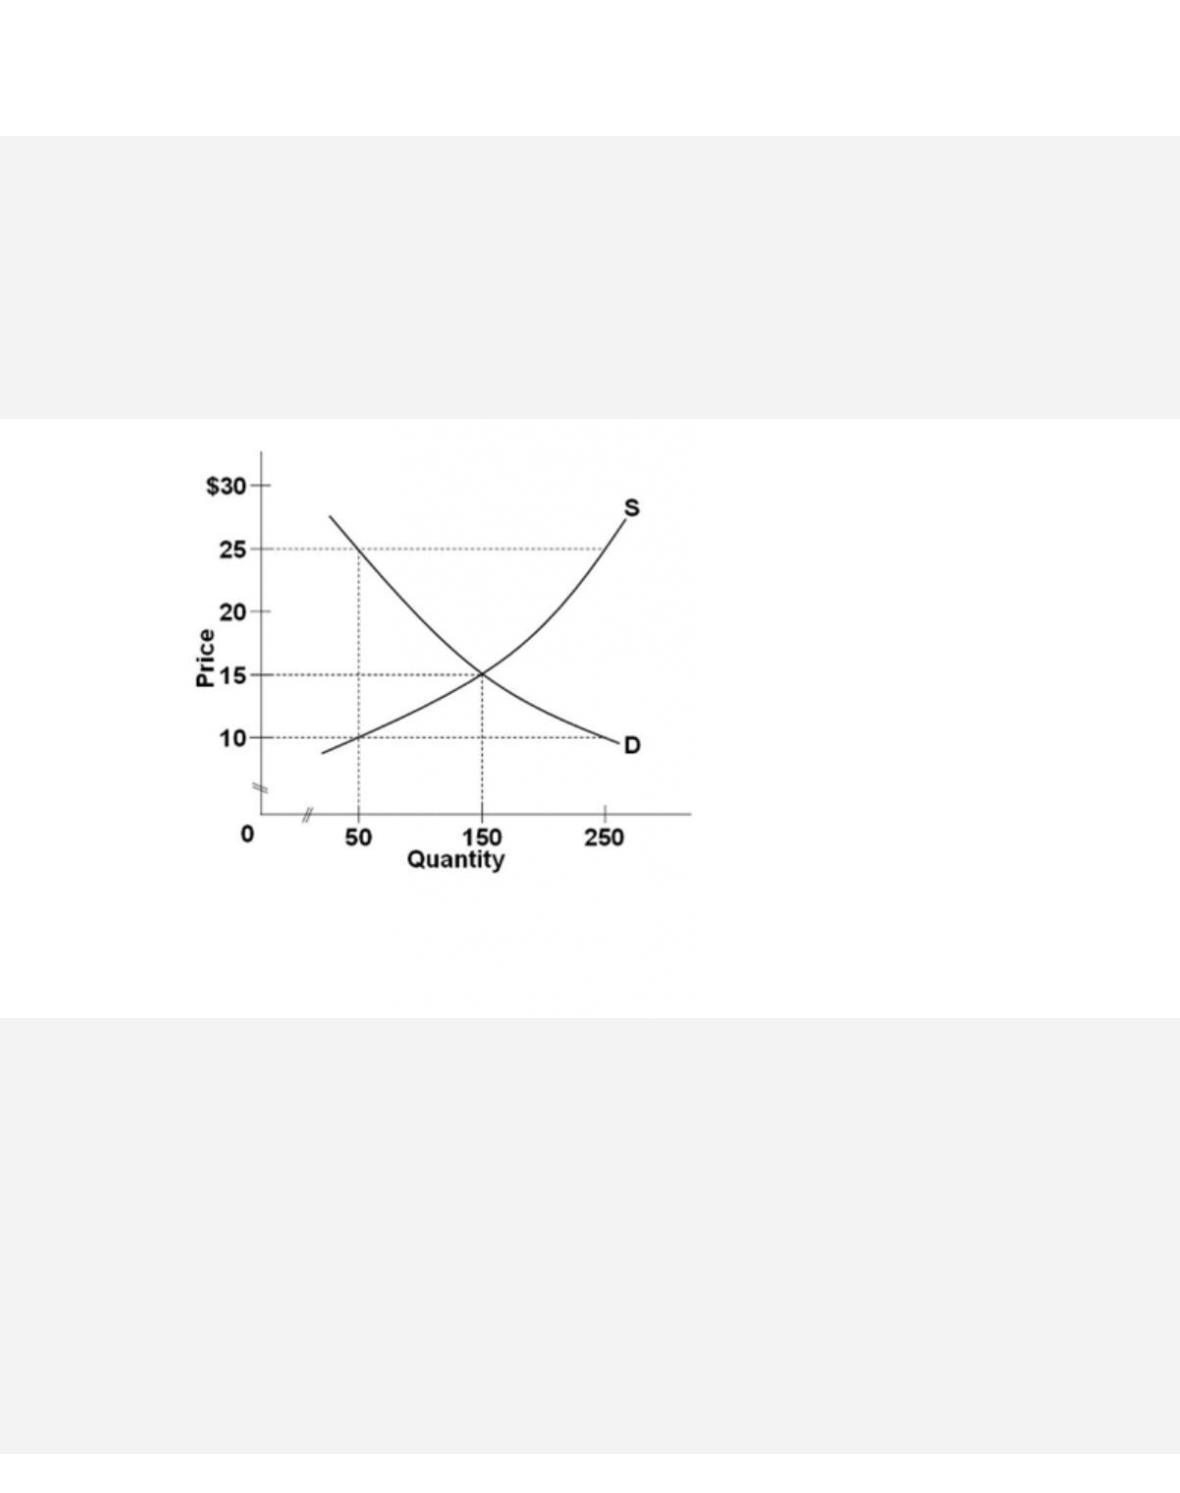
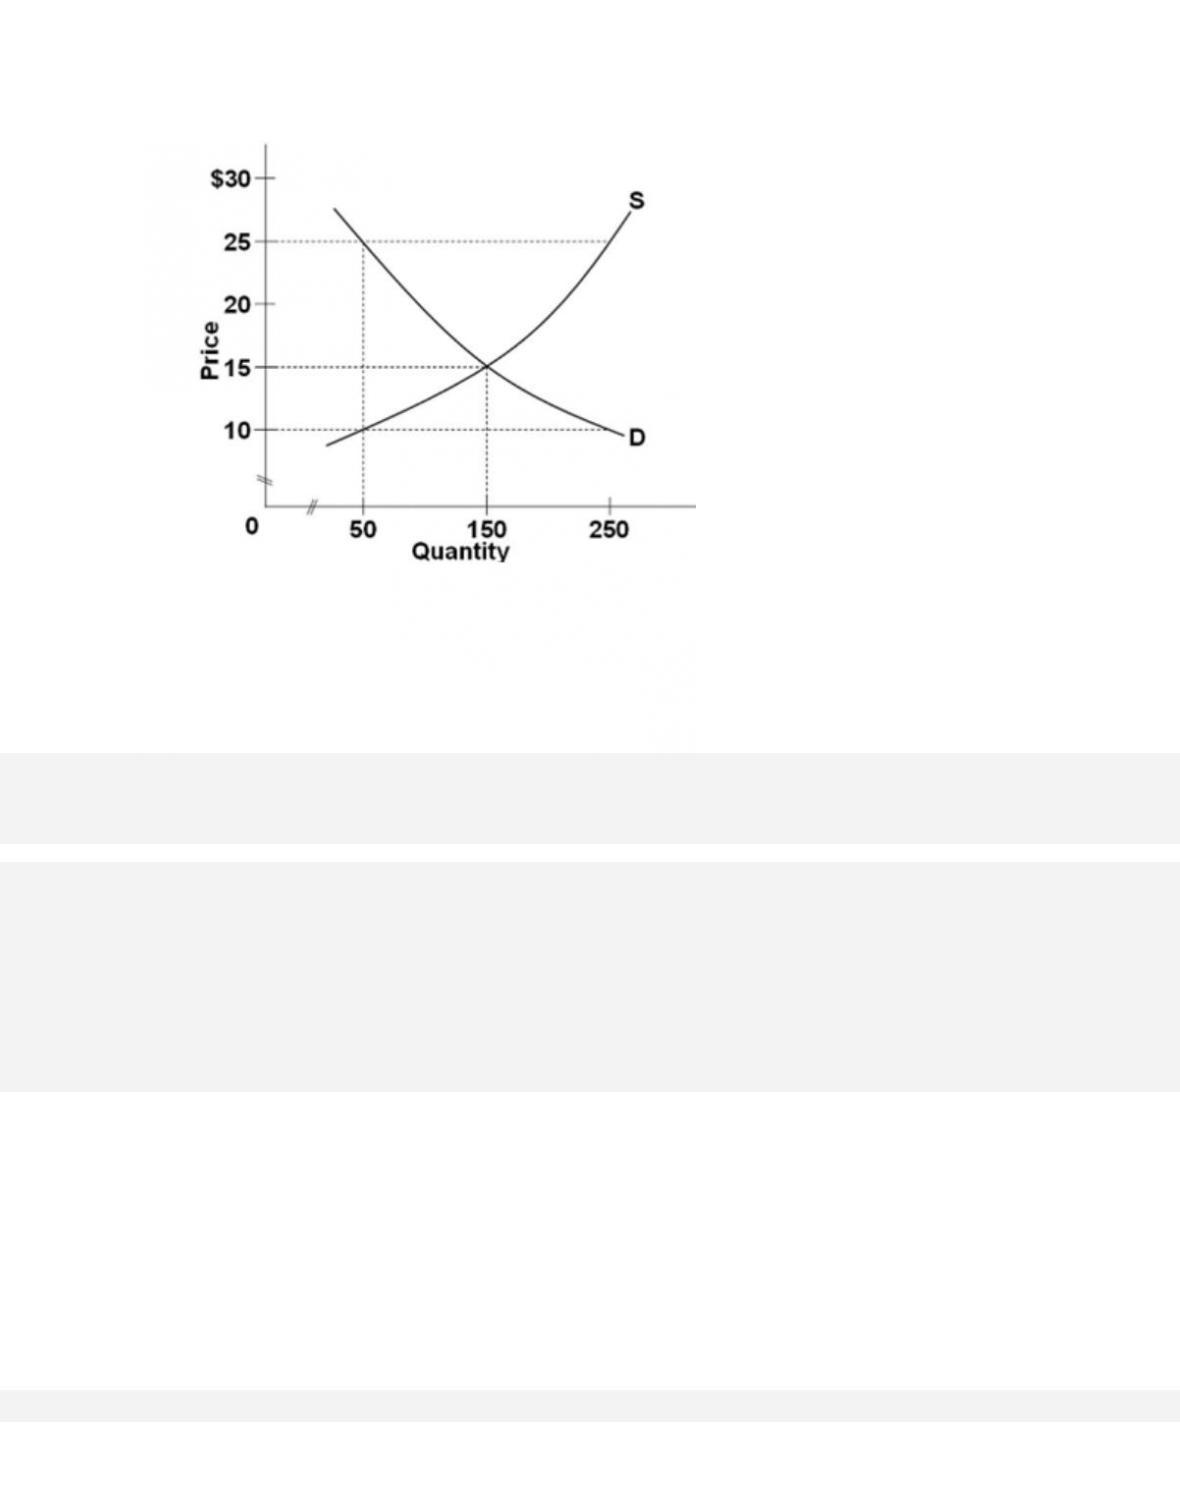
358.
In a competitive market illustrated by the diagram above, a price floor of $25 per unit will result
in
A. a shortage of 200 units.
3-178
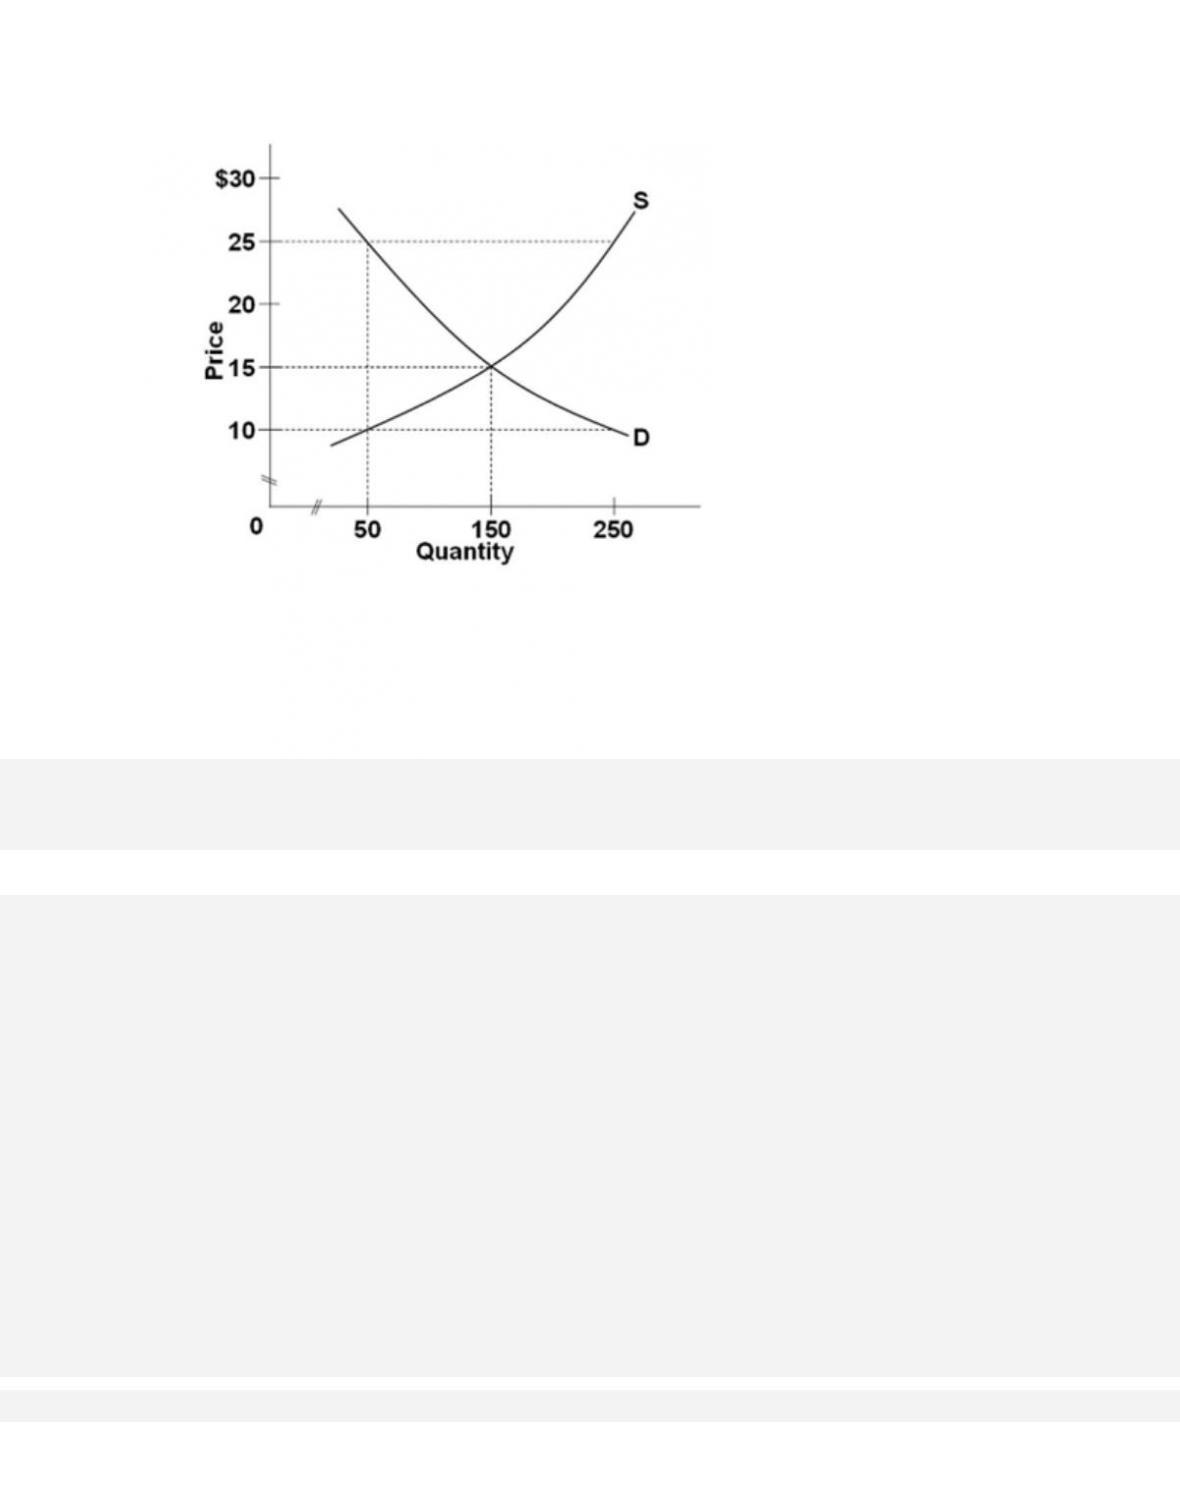
359.
In a competitive market illustrated by the diagram above, a price ceiling of $10 per unit will
result in
360.
In a competitive market illustrated by the diagram above, a price ceiling of $25 per unit will
result in
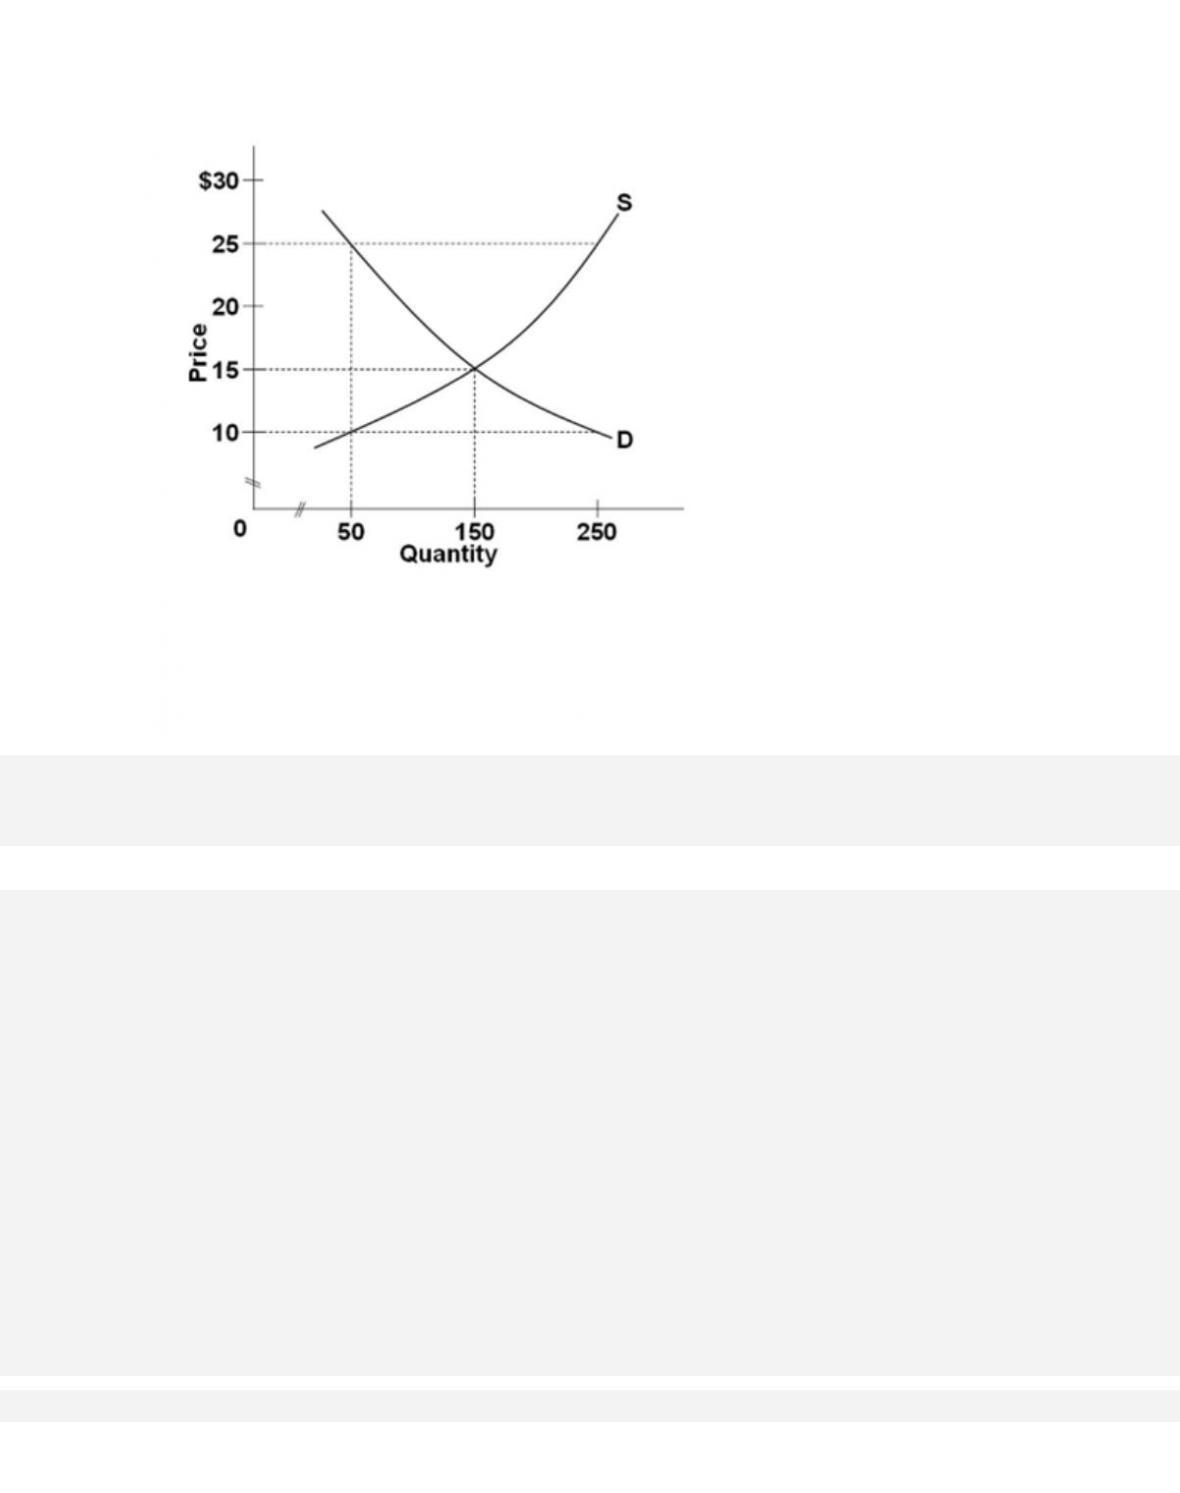
361.
In a competitive market illustrated by the diagram above, for a price floor to be effective and
alter the market situation, it must be set