Refer to the above table. In this competitive market, the price and quantity will settle at
A. $10 and 2,000 units.
302.
Price Per Unit
Quantity Demanded Per Year
Quantity Supplied Per Year
$ 5
2,000
0
10
1,800
300
15
1,600
600
20
1,400
900
25
1,200
1,200
30
1,000
1,500
Refer to the above table. At a price of $15 per unit, which of the following would exist?
A. a shortage of 1,600 units

3-142
Copyright © 2018 McGraw-Hill Education. All rights reserved. No reproduction or distribution without the prior
written consent of McGraw-Hill Education.
Diffic ulty:
02 Medium
Learning Objective: 03–04 Relate how supply and demand interact to determine market
equilibrium.
Test Bank: II
To pi c:
Market Equilibrium
303.
Price Per Unit
Quantity Demanded Per Year
Quantity Supplied Per Year
$ 5
2,000
0
10
1,800
300
15
1,600
600
20
1,400
900
25
1,200
1,200
30
1,000
1,500
Refer to the above table. A surplus of 500 units will occur when the price is
A. $10 per unit.
304. The market system automatically corrects a surplus condition in a competitive market by
A. raising the price of the commodity in question while increasing the quantity demanded.

3-143
Copyright © 2018 McGraw-Hill Education. All rights reserved. No reproduction or distribution without the prior
written consent of McGraw-Hill Education.
Learning Objective: 03–04 Relate how supply and demand interact to determine market
equilibrium.
Test Bank: II
To pi c:
Market Equilibrium
305. Which of the following statements about ticket scalping is correct?
A. Scalping tends to be prevalent when there is a surplus of tickets.
306. If an economy is being “productively efficient,” then that means the economy is
A. producing the products most wanted by society.
307. Attaining “allocative efficiency” means that
A. the law of increasing opportunity costs has reached a maximum.

3-144
Copyright © 2018 McGraw-Hill Education. All rights reserved. No reproduction or distribution without the prior
written consent of McGraw-Hill Education.
AACSB: Knowledge Application
A c c e s s i b i l i t y :
Keyboard Navigation
Blooms: Understand
Diffic ulty:
02 Medium
Learning Objective: 03–04 Relate how supply and demand interact to determine market
equilibrium.
Test Bank: II
To pi c:
Market Equilibrium
308. When central planners in a command economy end up having a huge surplus of shoes and
widespread shortages of bread in their economy, they have failed to attain
A. productive efficiency.
309. A decrease in supply, holding demand constant, will cause
A. higher prices and a larger quantity sold.
310. Which of the following statements is correct? (Assume demand is interacting with an
upward sloping supply curve.)

A. If demand increases, then price will decrease.
311. An increase in the equilibrium quantity of hybrid cars would be caused by which of the
following?
C. higher prices of car batteries
D. lower prices for gasoline
312. A news story states that “DVDs lose their appeal as consumers switch to online streaming
for movies.” In a competitive market for DVDs, this situation would lead to a(n)
A. increase in the price and the quantity sold of DVDs.

3-146
Copyright © 2018 McGraw-Hill Education. All rights reserved. No reproduction or distribution without the prior
written consent of McGraw-Hill Education.
Learning Objective: 03–05 Explain how changes in supply and demand affect equilibrium
prices and quantities.
Test Bank: II
To pi c:
Changes in Supply, Demand, and Equilibrium
313. Last year the price of corn was $3 a bushel and the quantity of corn demanded was 10
million bushels. This year the price of corn was $4.00 a bushel and the quantity demanded was
9 million bushels. Is this evidence that the law of demand does not apply to corn?
A. Yes, because there is a direct relationship between the price of corn and the quantity
supplied.
B. Yes, because there is an inverse relationship between the price of corn and the quantity
314. A decrease in the price of digital cameras would lead to a(n)
D. decrease in the price and an increase in quantity sold of memory cards.
315. A headline reads, “Lumber Prices Up Sharply.” In a competitive market, this situation
would lead to a(n)

A. increase in the price and quantity of new homes.
316. Sometimes, we observe cases where the price of a product rose and the quantity bought by
buyers also increased. Such cases occur due to a violation of the
A. Law of Demand.
317. A television station reports that the price of coffee has increased and the quantity traded in
the market has decreased. This situation would be caused by a(n)
A. increase in demand.

3-148
Copyright © 2018 McGraw-Hill Education. All rights reserved. No reproduction or distribution without the prior
written consent of McGraw-Hill Education.
prices and quantities.
Test Bank: II
To pi c:
Changes in Supply, Demand, and Equilibrium
318. A newspaper reports that the average price of new homes in a certain city had decreased,
and the number of new homes sold had also decreased. This situation is probably caused by
A. declining costs of construction materials and services in that city.
319. Two months ago, the Maryville Shirt company sold 2,000 shirts at $30 per shirt. Last month
the company raised its price to $35 per shirt and sold 3,000 shirts. Evidently the company
experienced a(n)
A. decrease in demand.
3-149
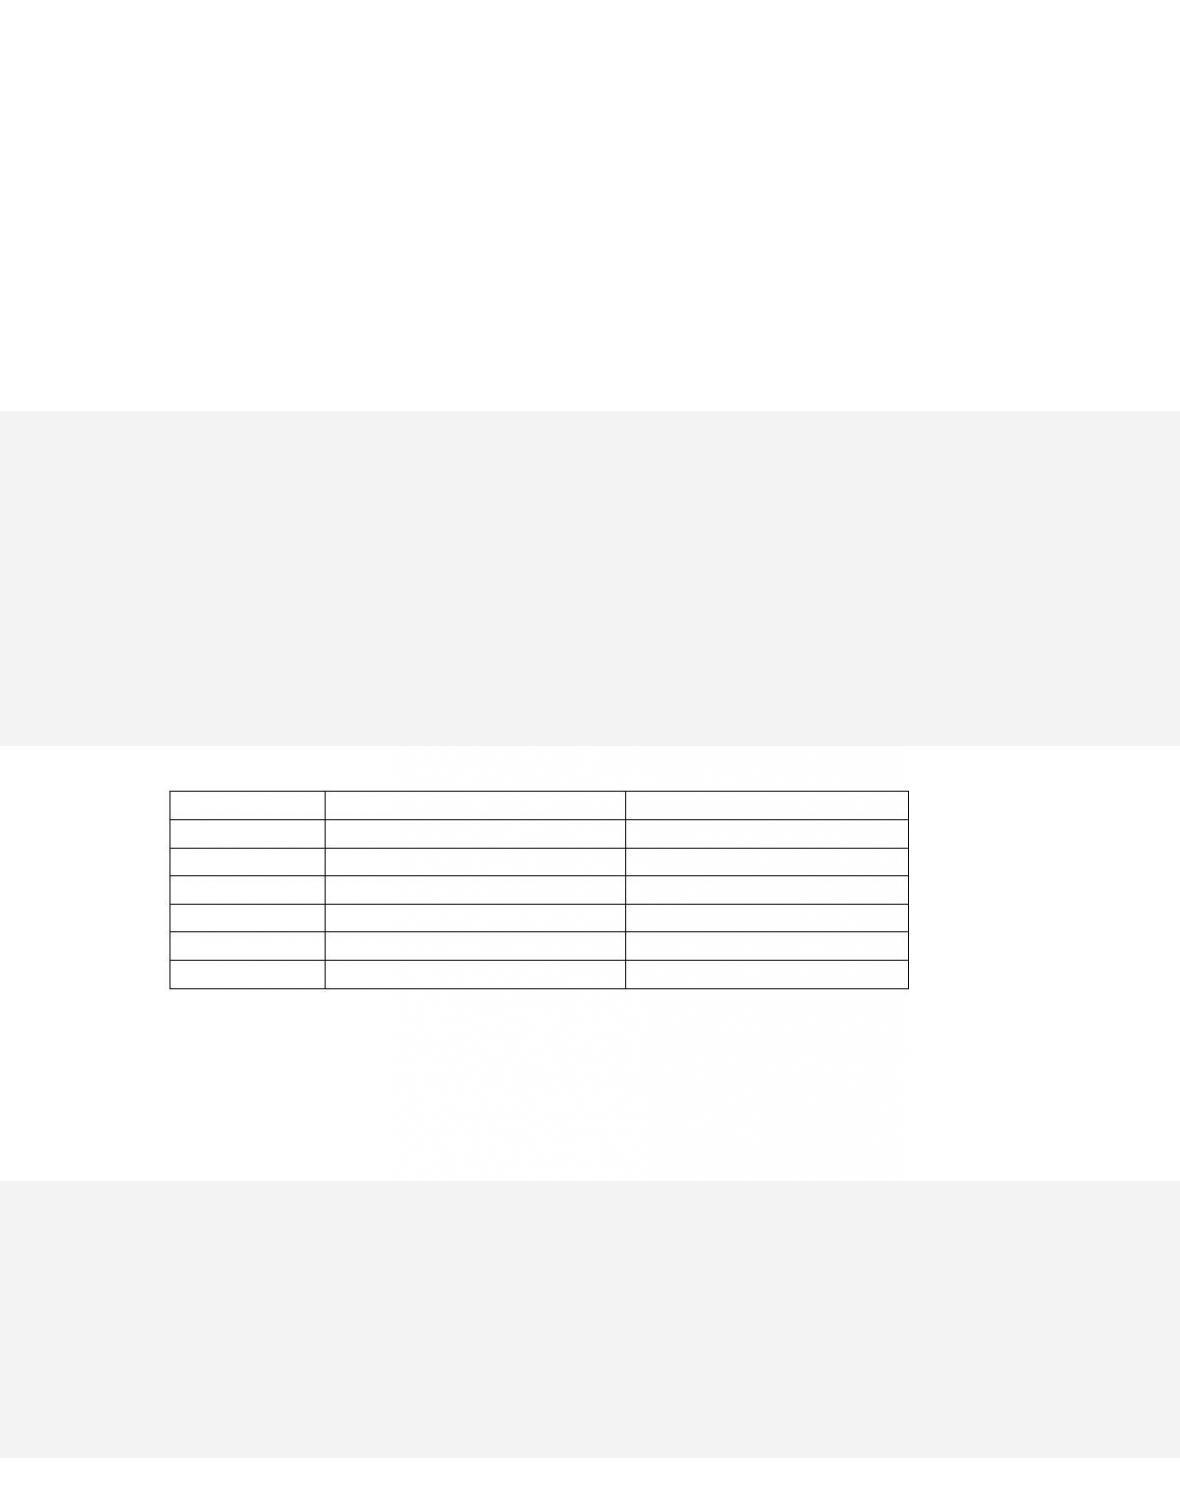
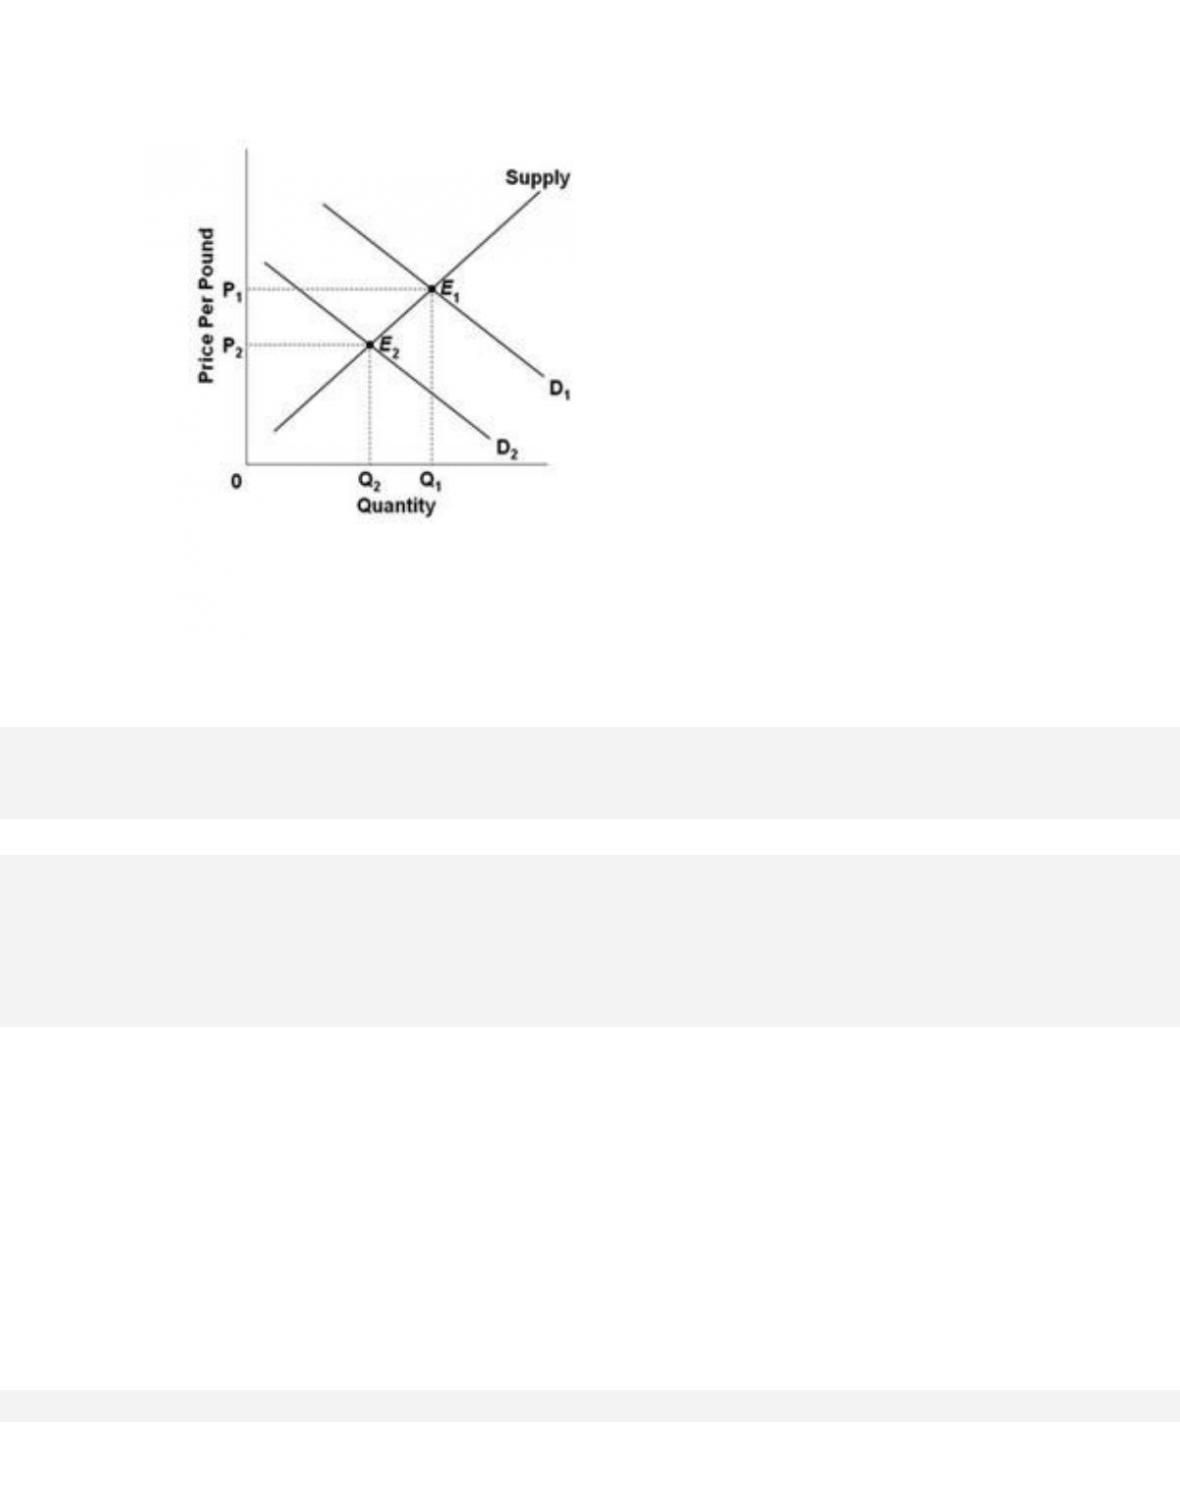
320.
Refer to the above graph showing the market for a product. Which of the following could not
explain the indicated increase in equilibrium price from P1 to P2?
A. an increase in consumer incomes
3-150
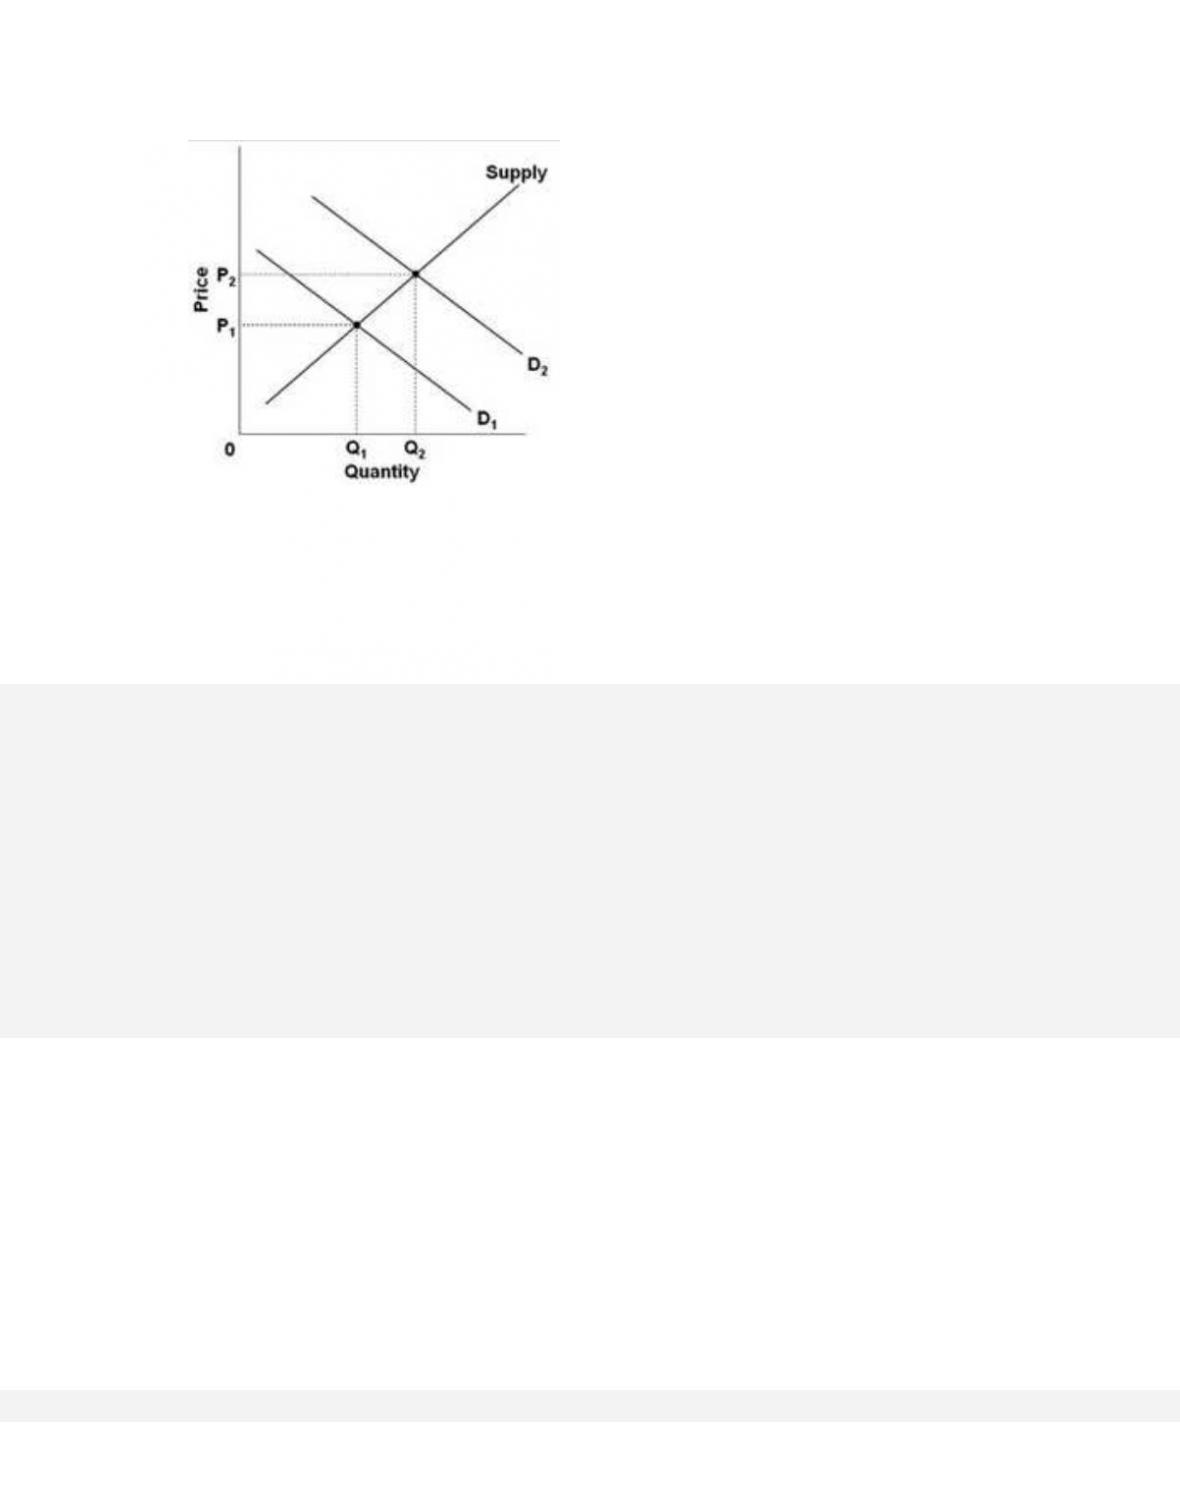
321.
Refer to the above graph showing the market for a product. Which of the following would best
explain why the shift in demand from D1 to D2
would cause price to rise from P1 to P2?
A. After the shift in the demand, there would be a surplus at price P2.
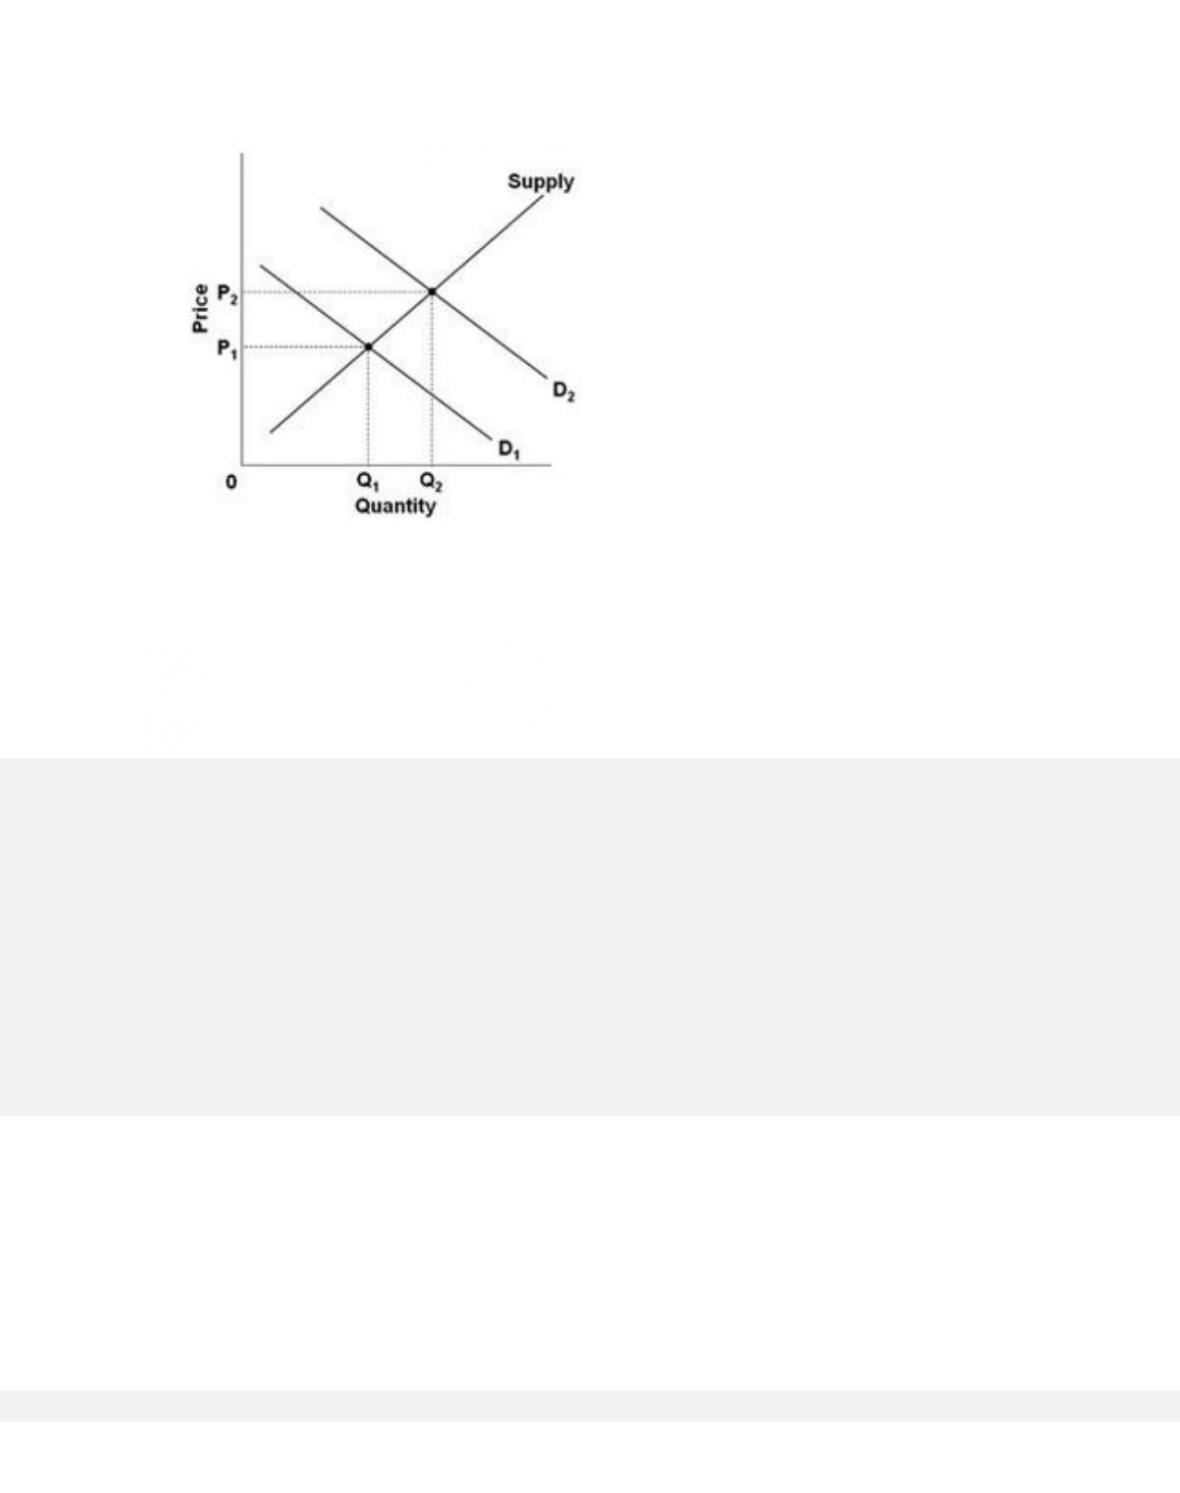
322.
Refer to the above graph, which shows the market for beef where demand shifted from D1 to
D2. The change in equilibrium from E1 to E2 is most likely to result from
D. a decrease in the tax on beef products.
3-152
323.
Refer to the above graph, which shows the market for beef where demand shifted from D1 to
D2. The change in equilibrium from E1 to E2
cannot be a result of
A. buyers’ expectations of lower prices for beef in the very near future.
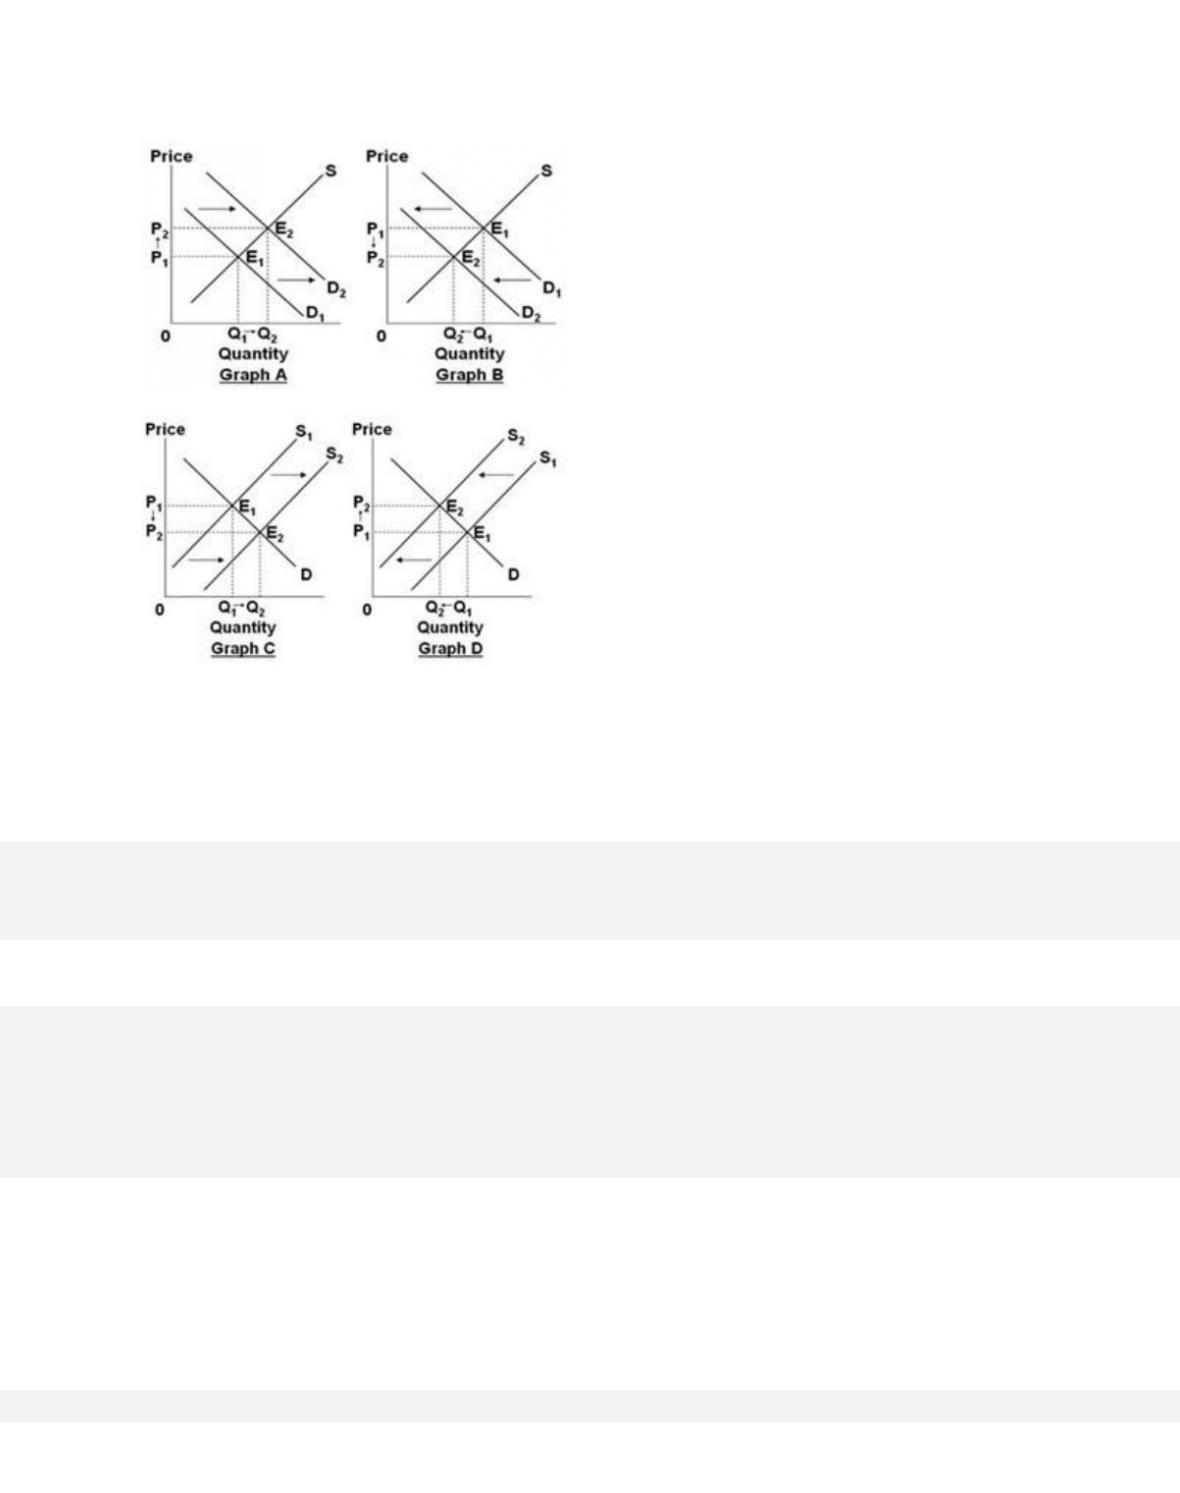
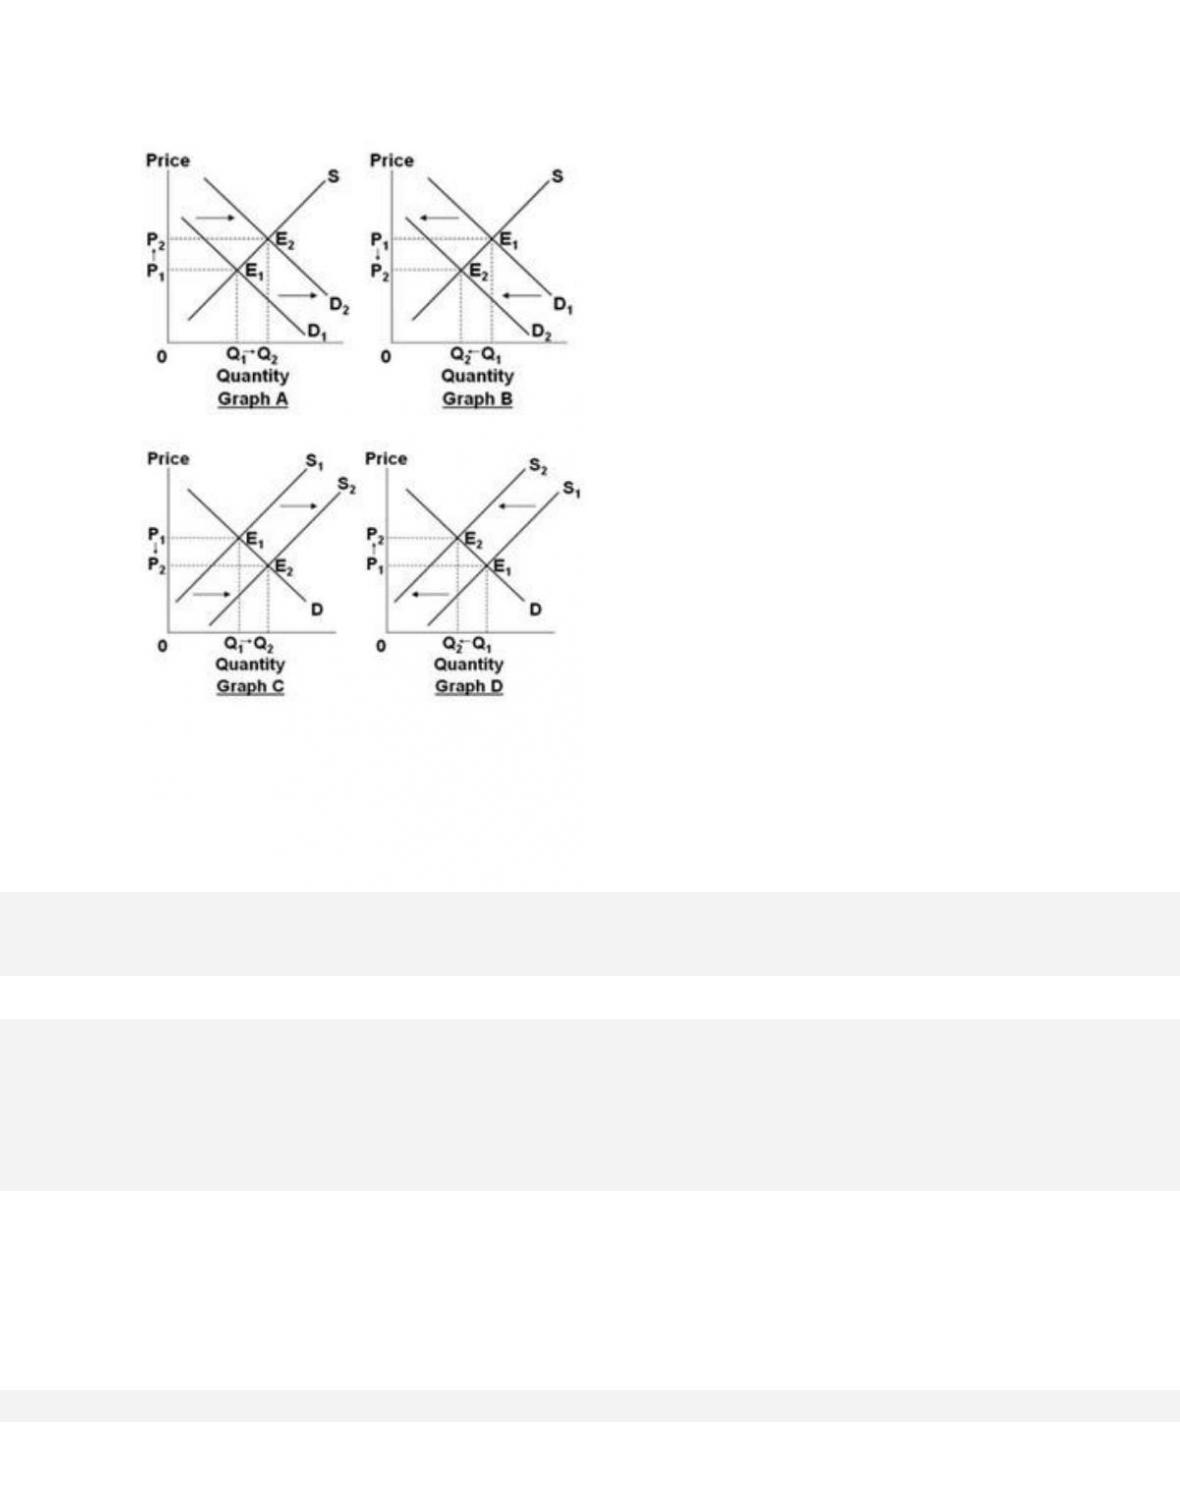
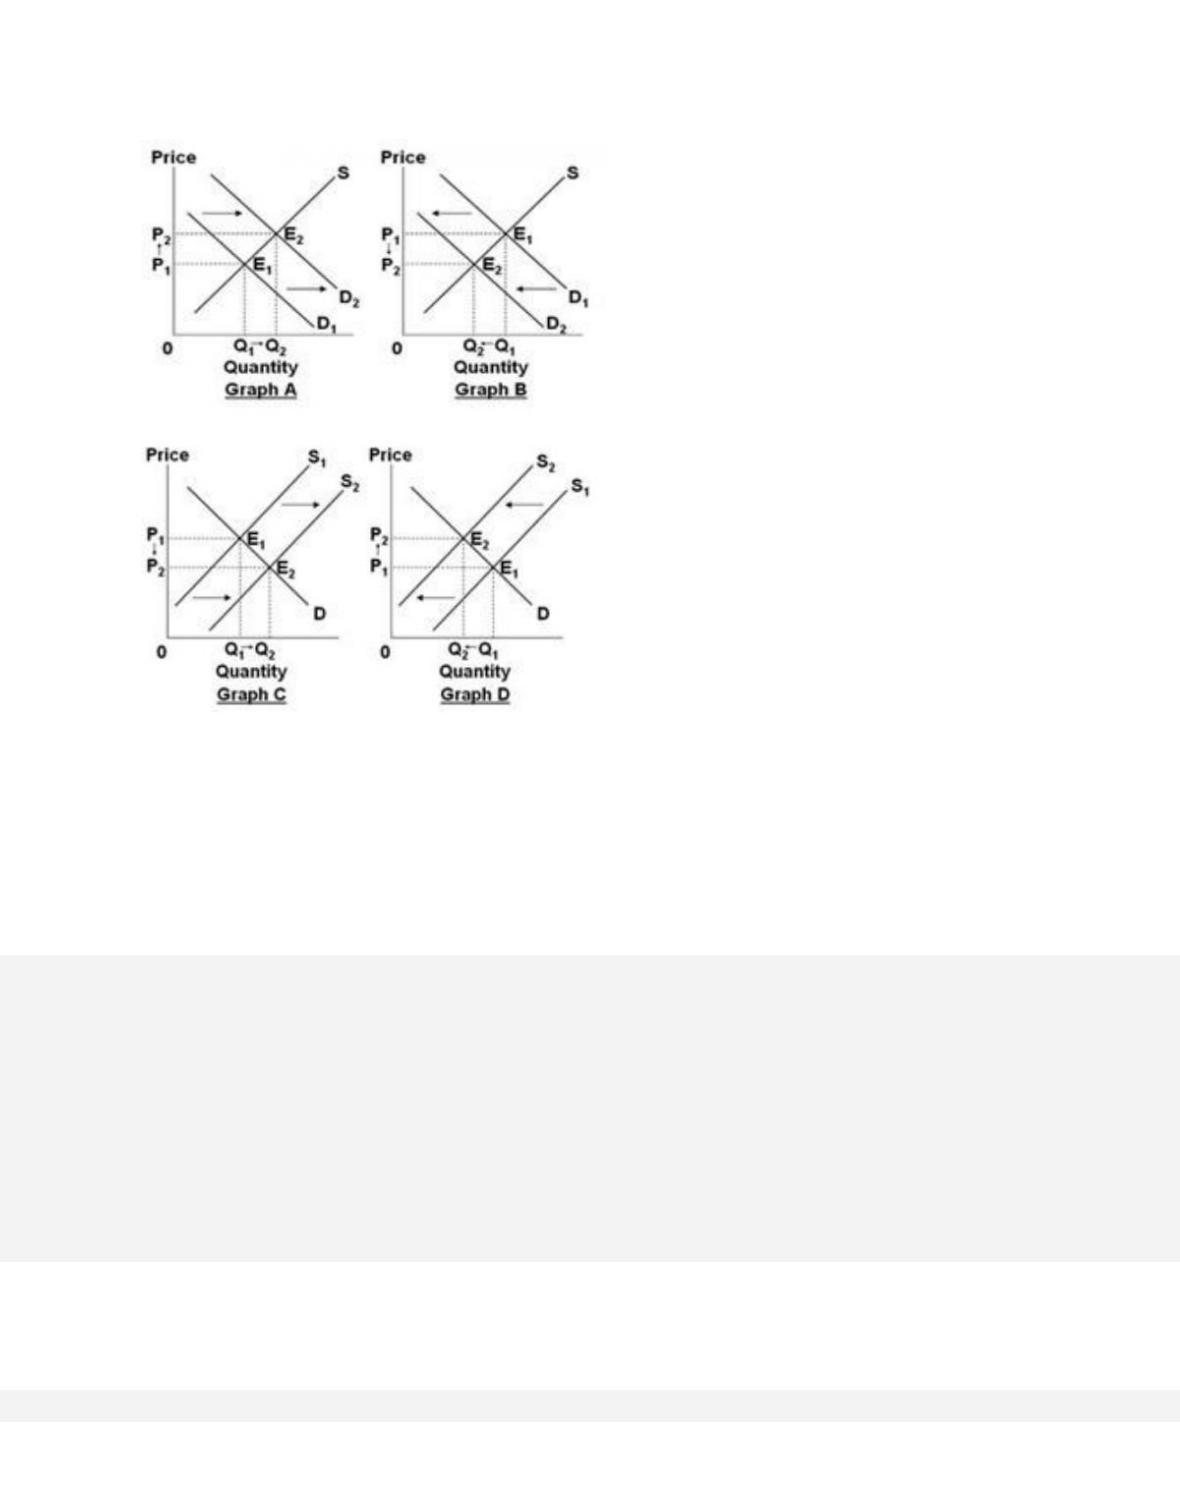
324. Assume that the graphs show a competitive market for the product stated in the question.
3-153
Select the graph above that best shows the change in the market specified in the following
situation: the market for leather coats, when leather coats become more fashionable among
young consumers.
D. Graph D
325. Assume that the graphs show a competitive market for the product stated in the question.
3-154
Select the graph above that best shows the change in the market specified in the following
situation: the market for chicken, when the price of a substitute, such as beef, decreases.
A. Graph A
326. Assume that the graphs show a competitive market for the product stated in the question.
3-155
Select the graph above that best shows the change in the market specified in the following
situation: the market for digital cameras, when the productivity of workers in the digital camera
industry increases.
A. Graph A
327. Assume that the graphs show a competitive market for the product stated in the question.
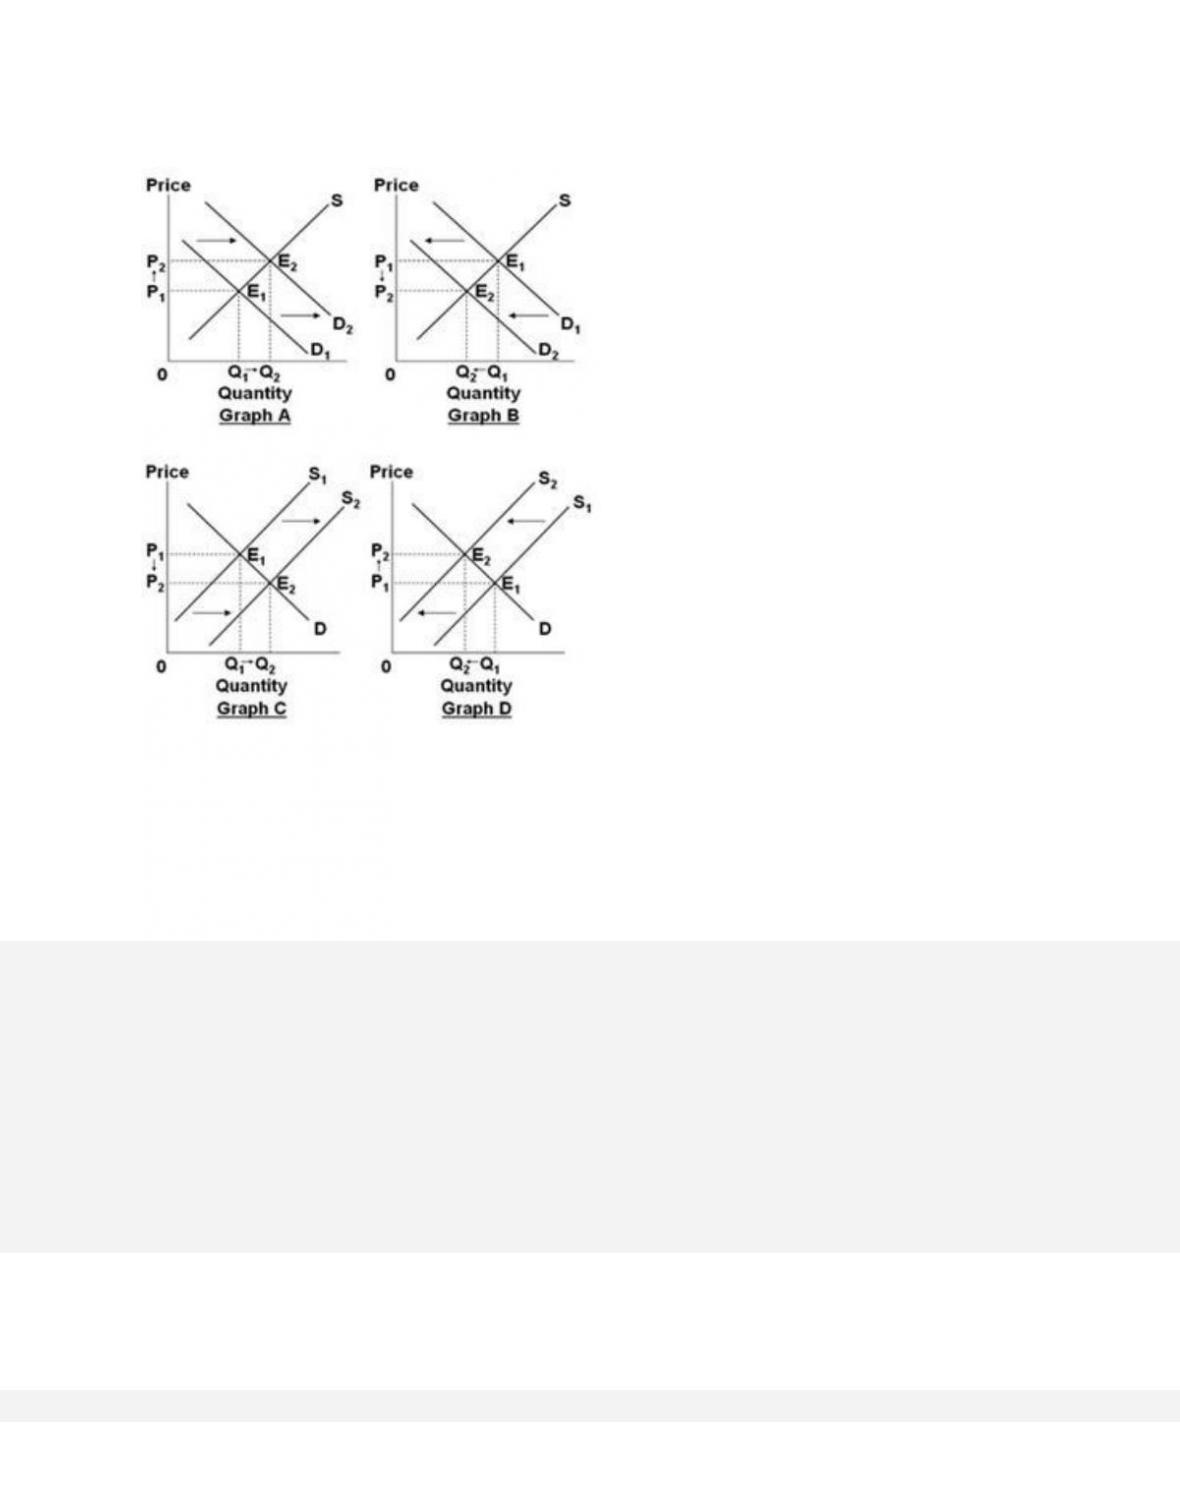
3-156
Select the graph above that best shows the change in the market specified in the following
situation: the market for houses, when consumers experience a substantial fall in income due to
a serious economic recession.
A. Graph A
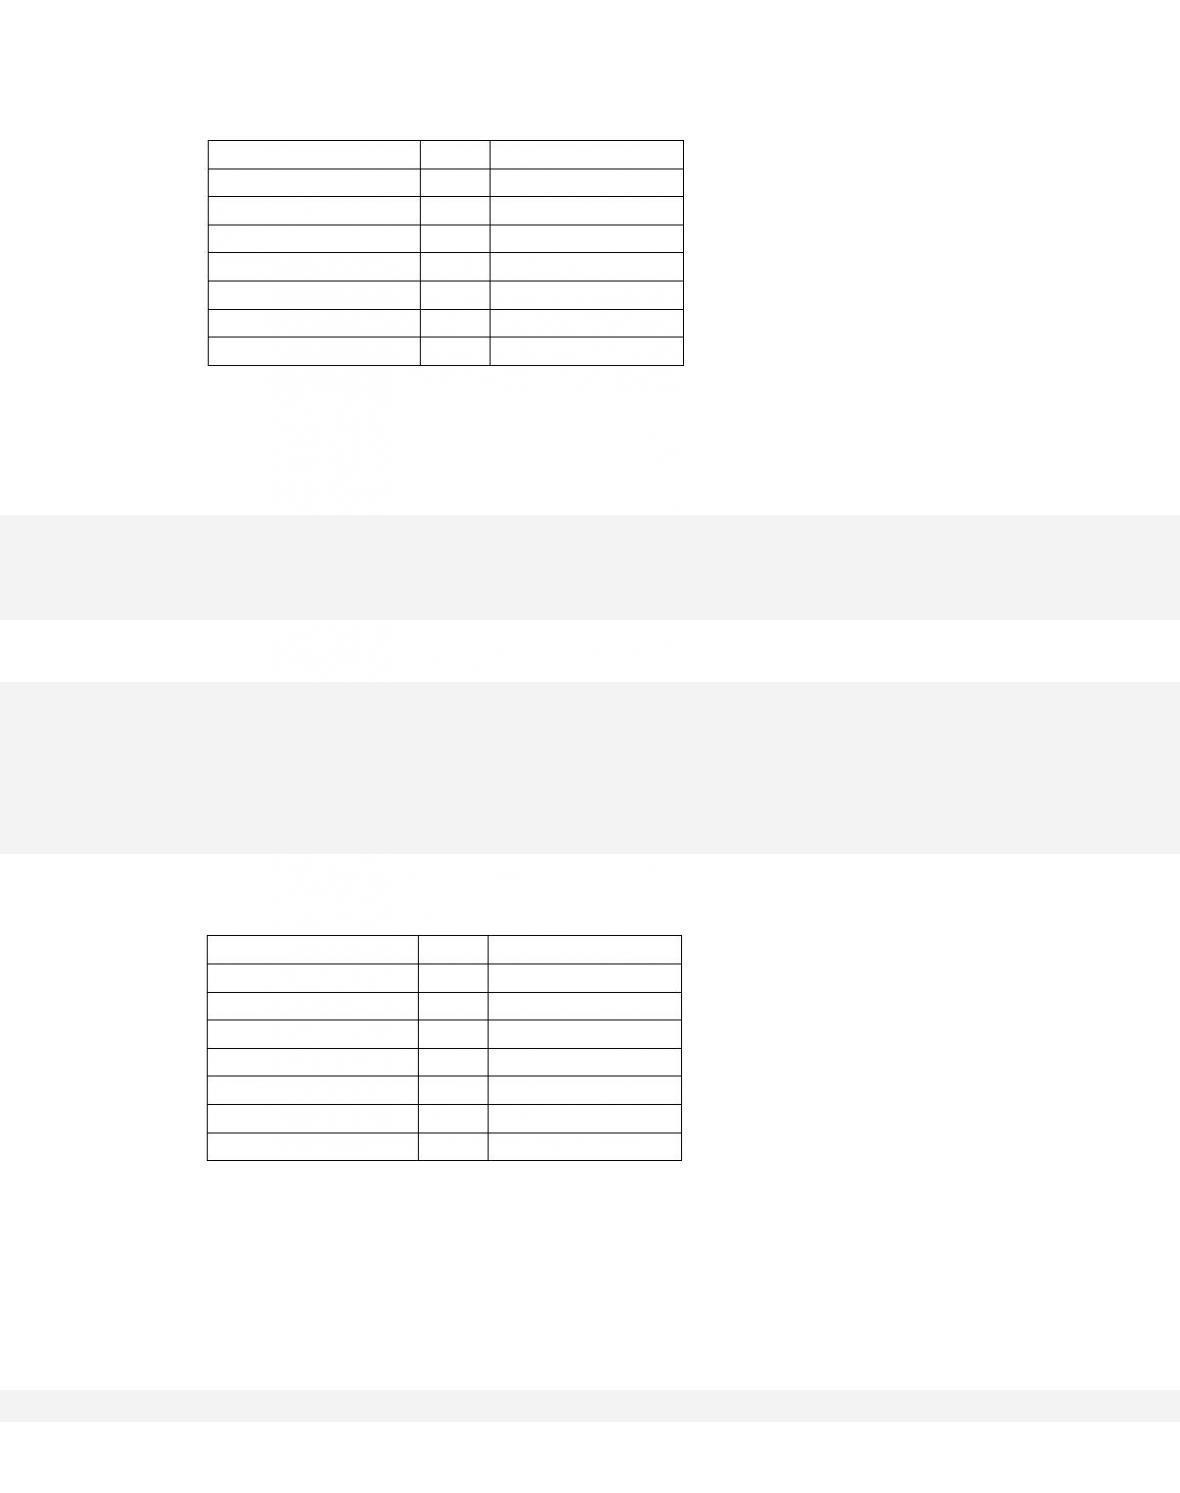
328.
3-157
Quantity Demanded
Price
Quantity Supplied
5
$7
9
6
6
8
7
5
7
8
4
6
9
3
5
10
2
4
11
1
3
Refer to the above table. If demand decreased by 4 units at each price, what would the new
equilibrium price and quantity be?
D. $6 and 8 units
329.
Quantity Demanded
Price
Quantity Supplied
5
$7
9
6
6
8
7
5
7
8
4
6
9
3
5
10
2
4
11
1
3
Refer to the above table. If supply decreased by 2 units at each price, what would the new
equilibrium price and quantity be?

3-158
A. $3 and 5 units
330.
Quantity Demanded
Price
Quantity Supplied
5
$7
9
6
6
8
7
5
7
8
4
6
9
3
5
10
2
4
11
1
3
Refer to the above table. If demand decreased by 4 units at each price and supply decreased by 2
units at each price, what would the new equilibrium price and quantity be?
A. $3 and 5 units
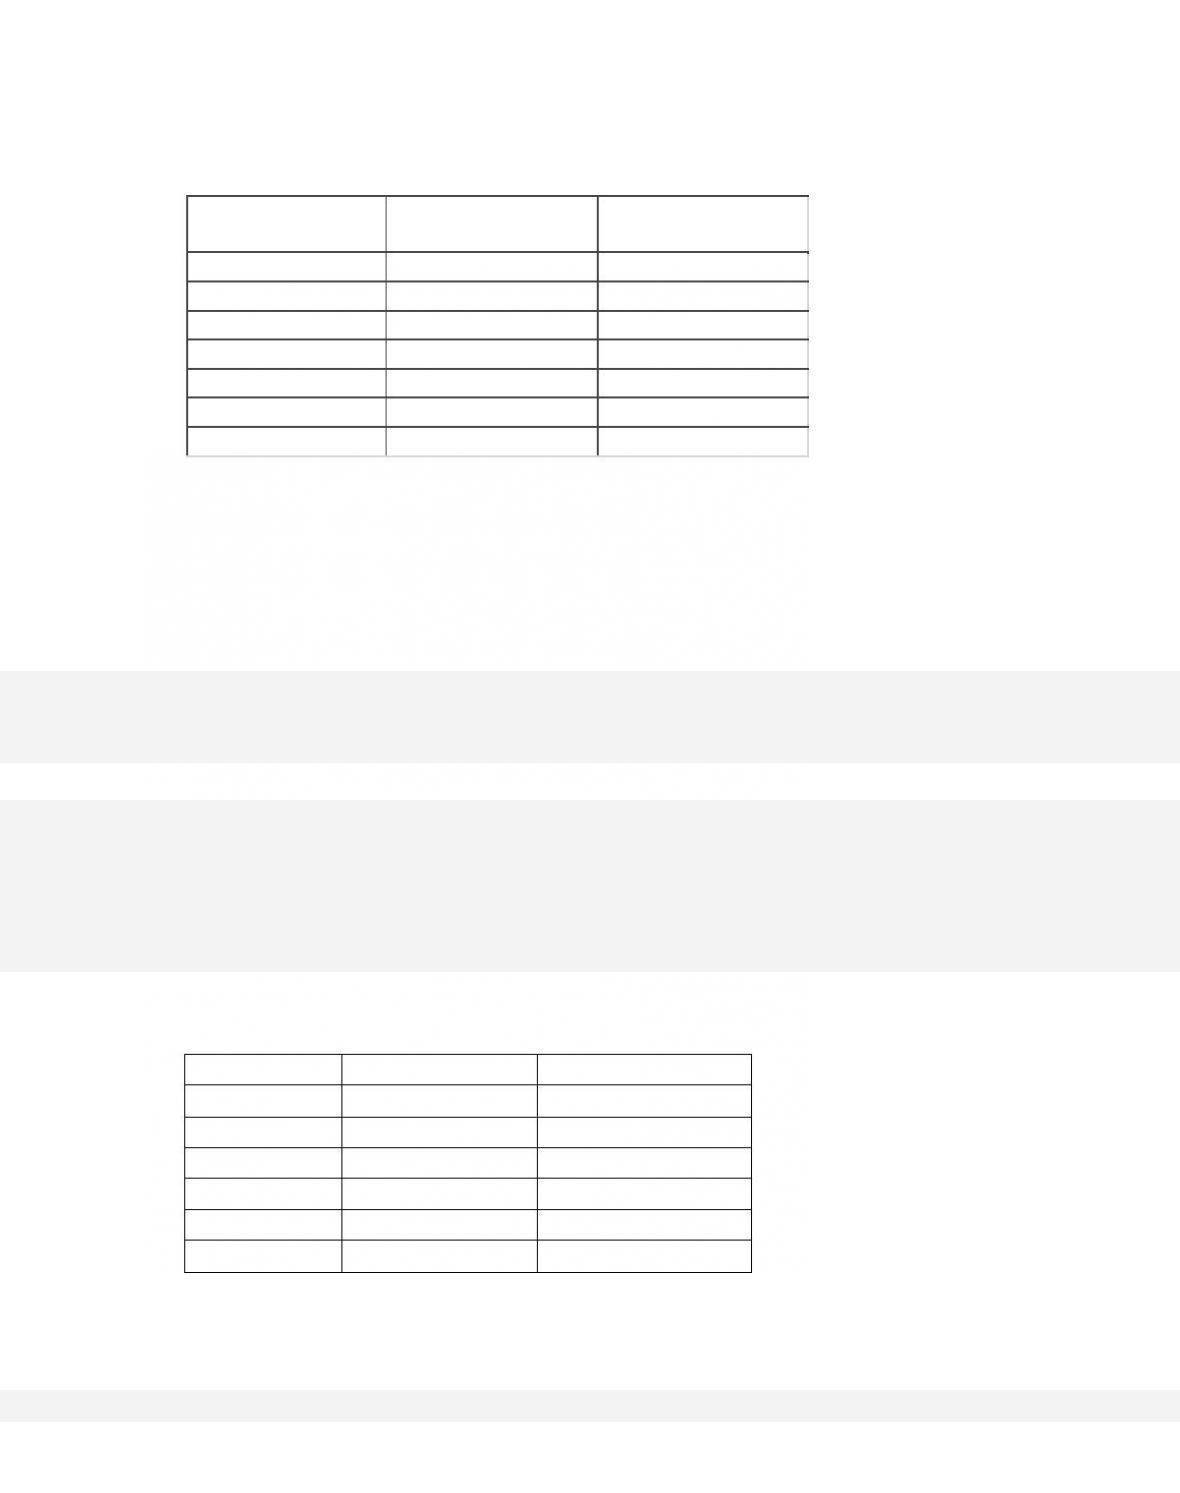
331. The following data show the supply and demand schedules for a product.
3-159
Price Per Unit
Quantity Demanded
Per Week (units)
Quantity Supplied
Per Week (units)
$40
100
15
50
50
20
60
48
25
70
45
30
80
40
40
90
30
46
100
25
50
The government now introduces a subsidy payment to producers of $30 per unit. Assuming a
purely competitive market for the product, the new equilibrium price will be between
A. $40 and $50.
332.
Price Per Unit
Quantity Supplied
Quantity Demanded
$10
100
295
11
150
275
12
190
250
13
220
220
14
245
180
15
265
135

If a technological advance lowers production costs such that the quantity supplied increases by
60 units of this product at each price, the new equilibrium price would be
A. $11.
333.
Price Per Unit
Quantity Supplied
Quantity Demanded
$10
100
295
11
150
275
12
190
250
13
220
220
14
245
180
15
265
135
Refer to the above table. A technological advance lowers production costs such that the quantity
supplied increases by 60 units of this product at each price. As a result of this technological
change, equilibrium output in this market
A. decreased by 60 units.