
3-121
Copyright © 2018 McGraw-Hill Education. All rights reserved. No reproduction or distribution without the prior
written consent of McGraw-Hill Education.
Diffic ulty:
02 Medium
Learning Objective: 03–02 Describe demand and explain how it can change.
Test Bank: II
To pi c:
Demand
264. An increase in the price of product B leads to an increase in the demand for product C.
This indicates that products B and C are
265. Which of the following would best be classified as a complement for new houses/homes?
A. lumber or steel
266. If the price of Pepsi decreases, other factors constant, then we’d expect to see a consequent
shift of the demand curve for
D. Pepsi to the right.

3-122
Copyright © 2018 McGraw-Hill Education. All rights reserved. No reproduction or distribution without the prior
written consent of McGraw-Hill Education.
AACSB: Knowledge Application
A c c e s s i b i l i t y :
Keyboard Navigation
Blooms: Understand
Diffic ulty:
02 Medium
Learning Objective: 03–02 Describe demand and explain how it can change.
Test Bank: II
To pi c:
Demand
267. Which statement is true about supply?
A. There is an inverse relationship between price and quantity supplied.
268. If the price of a product decreases, we would expect
A. demand to increase.
269. “Price” in the statement of the Law of Supply refers to

3-123
D. the total amount that buyers pay in order to acquire a given quantity of the product.
270. An “increase in the quantity supplied” suggests a
A. rightward shift of the supply curve.
271. All of the following are assumed to be constant when the supply curve for a product is
drawn, except the
D. price of inputs used to make the product.
272. In order to derive the market supply curve from individual supply curves, we add up the
A. various prices that individual sellers are charging for the product.

3-124
Copyright © 2018 McGraw-Hill Education. All rights reserved. No reproduction or distribution without the prior
written consent of McGraw-Hill Education.
B. various quantities that individual sellers want to sell at specific price levels.
C. total number of sellers in the market at a given time.
D. costs that all individual sellers incur in producing the product.
273. Which of the following is a determinant of supply?
A. tastes and preferences of buyers
274. Suppose that a more efficient way to produce a good is discovered, thus lowering
production costs for the good. This will cause a(n)
D. decrease in quantity supplied.
275. If farmers withhold some of their current corn harvest from the market because they

anticipate a higher price of corn in the near future, then this would cause a(n)
A. rightward shift in the current supply of corn.
276. Which of the following will not cause the supply curve to shift?
A. a change in the costs of resources needed to produce the good
277. Which would cause an increase in the supply curve of cell–phone services?
D. a decrease in a subsidy given to cell-phone service providers

3-126
278. All of the following would affect the position of the supply curve for cranberries, except
the
D. development of a new pest control for cranberries.
279. A leftward shift of the supply curve for oil in the United States is most likely to result from
A. a decrease in the fees that oil companies must pay for drilling licenses.
3-127
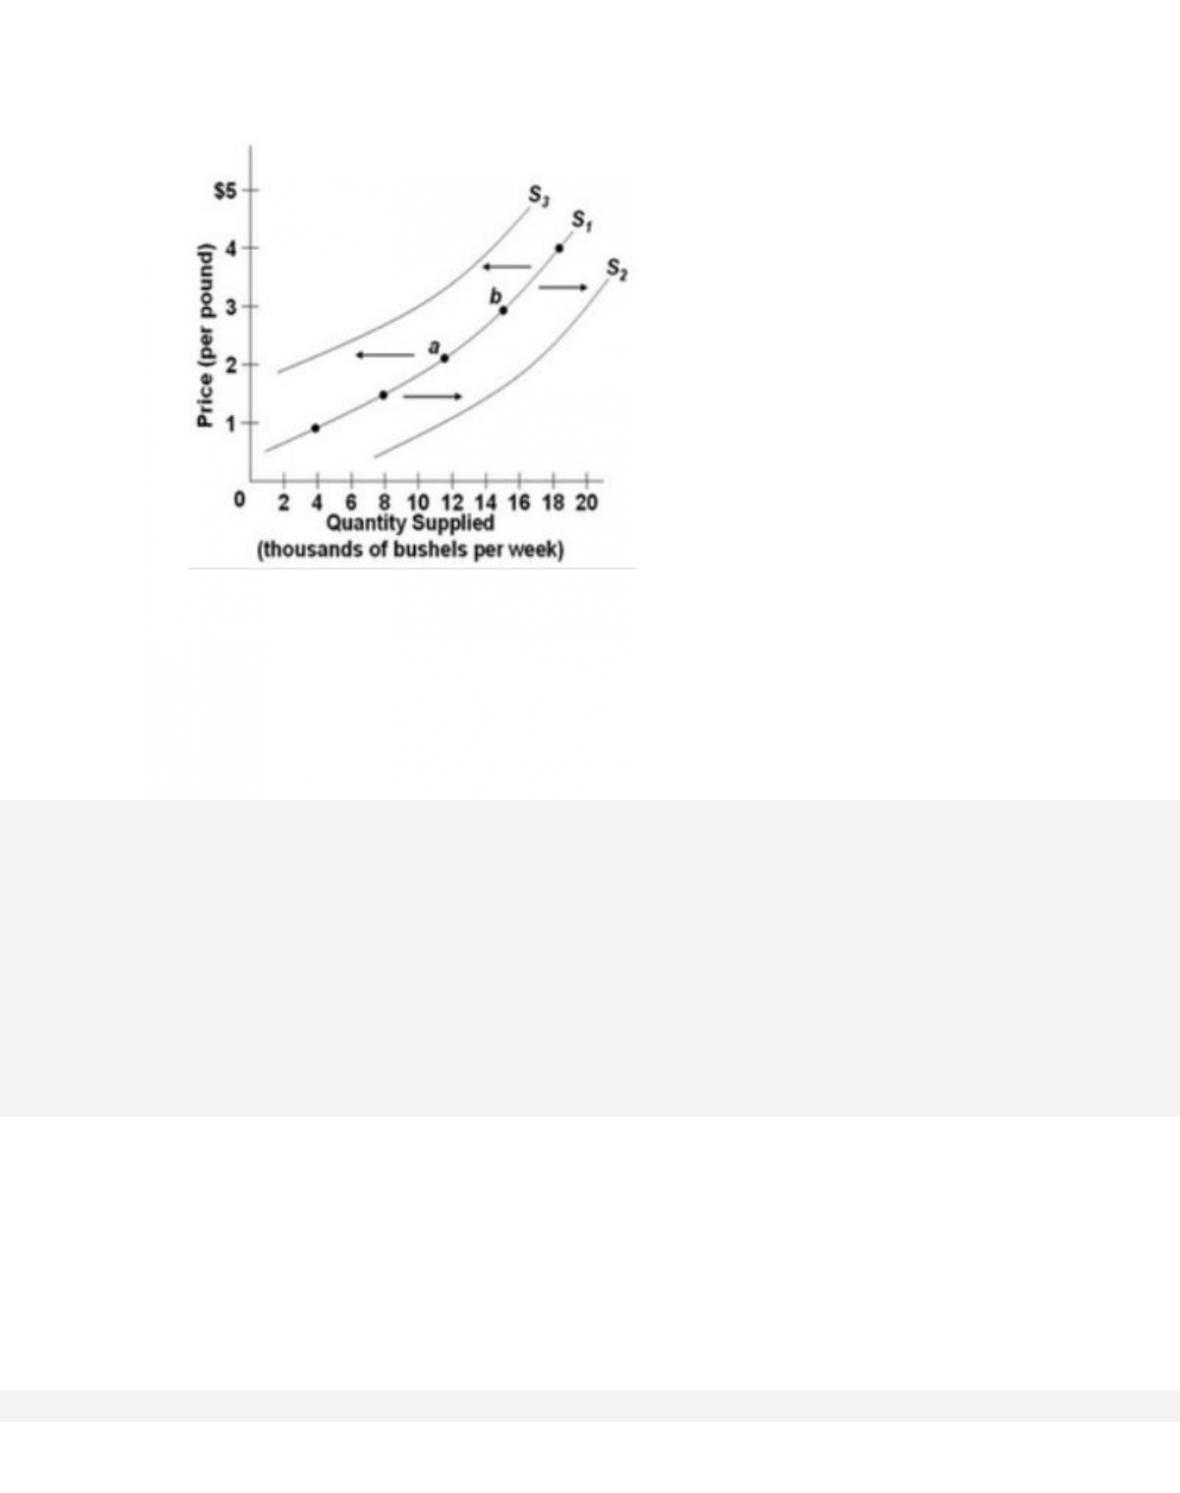
280.
Refer to the figure above, which shows three supply curves for corn. Which of the following
would cause the supply of corn to shift from S1 to
S2?
A. an increase in the price of fertilizer
3-128
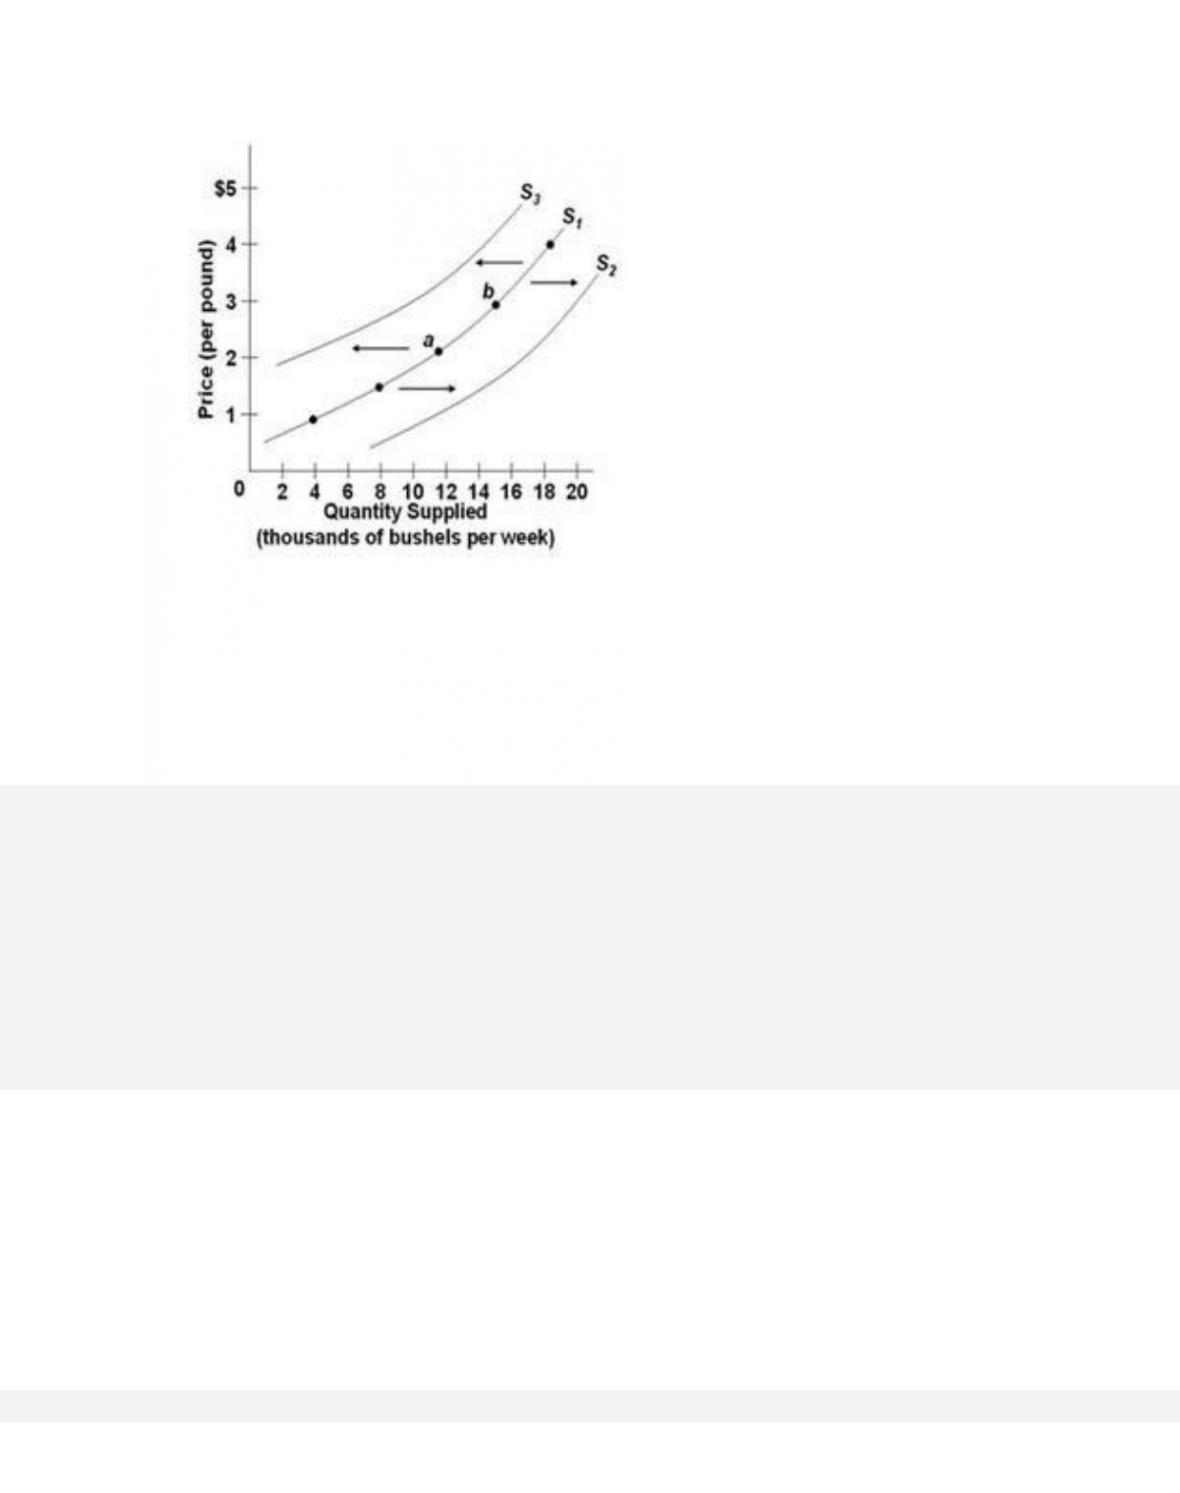
281.
Refer to the diagram above, which shows three supply curves for corn. Which of the following
would cause the supply of corn to shift from S1
to S3?
A. a decrease in the cost of equipment used in corn farming
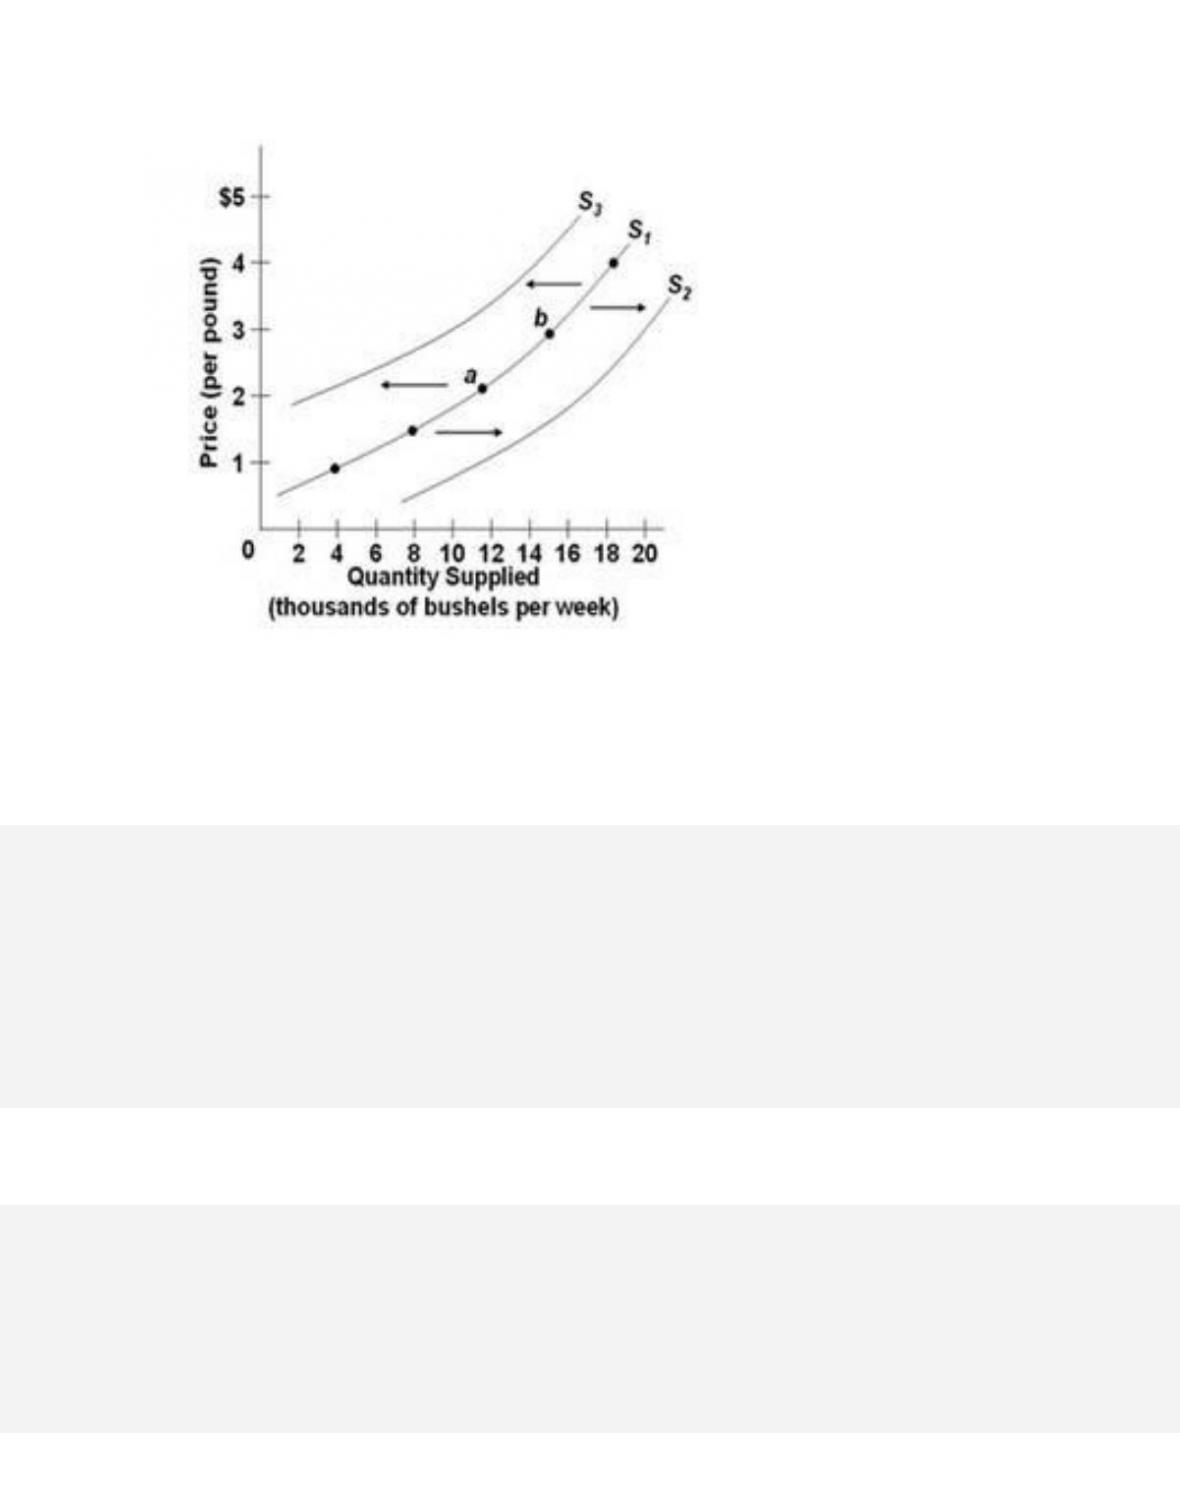
282.
Refer to the diagram above, which shows three supply curves for corn. A movement from point
a to point b is caused by a change in the
A. price of resources used to produce corn.
283. Which of the following would cause a leftward shift in the supply curve for car washes?
A. an increase in the number of cars in the city

3-130
Copyright © 2018 McGraw-Hill Education. All rights reserved. No reproduction or distribution without the prior
written consent of McGraw-Hill Education.
A c c e s s i b i l i t y :
Keyboard Navigation
Blooms: Understand
Diffic ulty:
02 Medium
Learning Objective: 03–03 Describe supply and explain how it can change.
Test Bank: II
To pi c:
Supply
284. A fall in the price of milk, used in the production of ice cream, will
A. decrease the supply of ice cream.
285. Plastics manufacturers can make either toys or plastic containers. If the prices and
profitability of plastic toys increase, then the
A. demand for plastic containers will decrease.
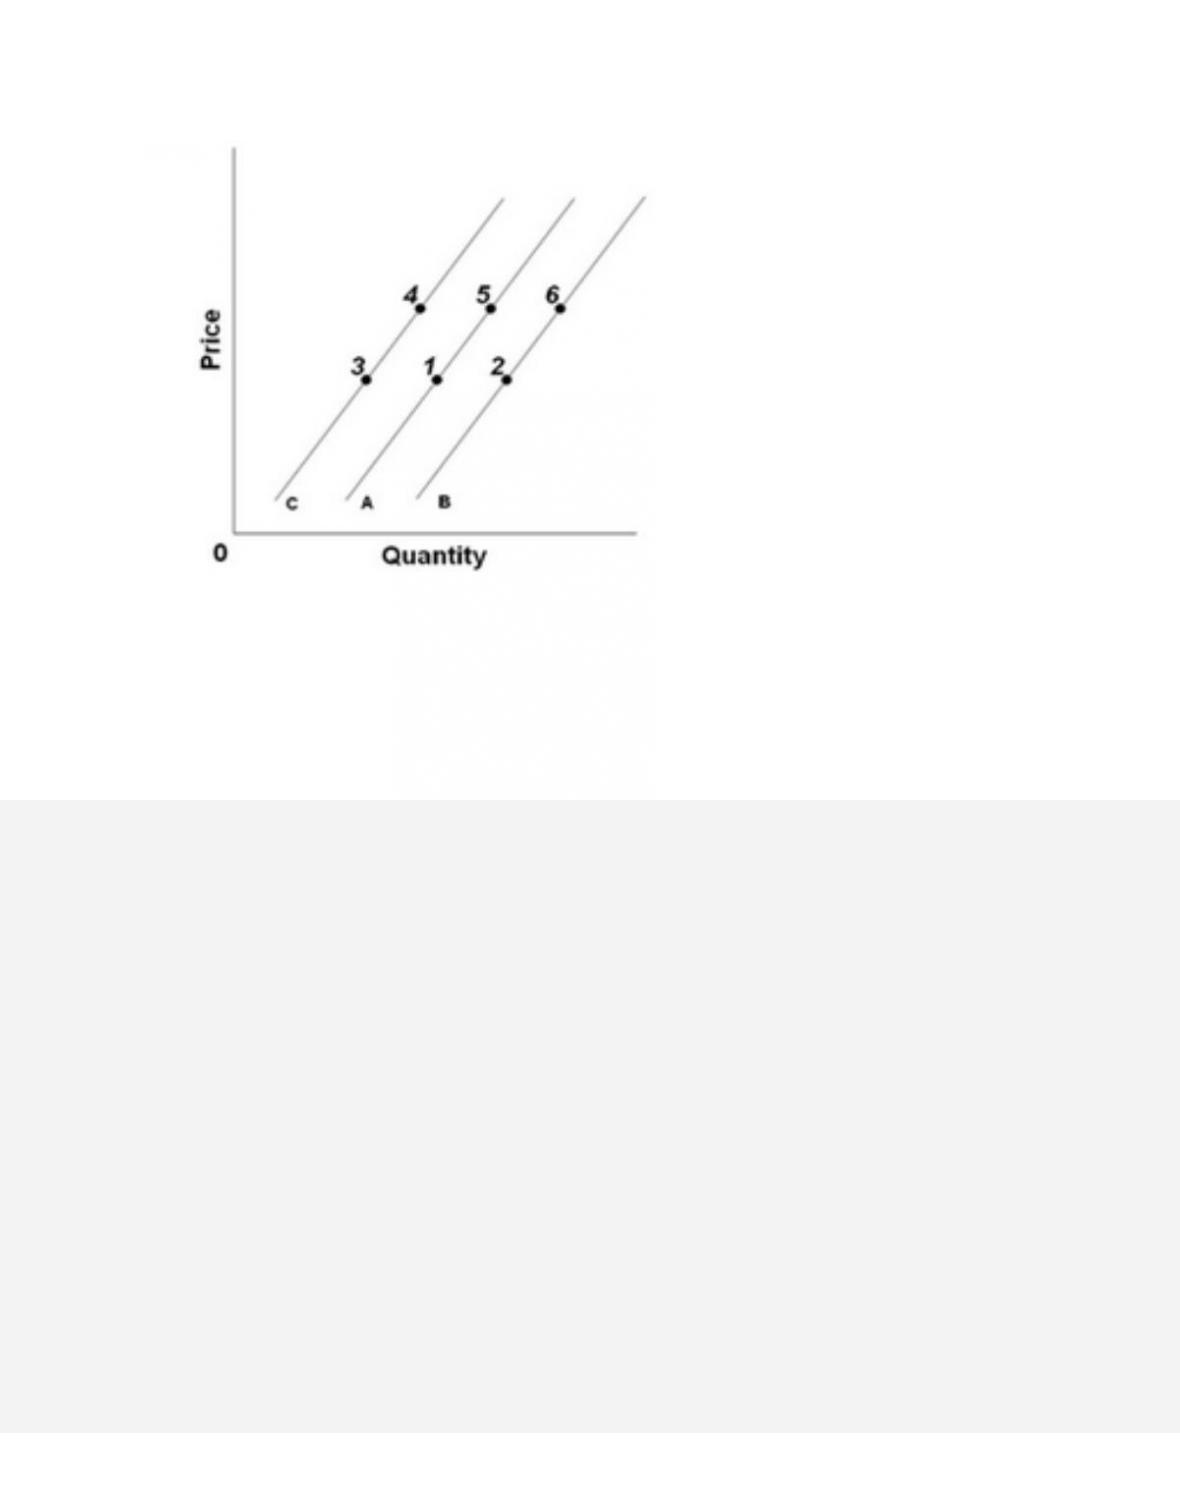
286.
Refer to the above graph. An increase in price, other factors constant, would cause a change
from
A. point 5 to point 1.
B. point 4 to point 5.
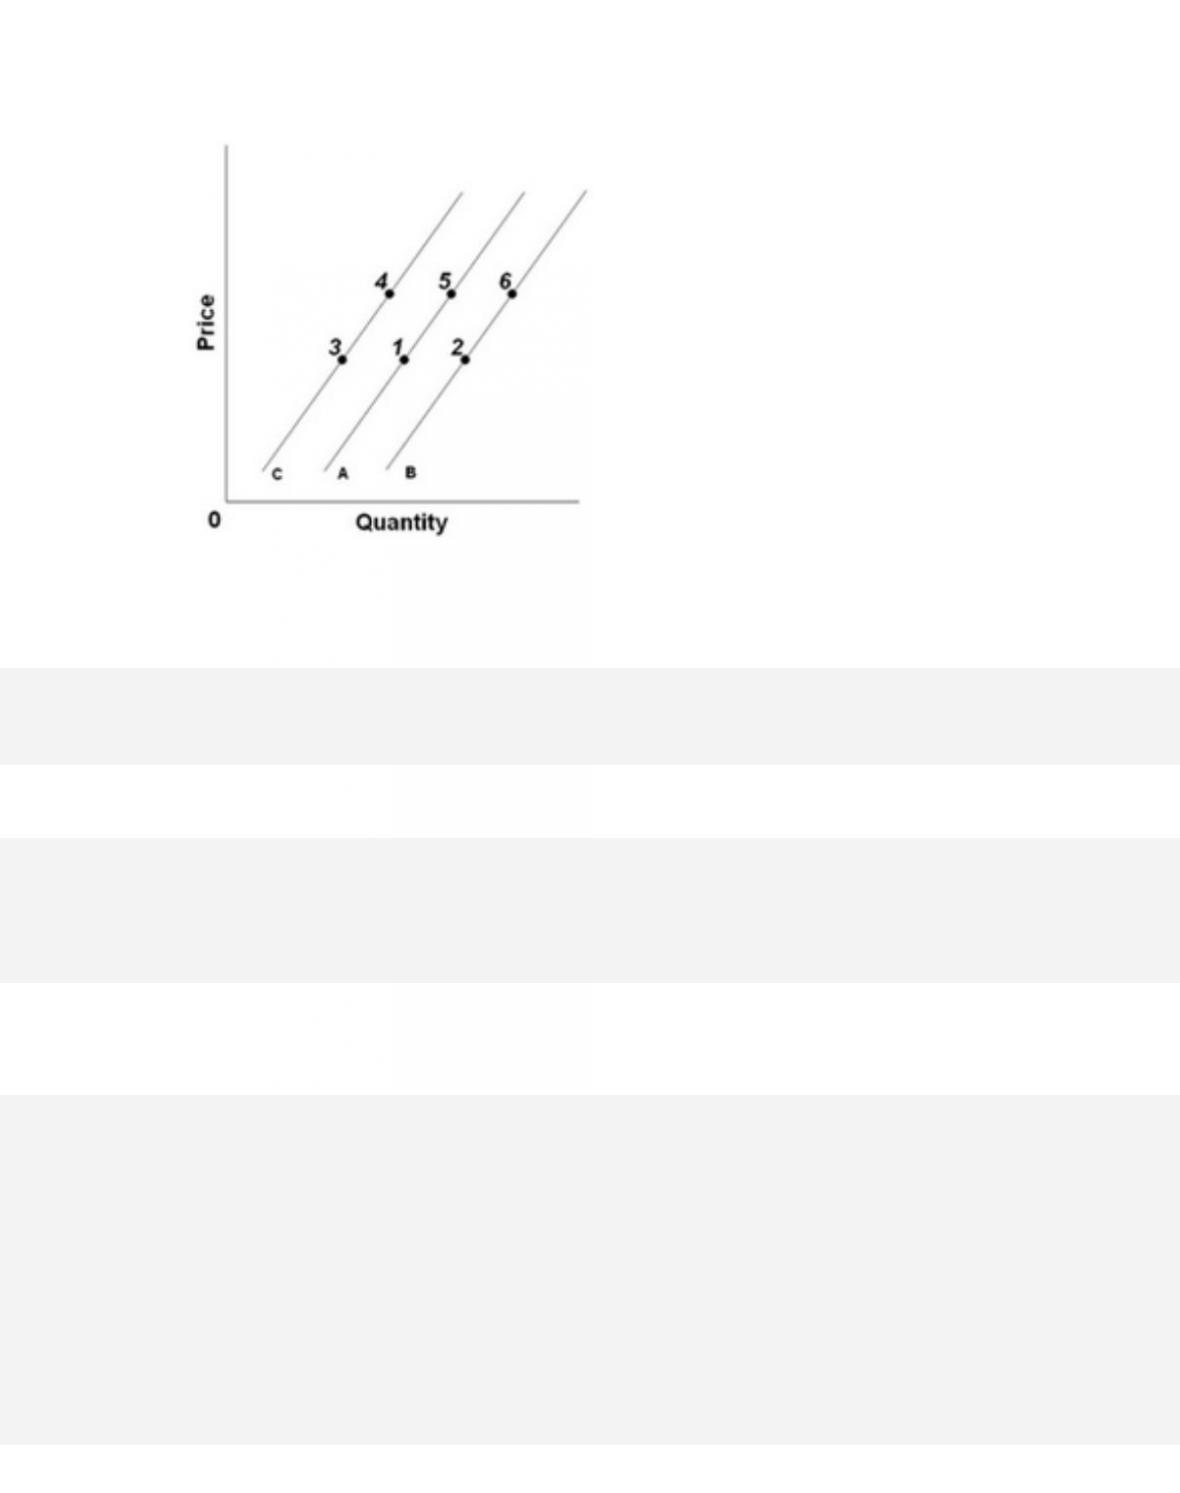
287.
Refer to the above graph. A decrease in supply would best be reflected by a change from
D. point 3 to point 6.
288. There is a shortage in a market for a product when
A. the current price is higher than the equilibrium price.

3-133
Copyright © 2018 McGraw-Hill Education. All rights reserved. No reproduction or distribution without the prior
written consent of McGraw-Hill Education.
equilibrium.
Test Bank: II
To pi c:
Market Equilibrium
289. There is a surplus of tomatoes in the market. This implies that
D. quantity demanded is more than quantity supplied.
290. A market for a product reaches equilibrium when
A. the actual quantity bought by buyers equals actual quantity sold by sellers.
291. If there was initially a shortage in the market for a product, then
A. sellers will drive the price down.

3-134
Copyright © 2018 McGraw-Hill Education. All rights reserved. No reproduction or distribution without the prior
written consent of McGraw-Hill Education.
A c c e s s i b i l i t y :
Keyboard Navigation
Blooms: Understand
Diffic ulty:
02 Medium
Learning Objective: 03–04 Relate how supply and demand interact to determine market
equilibrium.
Test Bank: II
To pi c:
Market Equilibrium
292. In competitive markets, a surplus or shortage will
A. never exist because the markets are always at equilibrium.
293. If the market price is above the equilibrium price,
D. producers will make extremely high profits.
294. The “dynamic pricing” model used by the ride-sharing firm Uber, along with a few other
firms, illustrates which of the following?
3-135
Copyright © 2018 McGraw-Hill Education. All rights reserved. No reproduction or distribution without the prior
written consent of McGraw-Hill Education.
A. When there is shortage in a market, the equilibrium price will rise.
B. Once the equilibrium price is reached, it will remain there for at least several days.
C. Since actual quantity bought always equals actual quantity sold, the market is always at
equilibrium.
D. When there is surplus in a market, the equilibrium price will rise.
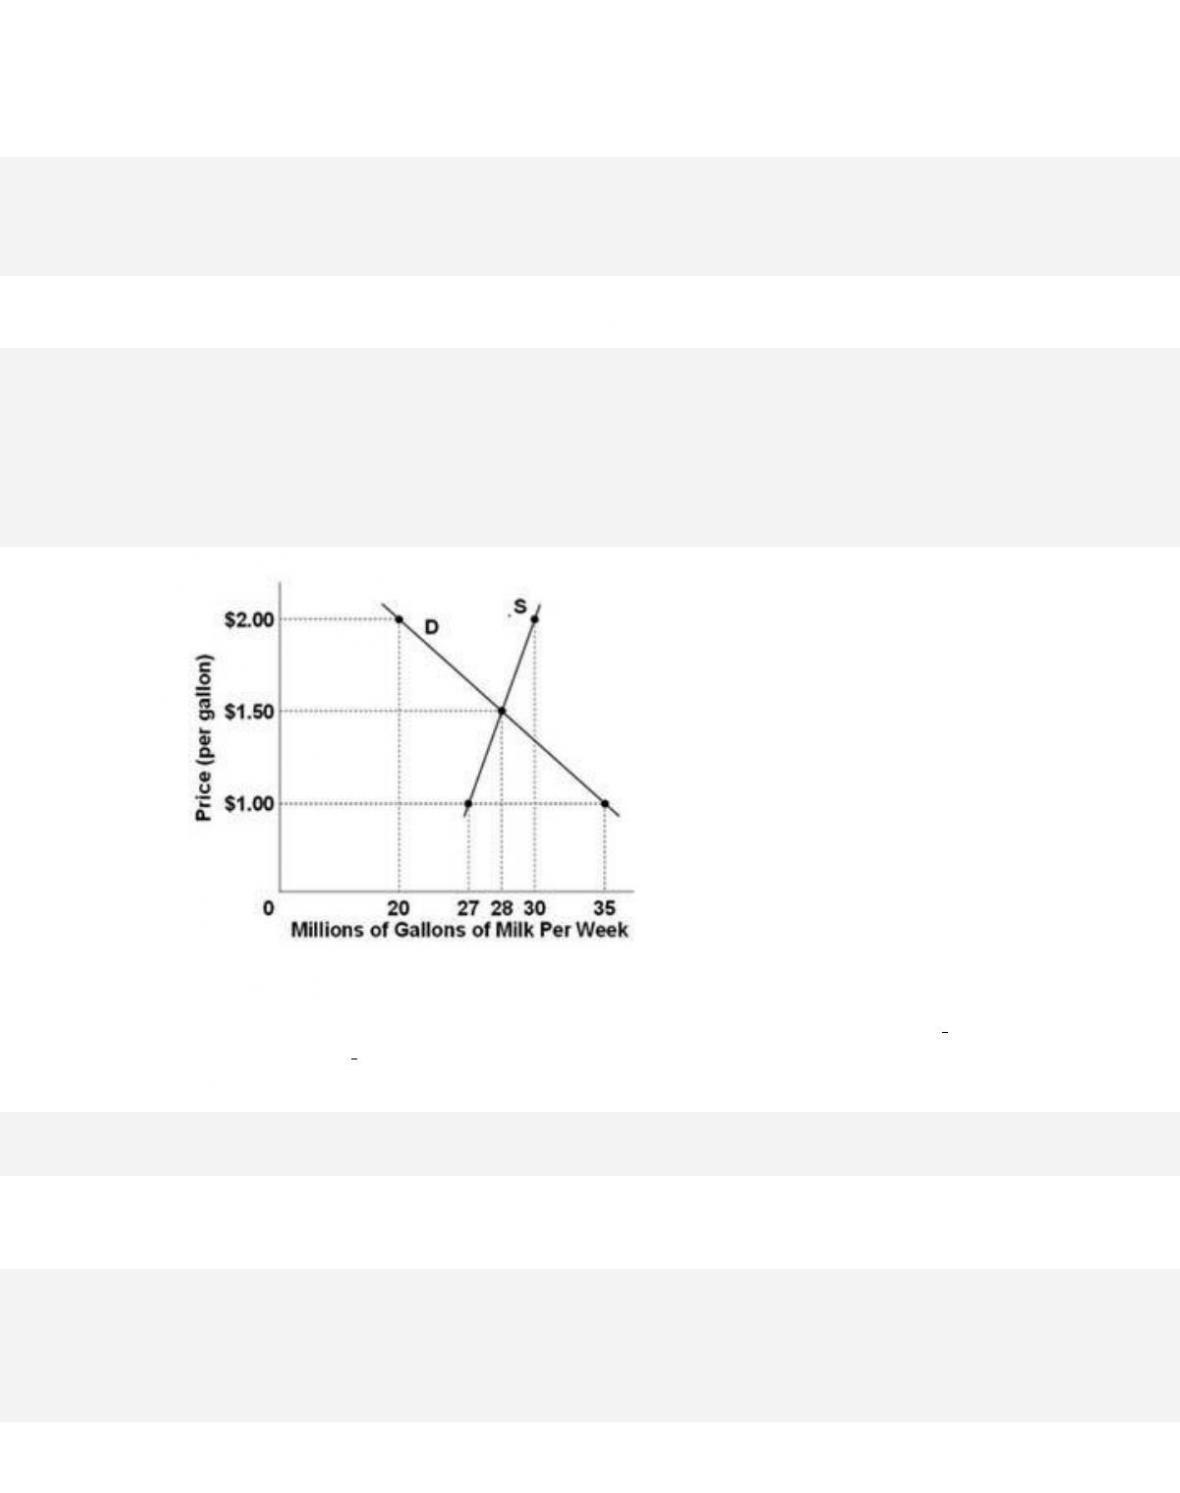
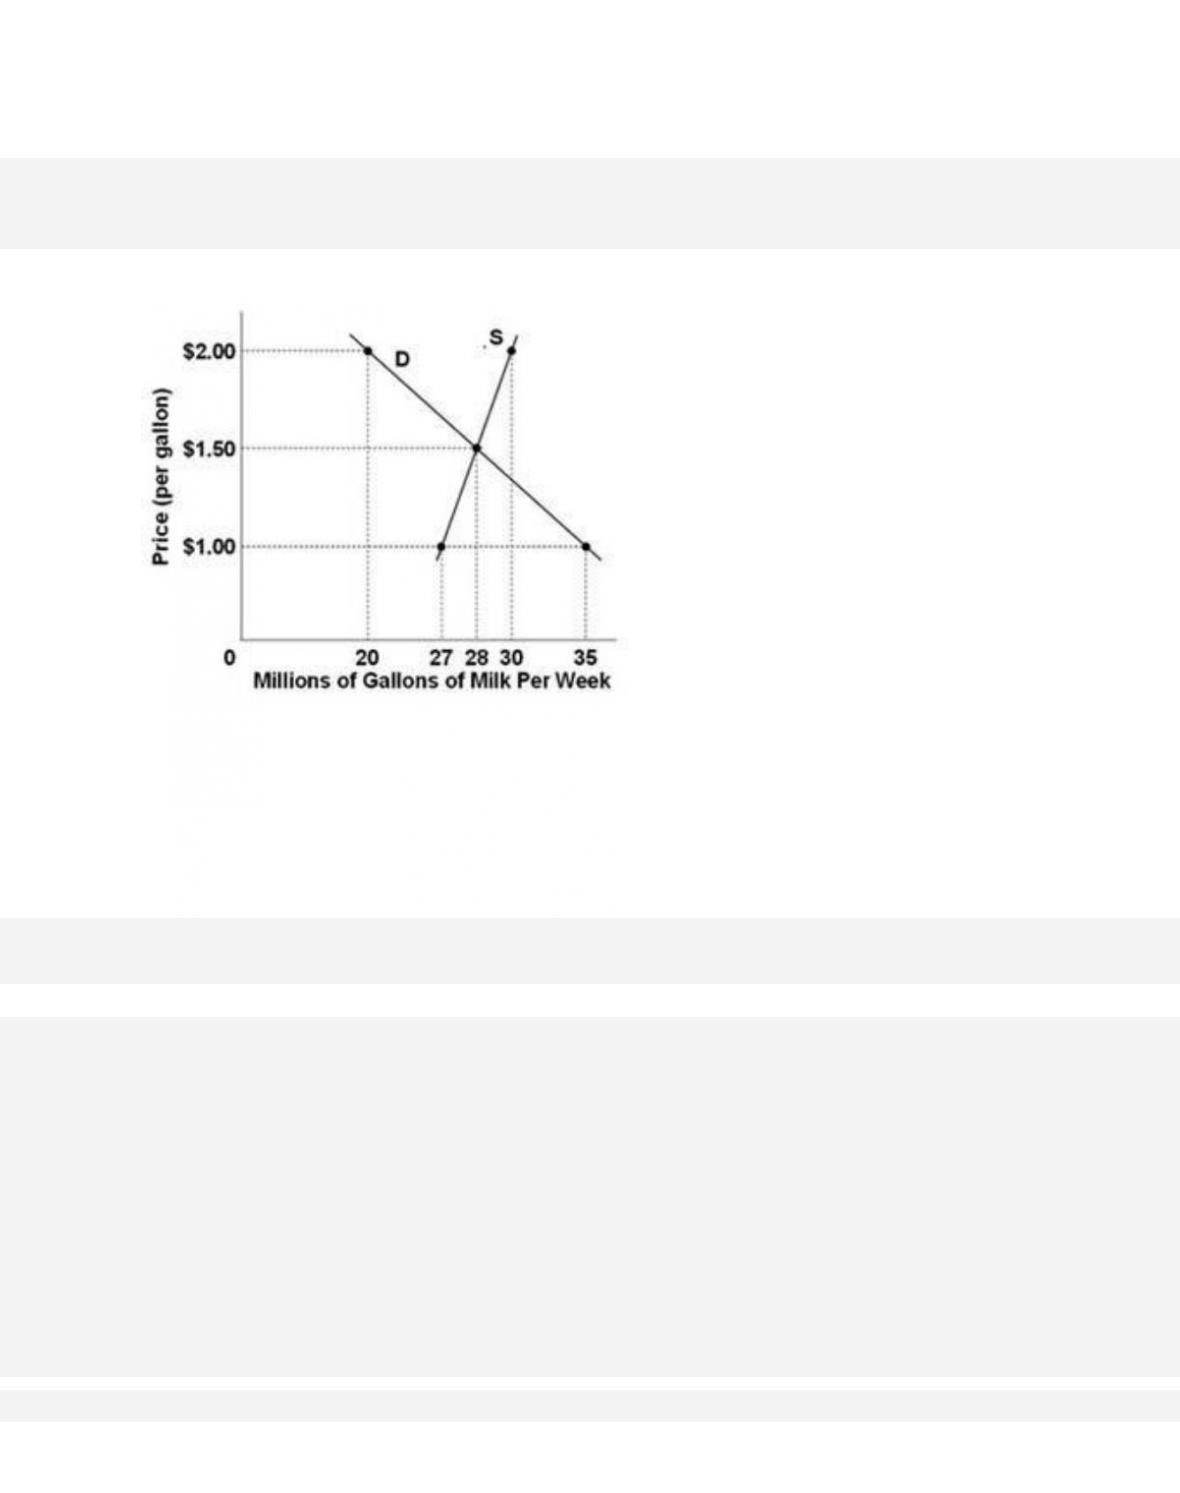
295.
Refer to the above diagram for the milk market. In this market, the equilibrium price is and
equilibrium quantity is .
C. $28 per gallon; 150 million gallons
D. $1.00 per gallon; 35 million gallons
3-136
Copyright © 2018 McGraw-Hill Education. All rights reserved. No reproduction or distribution without the prior
written consent of McGraw-Hill Education.
Learning Objective: 03–04 Relate how supply and demand interact to determine market
equilibrium.
Test Bank: II
To pi c:
Market Equilibrium
296.
Refer to the above diagram for the milk market. If the price were $2 per gallon, then there would
be a
A. shortage of 20 million gallons.
B. shortage of 10 million gallons.
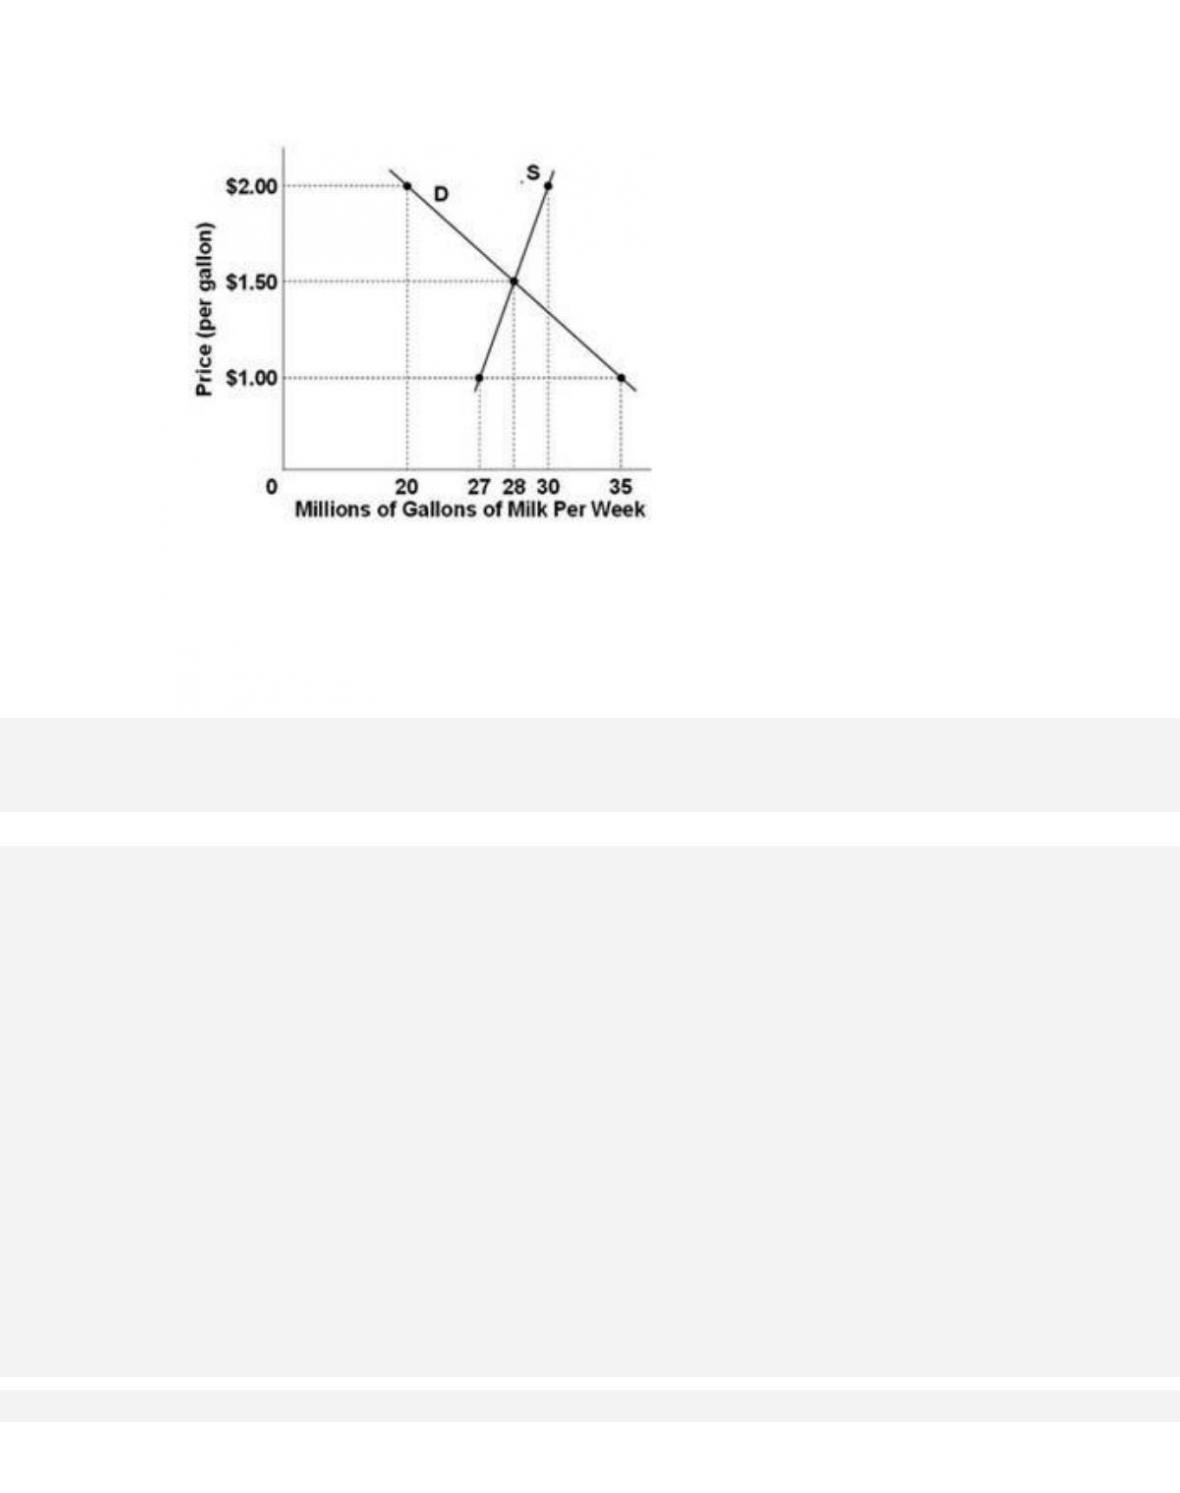
297.
Refer to the above diagram for the milk market. There would be a shortage of milk whenever the
price is
A. higher than $1.50 per gallon.
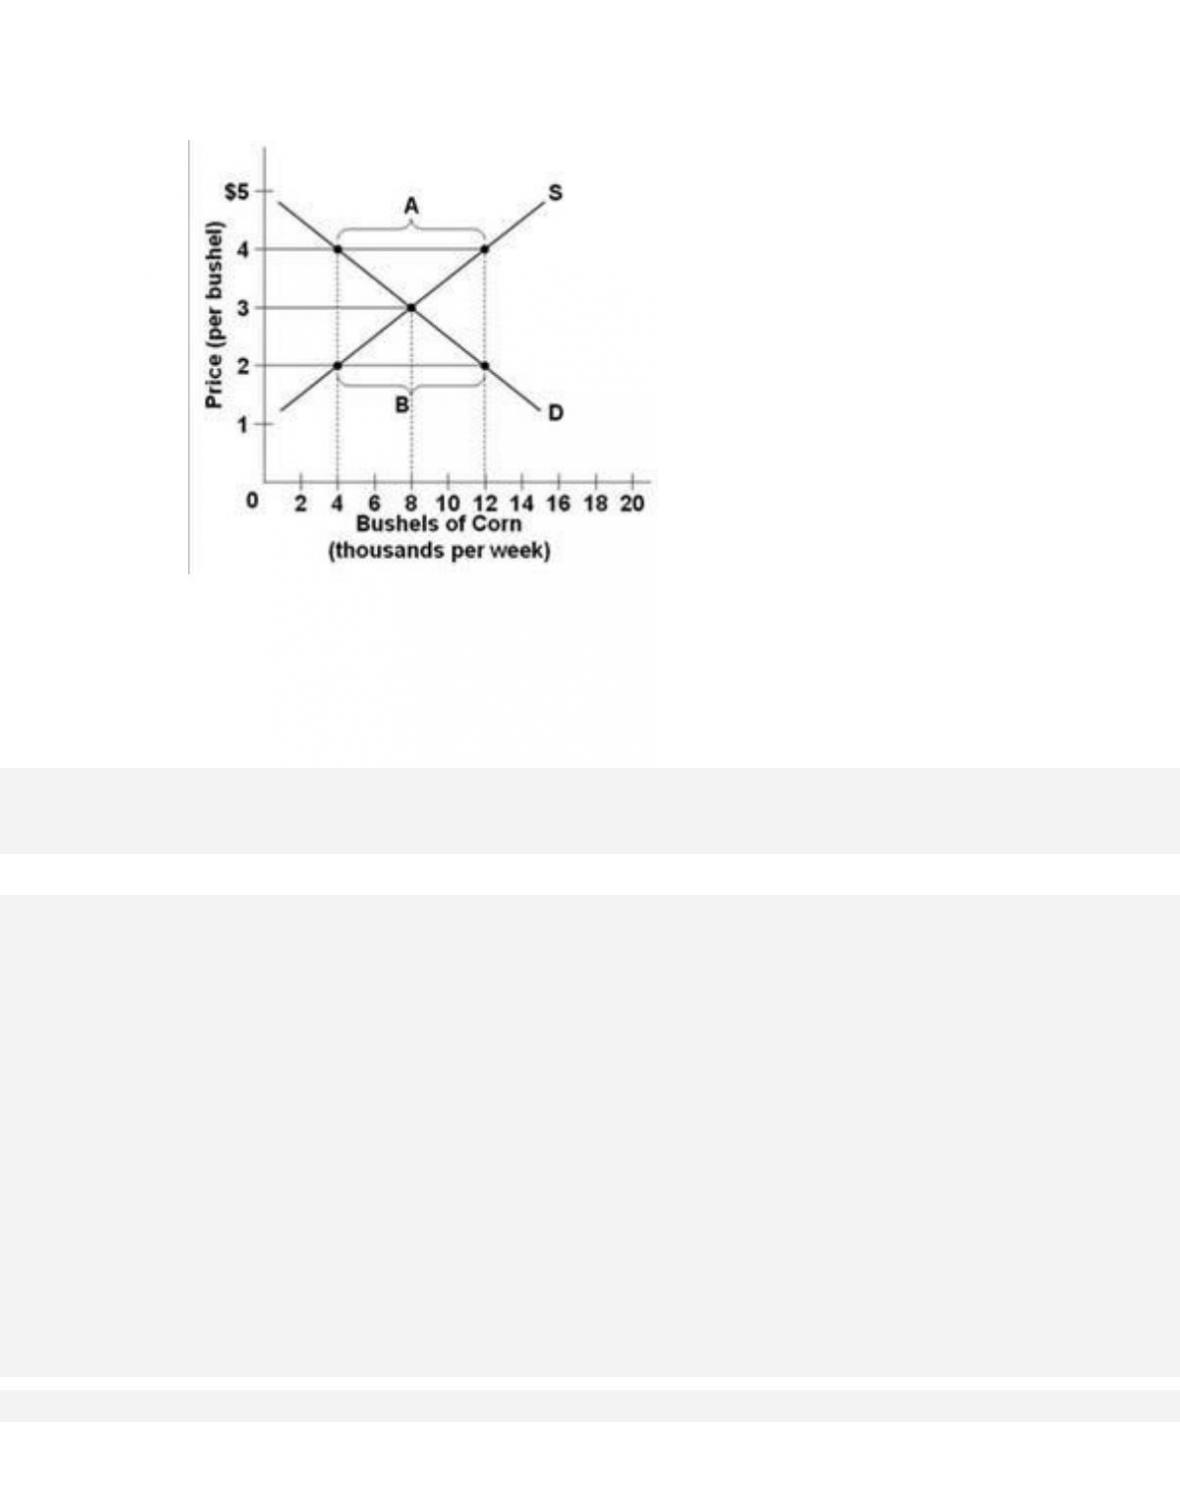
298.
Refer to the above diagram of the market for corn. If the price in this market is at $4 per bushel,
then there will be a
A. surplus and the price will tend to rise.
3-139
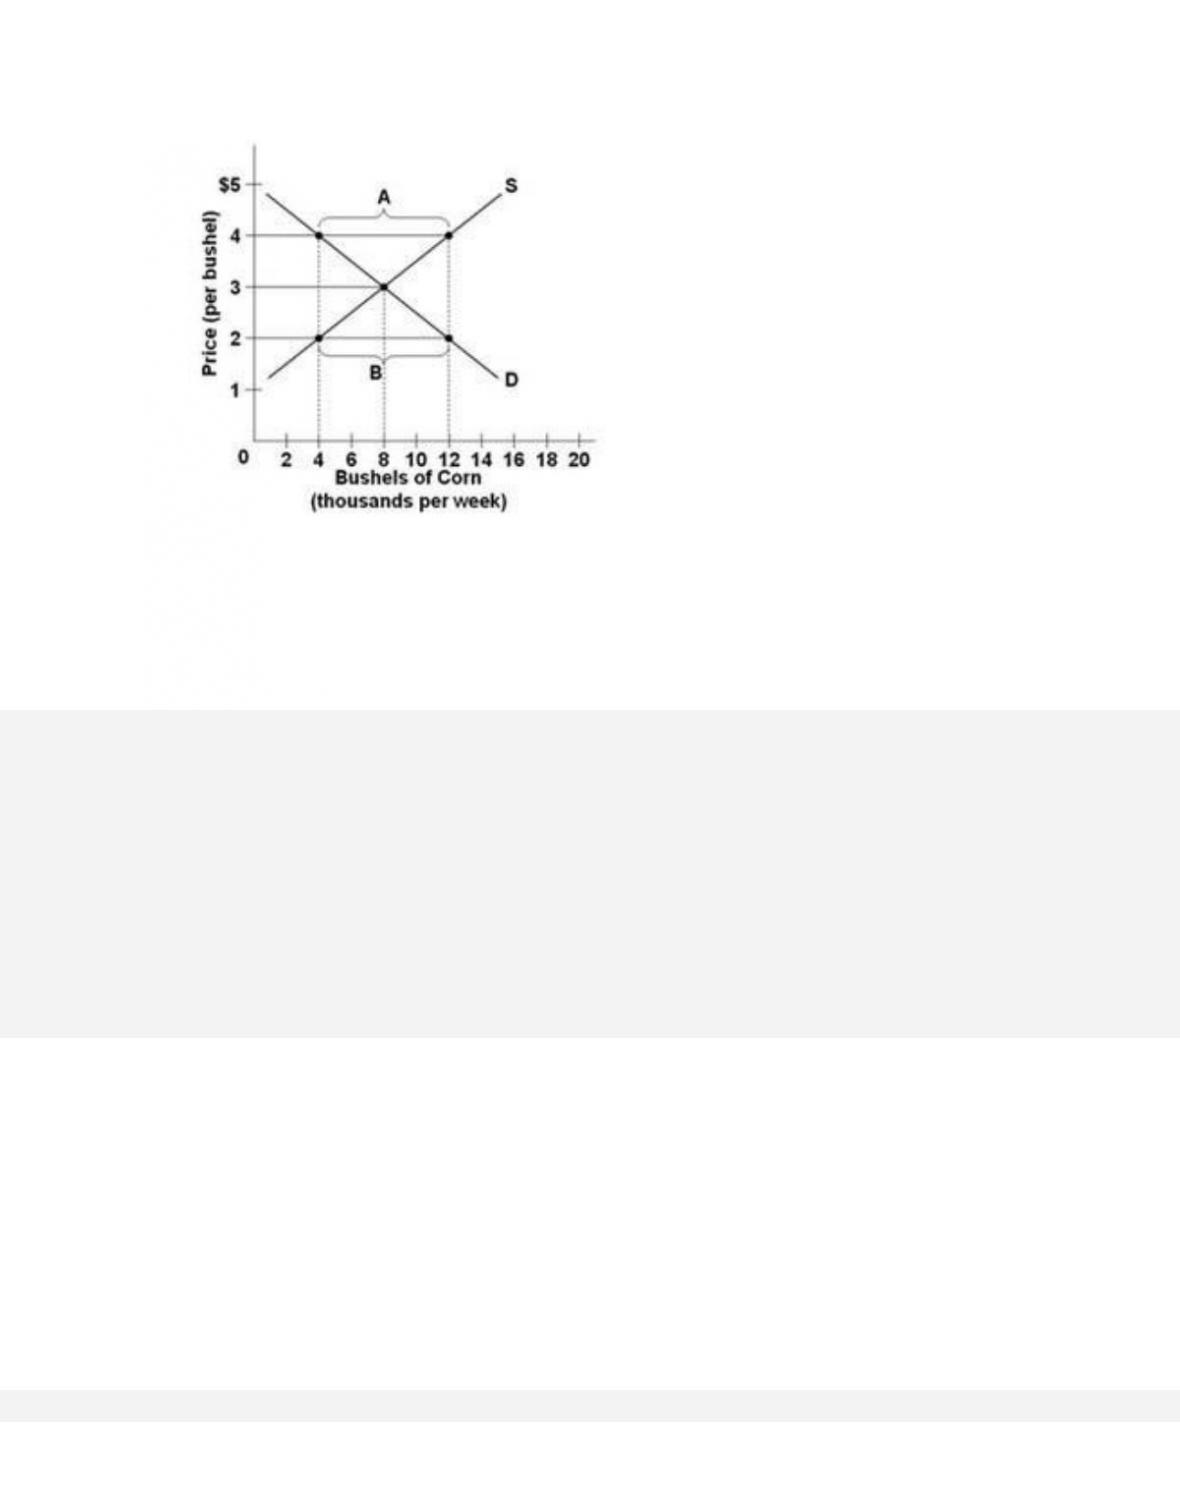
299.
Refer to the above diagram illustrating the market for corn. If the price in this market is fixed at
$2 per bushel, then
A. sellers will not be able to sell all the corn that they intended to sell.
3-140
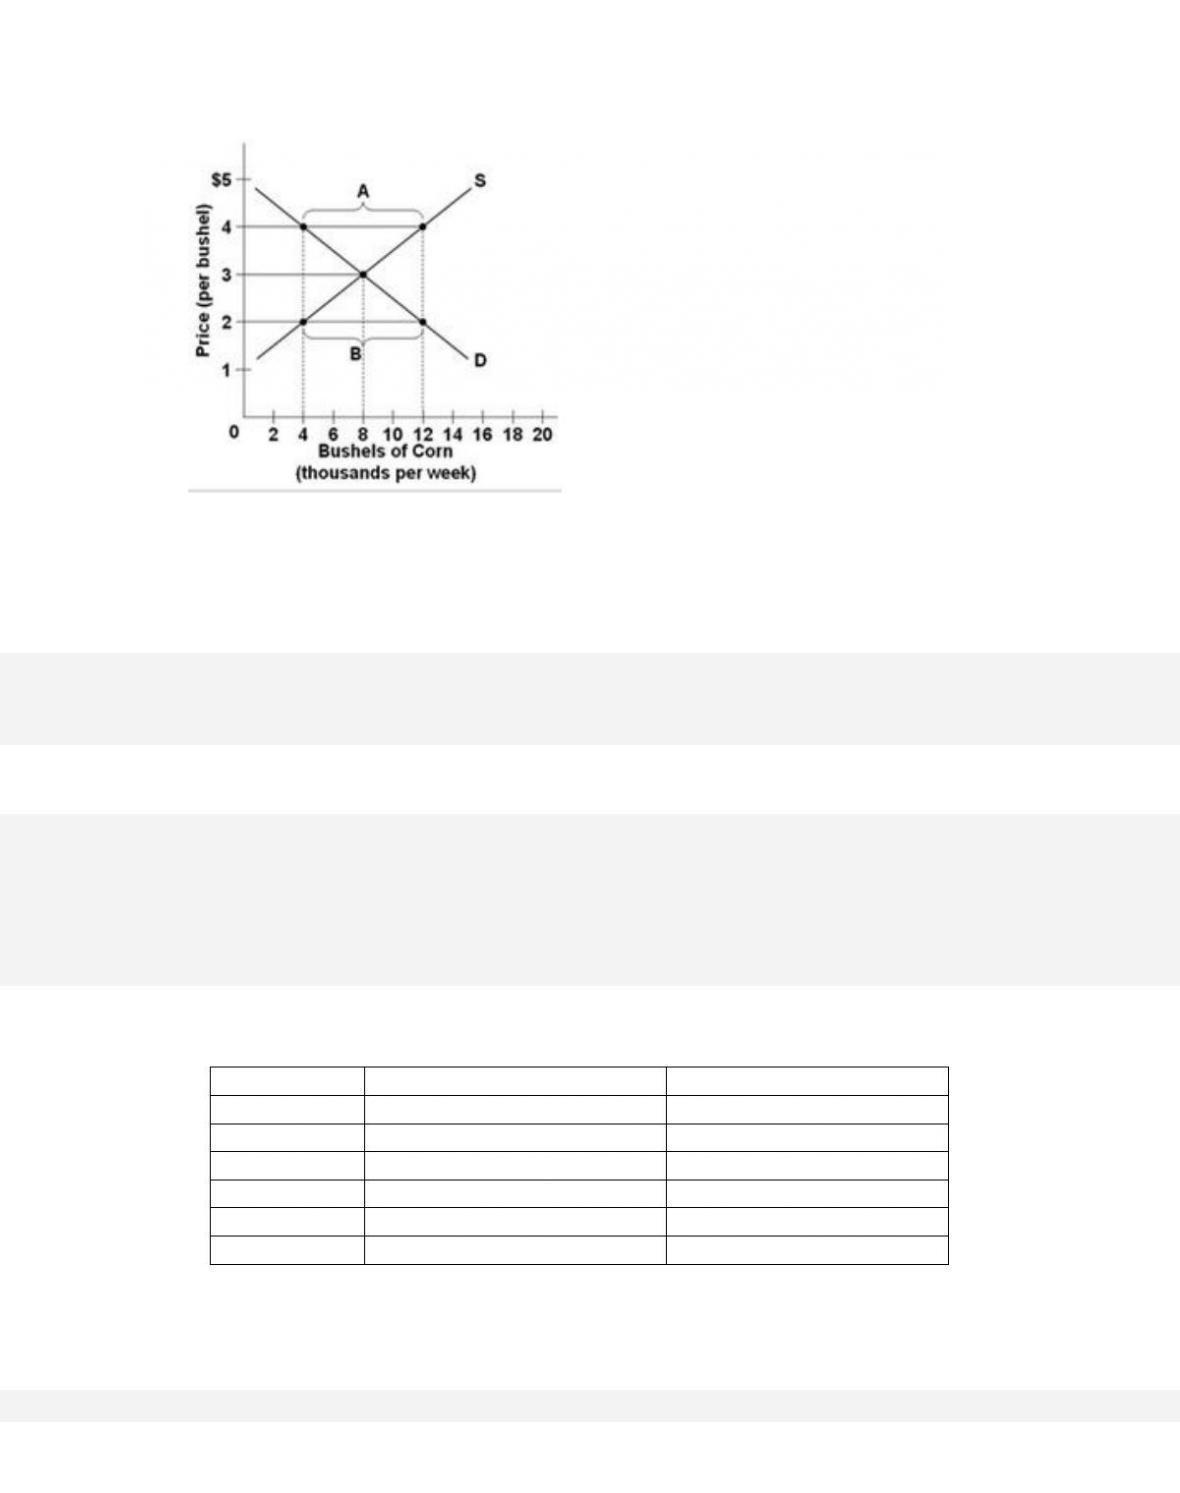
300.
Refer to the above diagram of the market for corn. There will be a surplus of 8 thousand bushels
at the price of
D. $5/bushel.
301.
Price Per Unit
Quantity Demanded Per Year
Quantity Supplied Per Year
$ 5
2,000
0
10
1,800
300
15
1,600
600
20
1,400
900
25
1,200
1,200
30
1,000
1,500