
3-101
216. Producing a good in the least costly way is known as allocative efficiency.
217. A market that achieves productive efficiency is necessarily producing the quantity of goods
most desired by society.
218. A market that is achieving allocative efficiency must also be achieving productive
efficiency.
219. A government tax per unit of output reduces supply.

3-102
Copyright © 2018 McGraw-Hill Education. All rights reserved. No reproduction or distribution without the prior
written consent of McGraw-Hill Education.
TRUE
220. If market demand increases and market supply decreases, the change in equilibrium price is
unpredictable without first knowing the exact magnitudes of the demand and supply changes.
221. A decrease in supply of X increases the equilibrium price of X, which reduces the demand
for X and automatically returns the price of X to its initial level.
222. In a competitive market, every consumer willing to pay the market price can buy a product
and every producer willing to sell the product at that price can sell it.

3-103
Copyright © 2018 McGraw-Hill Education. All rights reserved. No reproduction or distribution without the prior
written consent of McGraw-Hill Education.
A c c e s s i b i l i t y :
Keyboard Navigation
Blooms: Understand
Diff iculty:
02 Medium
Learning Objective: 03–04 Relate how supply and demand interact to determine market
equilibrium.
Test Bank: I
Topic:
Market Equilibrium
223. A price floor in a competitive market will result in persistent shortages of a product.
224. A ceiling price in a competitive market will result in persistent surpluses of a product.
Multiple Choice Questions
225. When economists describe “a market,“ they mean
A. a place where stocks and bonds are traded.

3-104
Copyright © 2018 McGraw-Hill Education. All rights reserved. No reproduction or distribution without the prior
written consent of McGraw-Hill Education.
A c c e s s i b i l i t y :
Keyboard Navigation
Blooms: Understand
Diff iculty:
02 Medium
Learning Objective: 03–01 Characterize and give examples of markets.
Test Bank: II
Topi c:
Markets
226. All markets involve the following elements, except
A. demand or buyers.
227. When high-school and college graduates apply for jobs in the labor markets,
A. job applicants are the “buyers” while employers are the “sellers.”
228. The market demand schedule or curve for a product shows the relationship between how
much of the product buyers are willing and able to buy and the
D. available supply of the product.

3-105
229. When economists speak of “demand” in a particular market, they refer to
D. how much of an item buyers want to buy at a given price.
230. Other things being equal, the law of demand suggests that as
A. the demand for iPads increases, this will cause the price to increase.
231. Which of the following is consistent with the law of demand?

3-106
D. A decrease in the price of egg rolls causes a decrease in the quantity of egg rolls demanded.
232. In understanding and analyzing “demand,” we focus on how much of a product the buyers
are
A. willing and wanting to buy.
233. The following are explanations of the Law of Demand, except
D. substitution effect.
234. A higher price reduces the quantity demanded for a product because
A. the purchasing power of individuals increases.

3-107
Copyright © 2018 McGraw-Hill Education. All rights reserved. No reproduction or distribution without the prior
written consent of McGraw-Hill Education.
B. the financial assets of individuals increase.
C. individuals will buy more of the product and less of its substitutes.
D. individuals can afford less of the product and will switch to substitutes.
235. As a result of a fall in the price of gasoline, consumers can afford to buy more gasoline for
more driving trips. This is an illustration of
D. consumer sovereignty.
236. As a result of a decrease in the price of online streaming movies, consumers download
more movies online and buy fewer DVDs. This is an illustration of

237. Which statement best illustrates the concept of diminishing marginal utility?
A. As one consumes more hamburgers per week, one would be willing to pay a higher price for
additional hamburgers.
238. The idea of the Law of Demand, as applied to electric cars, assumes which of the
following to be constant?
239. The horizontal axis of a graph that shows a market demand curve indicates the

3-109
Copyright © 2018 McGraw-Hill Education. All rights reserved. No reproduction or distribution without the prior
written consent of McGraw-Hill Education.
Blooms: Understand
Diff iculty:
02 Medium
Learning Objective: 03–02 Describe demand and explain how it can change.
Test Bank: II
Topi c:
Demand
240. In order to derive a market demand curve from individuals’ demand curves, we add up the
241. The table below shows the weekly demand for hamburger in a market where there are just
three buyers.
Price
Buyer 1 Qd 1
Buyer 2 Qd 2
Buyer 3 Qd 3
$6
7
4
6
5
9
7
8
4
15
10
12
3
21
15
16
At a price of $6, the weekly market quantity demanded for hamburger is

3-110
Copyright © 2018 McGraw-Hill Education. All rights reserved. No reproduction or distribution without the prior
written consent of McGraw-Hill Education.
Test Bank: II
Topi c:
Demand
242. The table below shows the weekly demand for hamburger in a market where there are just
three buyers.
Price
Buyer 1 Qd 1
Buyer 2 Qd 2
Buyer 3 Qd 3
$6
7
4
6
5
9
7
8
4
15
10
12
3
21
15
16
If the price of hamburger falls from $5 to $3, then the weekly market quantity demanded will
243. The table below shows the weekly demand for hamburger in a market where there are just
three buyers.
Price
Buyer 1 Qd 1
Buyer 2 Qd 2
Buyer 3 Qd 3
$6
7
4
6
5
9
7
8
4
15
10
12
3
21
15
16
Suppose now that there are 200 buyers in a market, each with a demand schedule identical to
Buyer 2 in the table above (no one is similar to either Buyer 1 or Buyer 3). What would the
weekly quantity of hamburger demanded in the market at a price of $4 be?

244. An increase in the demand for online streaming music indicates that more is
245. When economists say that the demand for a product has decreased, they mean that
A. the demand curve has shifted to the right.

246. An increase in the price of digital cameras will result in a(n)
A. shift of the demand curve for digital cameras to the left.
247. Which of the following is not a determinant of demand for laptop computers?
248. Which of the following factors is a “demand shifter” for new houses?
A. the price of lumber
3-113
Copyright © 2018 McGraw-Hill Education. All rights reserved. No reproduction or distribution without the prior
written consent of McGraw-Hill Education.
Topi c:
Demand
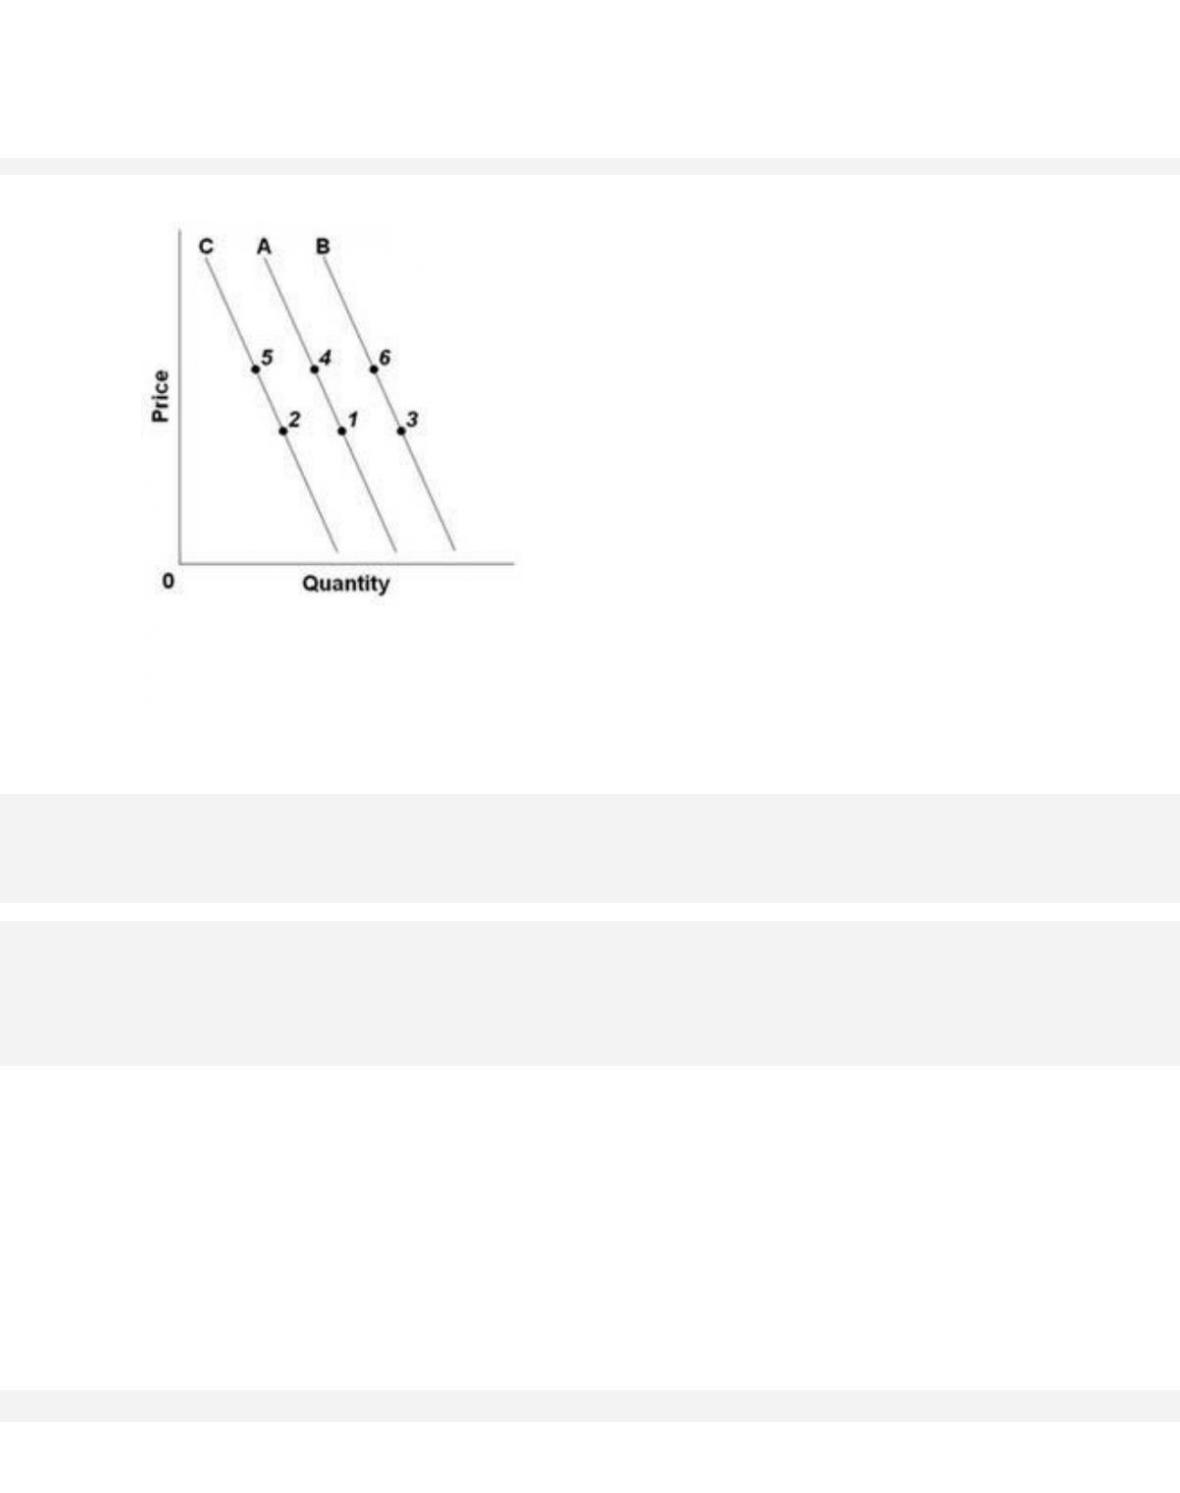
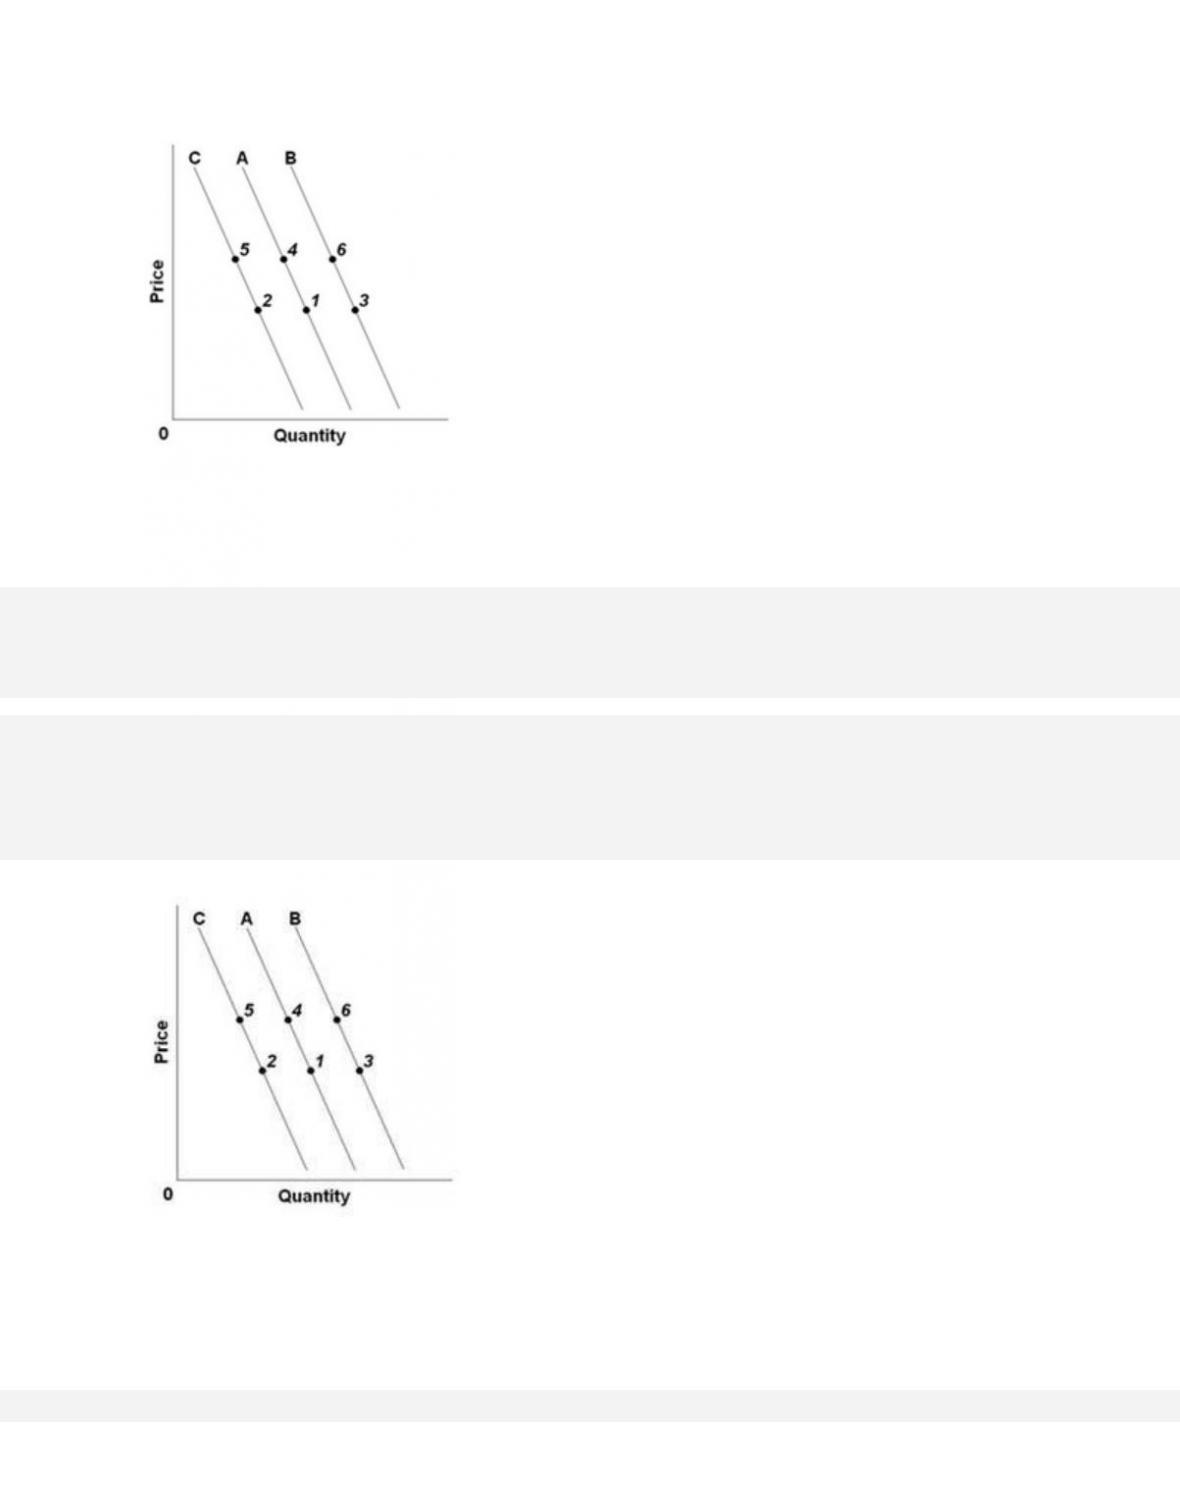
249.
Refer to the above graph with three demand curves. An “increase in quantity demanded” would
be illustrated by a change from
A. point 4 to point 6.
250.
3-114
Refer to the above graph with three demand curves. A “decrease in demand” would be
illustrated as a change from
A. point 1 to point 4.
251.
Refer to the above graph with three demand curves. An increase in price, other factors constant,
would cause a change from

A. point 4 to point 5.
252. Which would be a likely cause of an increase in the demand for pizza?
A. a reduced desire for take-out and fast-food dining
253. Which of the following will not cause a change in the demand for product A?

254. Which of the following goods would most probably be an inferior good?
A. French wines
255. If product Y is an inferior good, a decrease in consumer incomes will
256. For most products, purchases tend to fall with decreases in buyers’ incomes. Such products
are known as
A. inferior goods.
3-117
Copyright © 2018 McGraw-Hill Education. All rights reserved. No reproduction or distribution without the prior
written consent of McGraw-Hill Education.
Topi c:
Demand
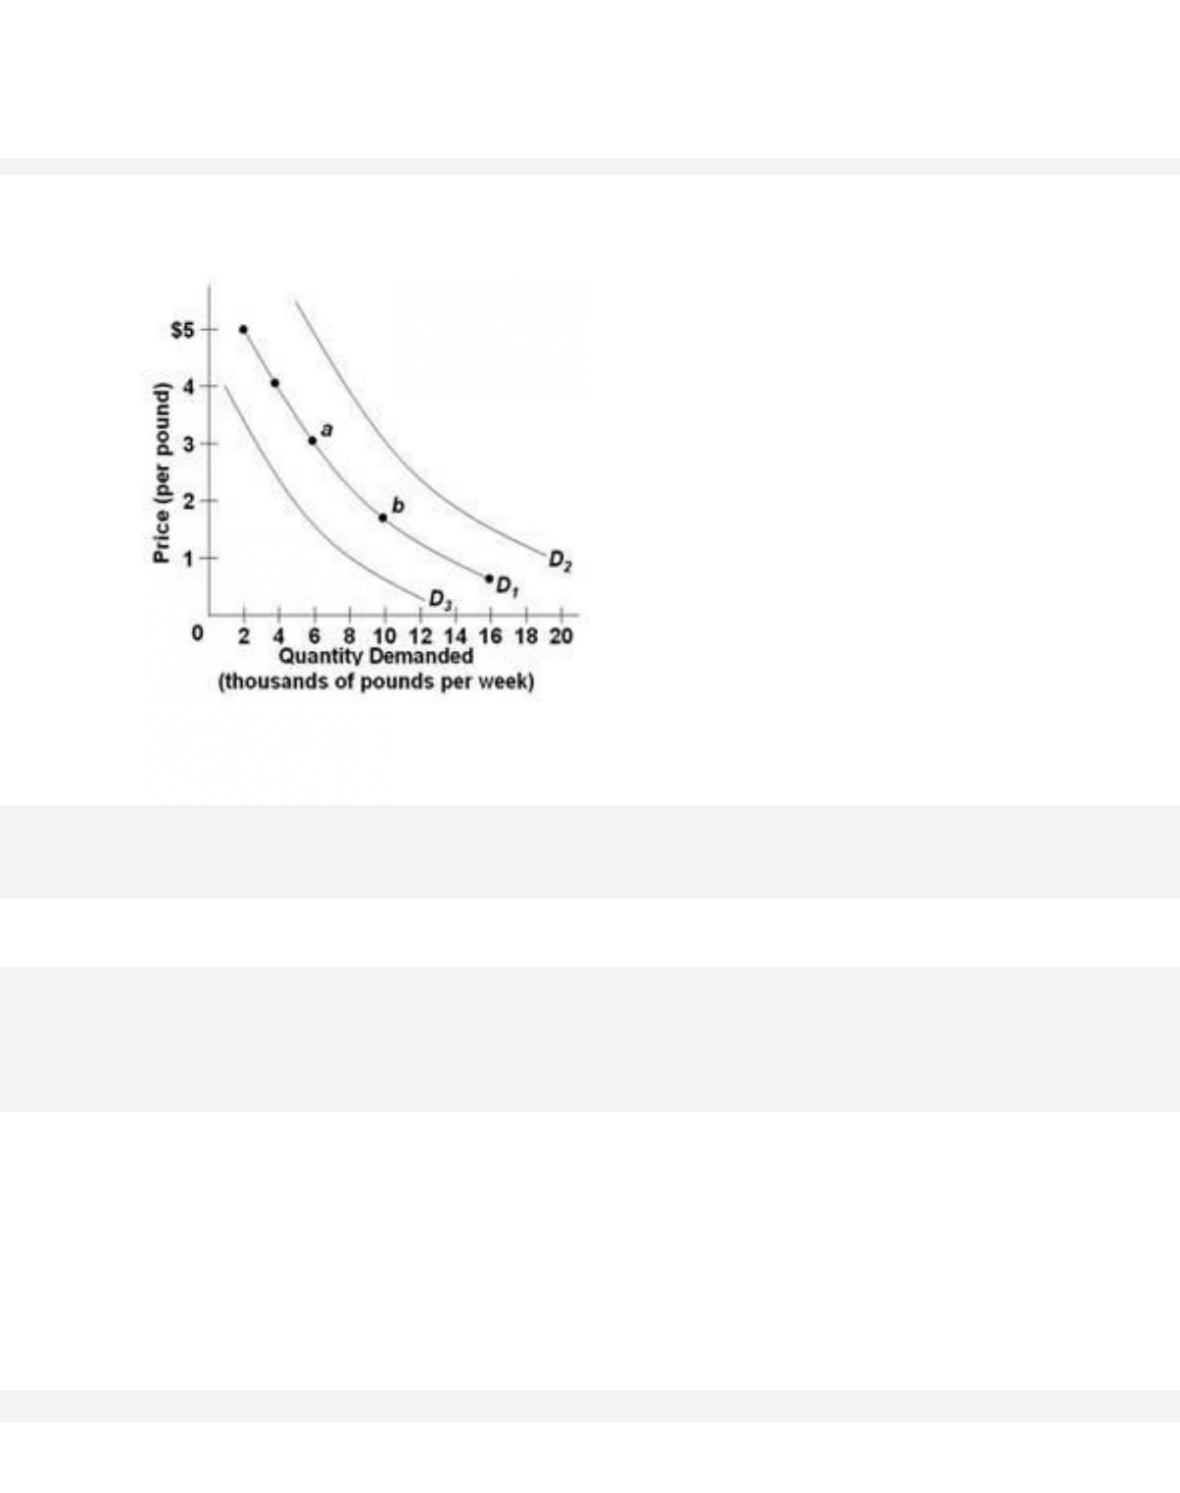
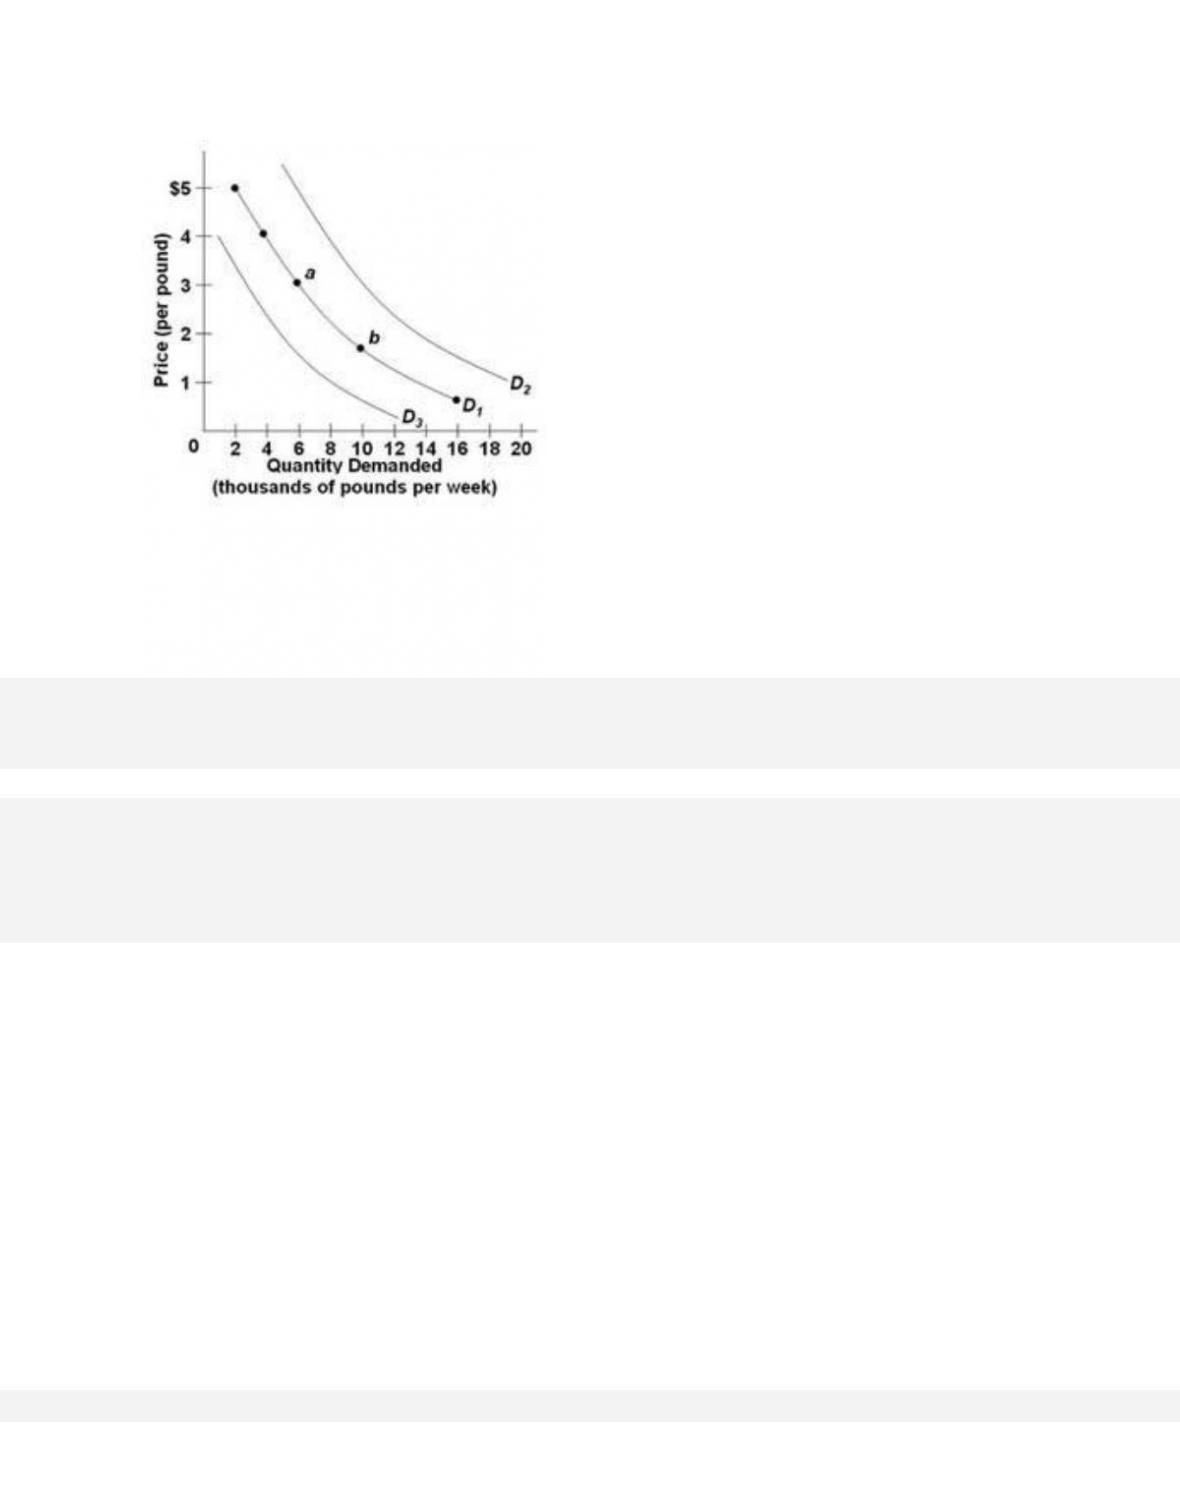
257. The figure below shows three demand curves for coffee.
Which of the following would cause a shift in coffee demand from D1 to D2?
D. a decrease in the price of coffee
258. The figure below shows three demand curves for coffee.
3-118
Which of the following would cause a shift in coffee demand from D1 to D3?
A. a decrease in the cost of producing coffee
259. The figure below shows three demand curves for coffee.
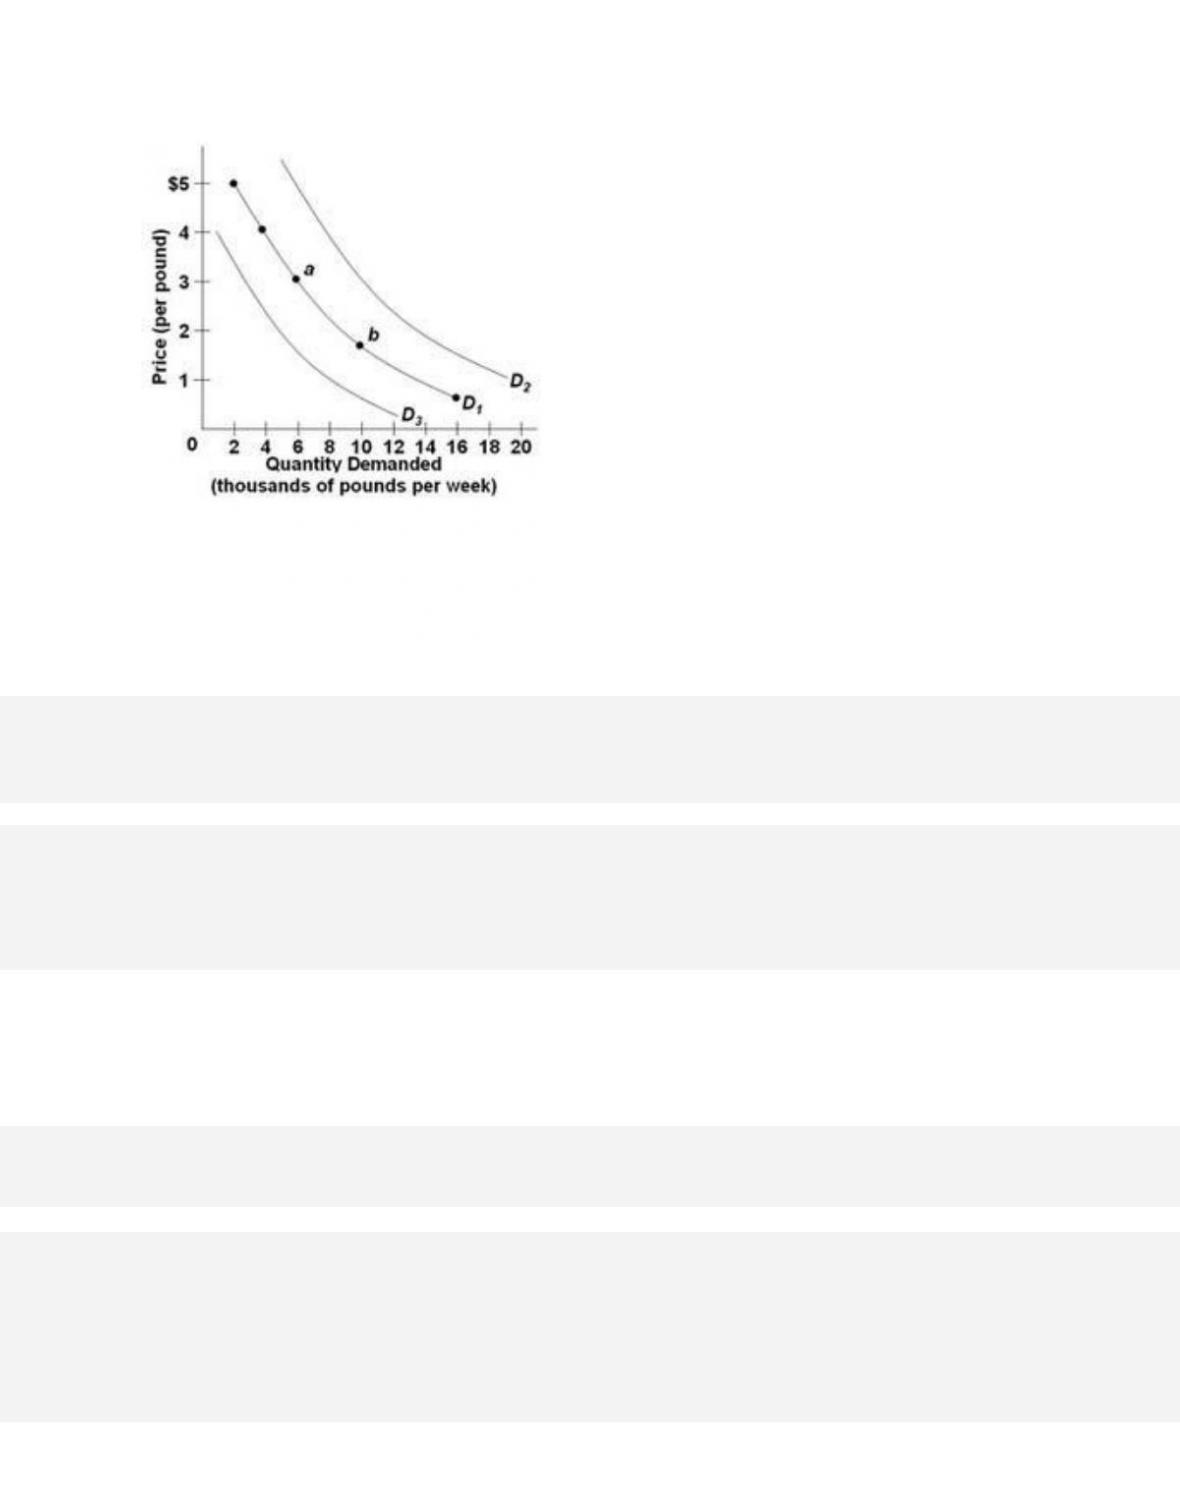
An increase in the price of coffee, other factors constant, would cause a
A. shift from D1 to D3.
260. Suppose that goods A and B are close substitutes. If the price of good A falls, then we
would expect an
A. increase in the demand for A and an increase in the quantity of B demanded.

3-120
Copyright © 2018 McGraw-Hill Education. All rights reserved. No reproduction or distribution without the prior
written consent of McGraw-Hill Education.
Test Bank: II
Topi c:
Demand
261. Which of the following factors will decrease the current demand for a product?
C. a decrease in the current price of a complementary product
D. an increase in the current price of a substitute product
262. Which of the following pairs are not considered to be complementary goods?
C. gasoline and motor oil
D. fertilizer and irrigation systems
263. If the price of gasoline increases significantly, then we’d expect the demand curve for large
trucks and SUVs to
D. not shift, but there will be a movement along that demand curve.