
3-81
Diffic ulty:
02 Medium
171. (Advanced analysis) The demand for commodity X is represented by the equation P = 10 –
0.2Q and supply by the equation P = 2 + 0.2Q. If demand changes from P = 10 – .2Q to P = 7 –
.3Q, we can conclude that
A. demand has increased.
172. (Advanced analysis) The demand for commodity X is represented by the equation P = 10 –
0.2Q and supply by the equation P = 2 + 0.2Q. If demand changes from P = 10 – .2Q to P = 7 –
.3Q, the new equilibrium quantity is
D. 30.
173. (Advanced analysis) The demand for commodity X is represented by the equation P = 10 –
0.2Q and supply by the equation P = 2 + 0.2Q. If demand changes from P = 10 – .2Q to P = 7 –

.3Q, the new equilibrium price is
174. Over time, the equilibrium price of a gigabyte of computer memory has fallen, while the
equilibrium quantity purchased has increased. Based on this we can conclude that
A. decreases in the demand for computer memory have exceeded increases in supply.
175. Suppose that in the clothing market, production costs have fallen, but the equilibrium price
and quantity purchased have both increased. Based on this information we can conclude that
A. the supply of clothing has grown faster than the demand for clothing.

3-83
Copyright © 2018 McGraw-Hill Education. All rights reserved. No reproduction or distribution without the prior
written consent of McGraw-Hill Education.
Diffic ulty:
02 Medium
Learning Objective: 03–05 Explain how changes in supply and demand affect equilibrium
prices and quantities.
Test Bank: I
Top ic:
Changes in Supply, Demand, and Equilibrium
176. (Advanced analysis) The demand for commodity X is represented by the equation P = 100
– 2Q and supply by the equation P = 10 + 4Q. The equilibrium quantity is
177. (Advanced analysis) The demand for commodity X is represented by the equation P = 100
– 2Q and supply by the equation P = 10 + 4Q. The equilibrium price is
178. (Advanced analysis) The demand for commodity X is represented by the equation P = 100
– 2Q and supply by the equation P = 10 + 4Q. If demand changes from P = 100 – 2Q to P = 130
– Q, the new equilibrium quantity is

3-84
Copyright © 2018 McGraw-Hill Education. All rights reserved. No reproduction or distribution without the prior
written consent of McGraw-Hill Education.
A. 15.
B. 20.
C. 24.
D. 32.
179. (Advanced analysis) The demand for commodity X is represented by the equation P = 100
– 2Q and supply by the equation P = 10 + 4Q. If demand changed from P = 100 – 2Q to P = 130
– Q, the new equilibrium price is
180.
Quantity Demanded
Price
Quantity Supplied
52
$50
73
62
45
62
72
40
51
82
35
42
92
30
33
In this market, economists would call a government-set minimum price of $50 a
3-85
181.
Quantity Demanded
Price
Quantity Supplied
52
$50
73
62
45
62
72
40
51
82
35
42
92
30
33
In this market, economists would call a government-set maximum price of $40 a
182.
3-86
Quantity Demanded
Price
Quantity Supplied
52
$50
73
62
45
62
72
40
51
82
35
42
92
30
33
If government set a minimum price of $50 in the market, a
A. shortage of 21 units would occur.
183.
Quantity Demanded
Price
Quantity Supplied
52
$50
73
62
45
62
72
40
51
82
35
42
92
30
33
If government set a maximum price of $45 in the market,
A. a shortage of 21 units would arise.
3-87
Copyright © 2018 McGraw-Hill Education. All rights reserved. No reproduction or distribution without the prior
written consent of McGraw-Hill Education.
D. it would create neither a shortage nor a surplus.
184.
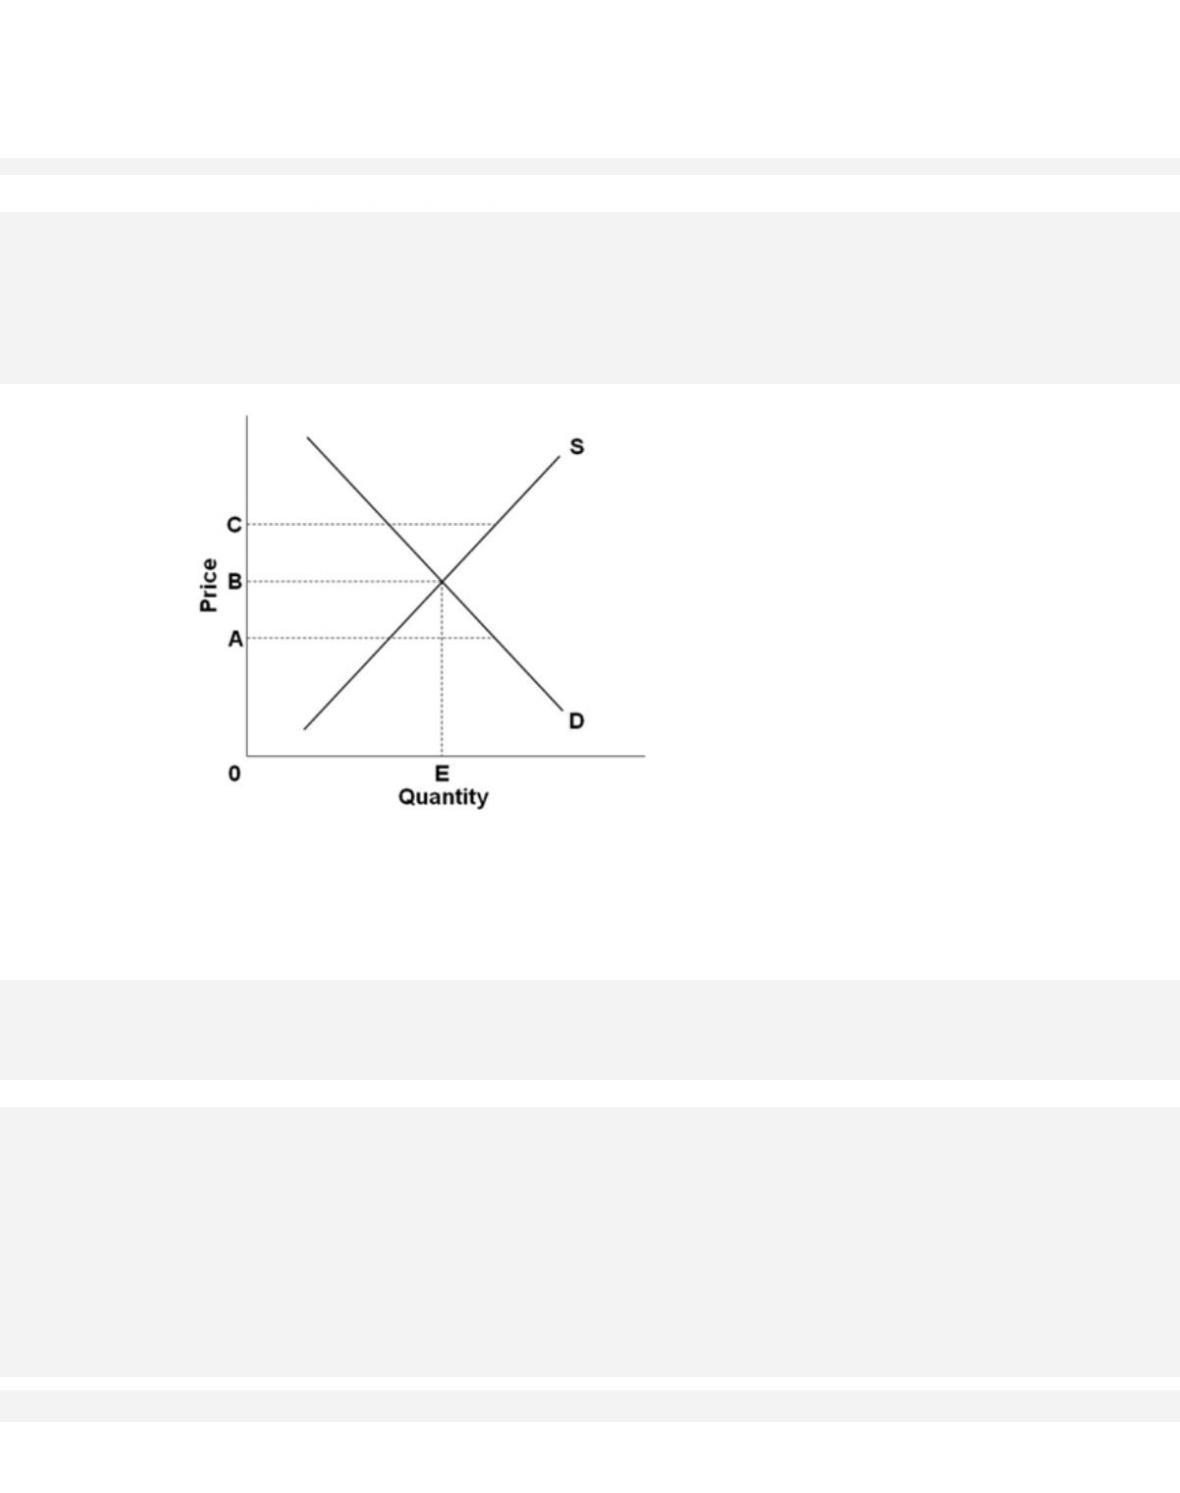
Refer to the diagram. An effective government–set price floor is best illustrated by
A. price A.

185.
Refer to the diagram. An effective government–set price ceiling is best illustrated by
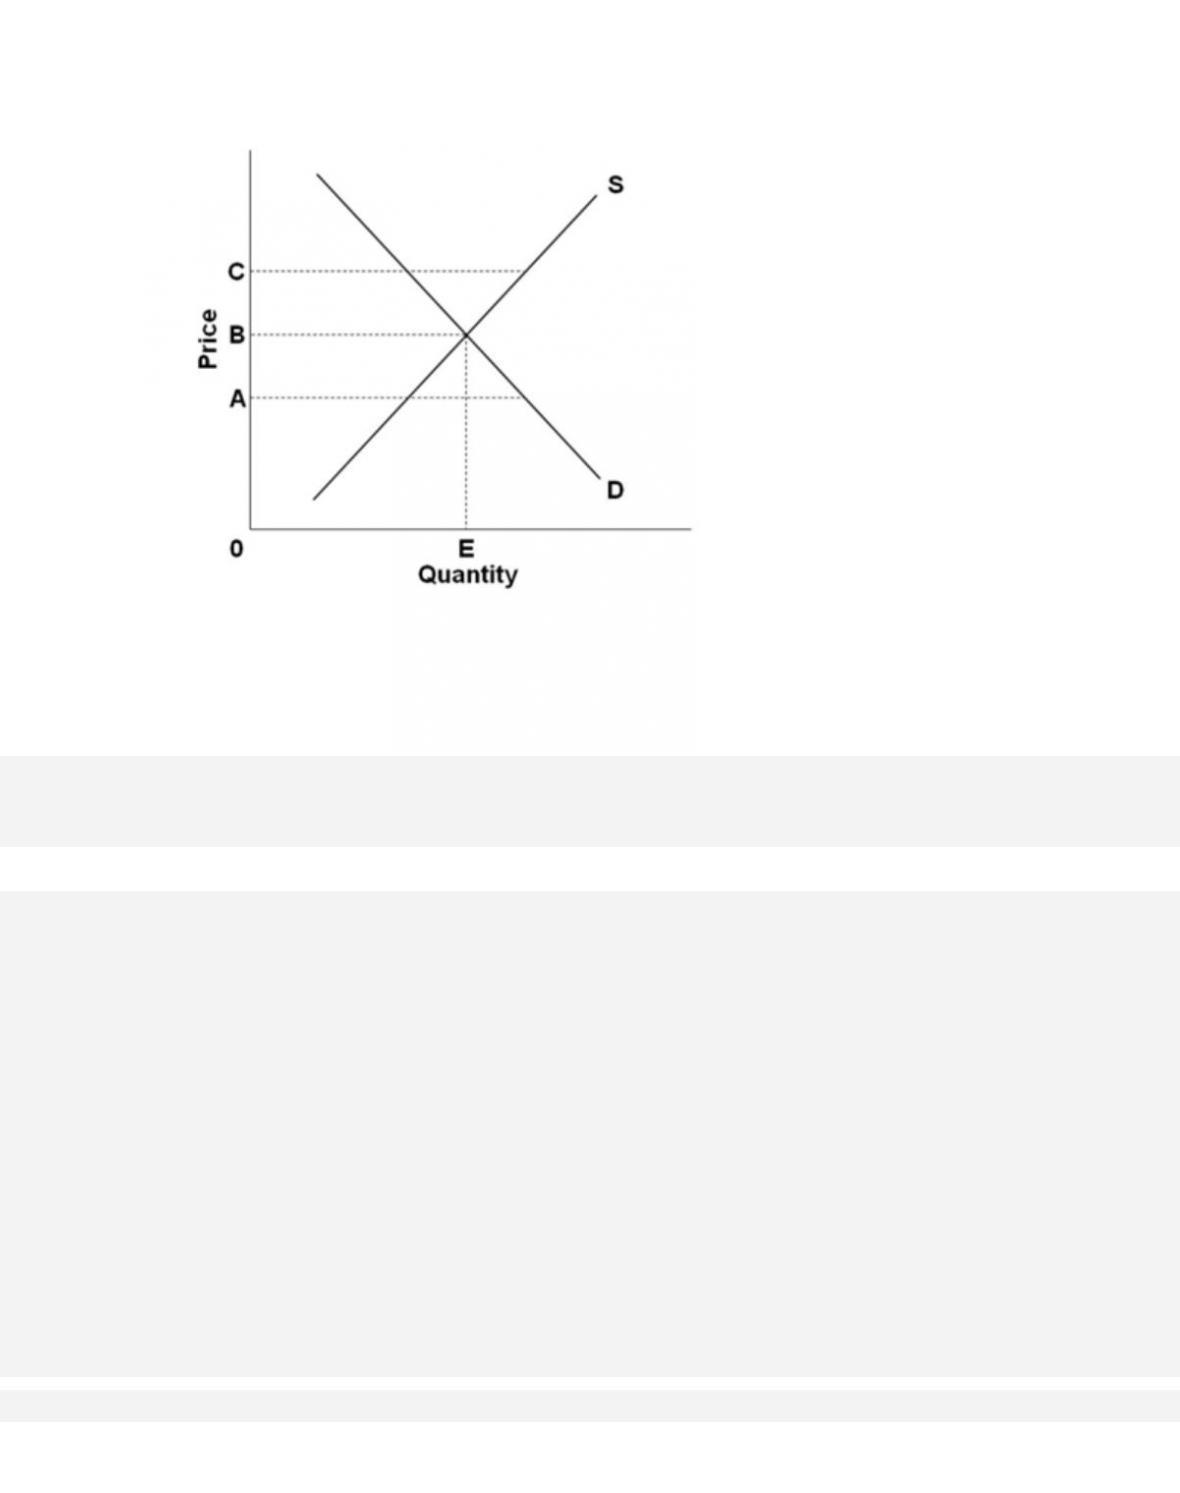
186.
Refer to the diagram. Rent controls are best illustrated by
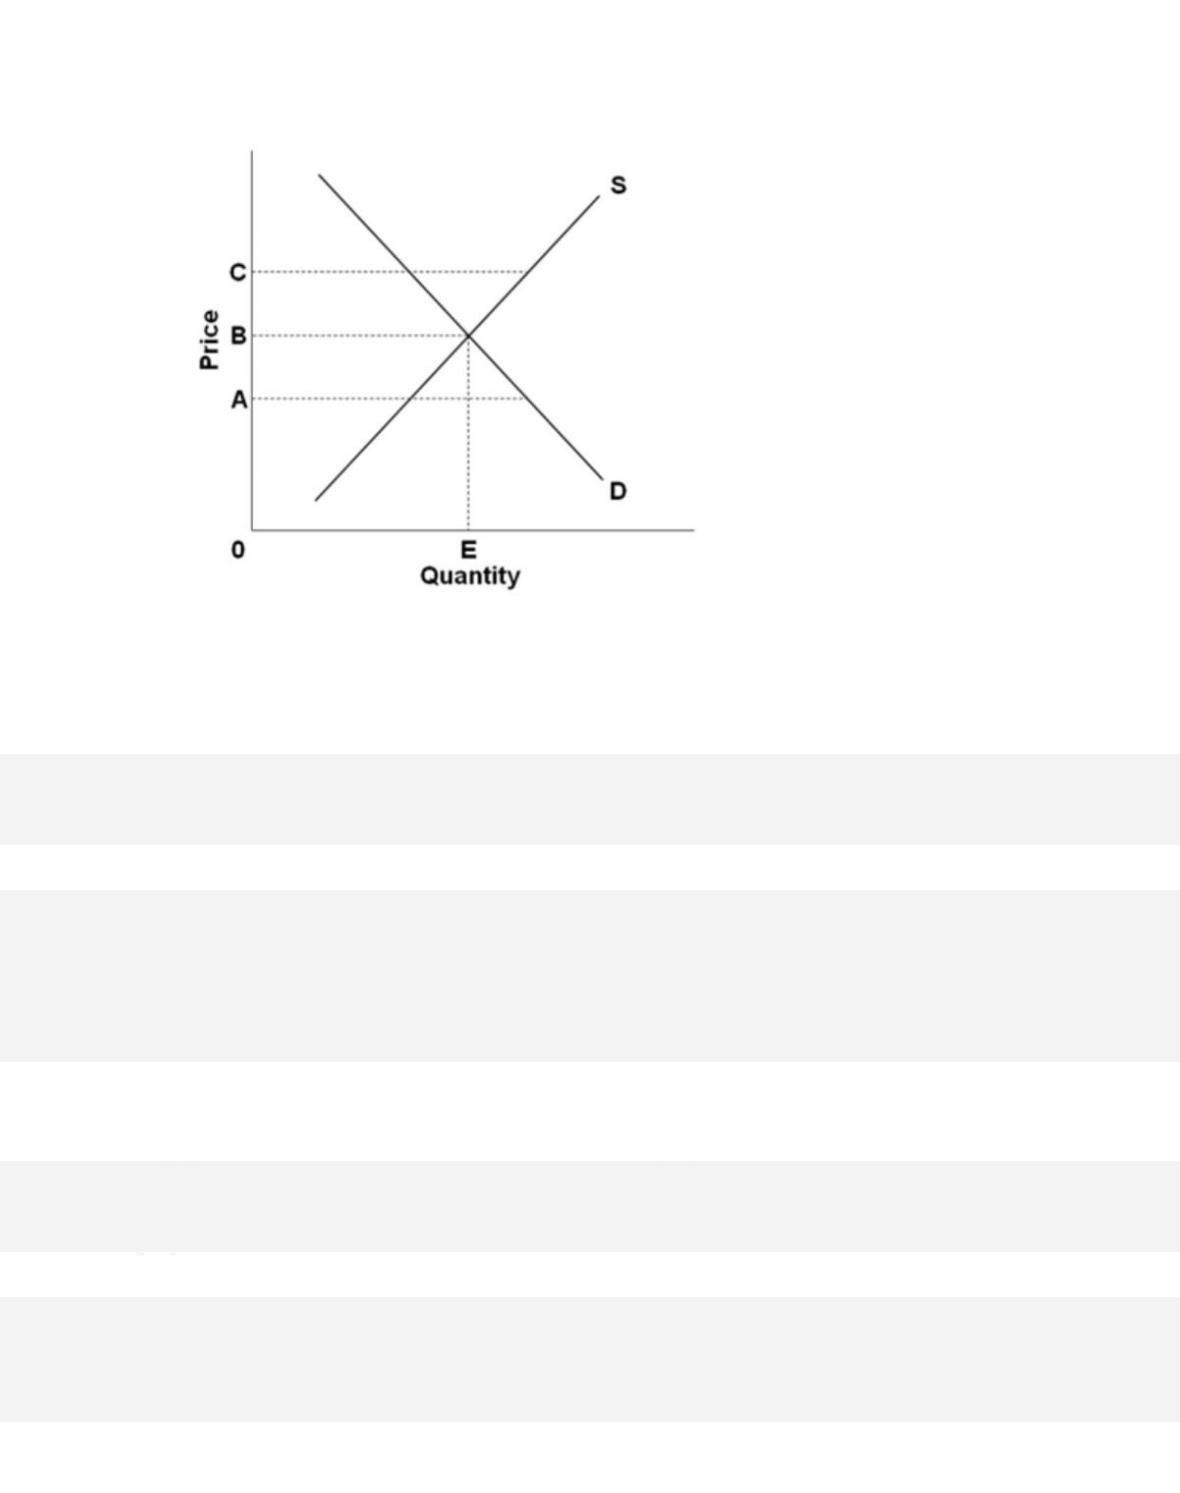
187.
Refer to the diagram. A government price support program to aid farmers is best illustrated by
188. Price floors and ceiling prices both

3-91
Copyright © 2018 McGraw-Hill Education. All rights reserved. No reproduction or distribution without the prior
written consent of McGraw-Hill Education.
Blooms: Remember
Dif fic ult y:
01 Easy
Learning Objective: 03–06 Identify what government-set prices are and how they can cause
product surpluses and shortages.
Test Bank: I
Top ic:
Application: Government-Set Prices
189. A price floor means that
190. An effective price ceiling will
191. An effective price floor will

3-92
D. clear the market.
192. Black markets are associated with
A. price floors and the resulting product surpluses.
193. A price ceiling means that
194. If an effective ceiling price is placed on hamburgers, then

A. the quantity demanded will exceed the quantity supplied.
195. If a legal ceiling price is set above the equilibrium price,
A. a shortage of the product will occur.
196. An effective price floor on wheat will
A. force otherwise profitable farmers out of business.

3-94
Copyright © 2018 McGraw-Hill Education. All rights reserved. No reproduction or distribution without the prior
written consent of McGraw-Hill Education.
Test Bank: I
Top ic:
Application: Government-Set Prices
197. Which of the following is a consequence of rent controls established to keep housing
affordable for the poor?
A. Less rental housing is available, as prospective landlords find it unprofitable to rent at
restricted prices.
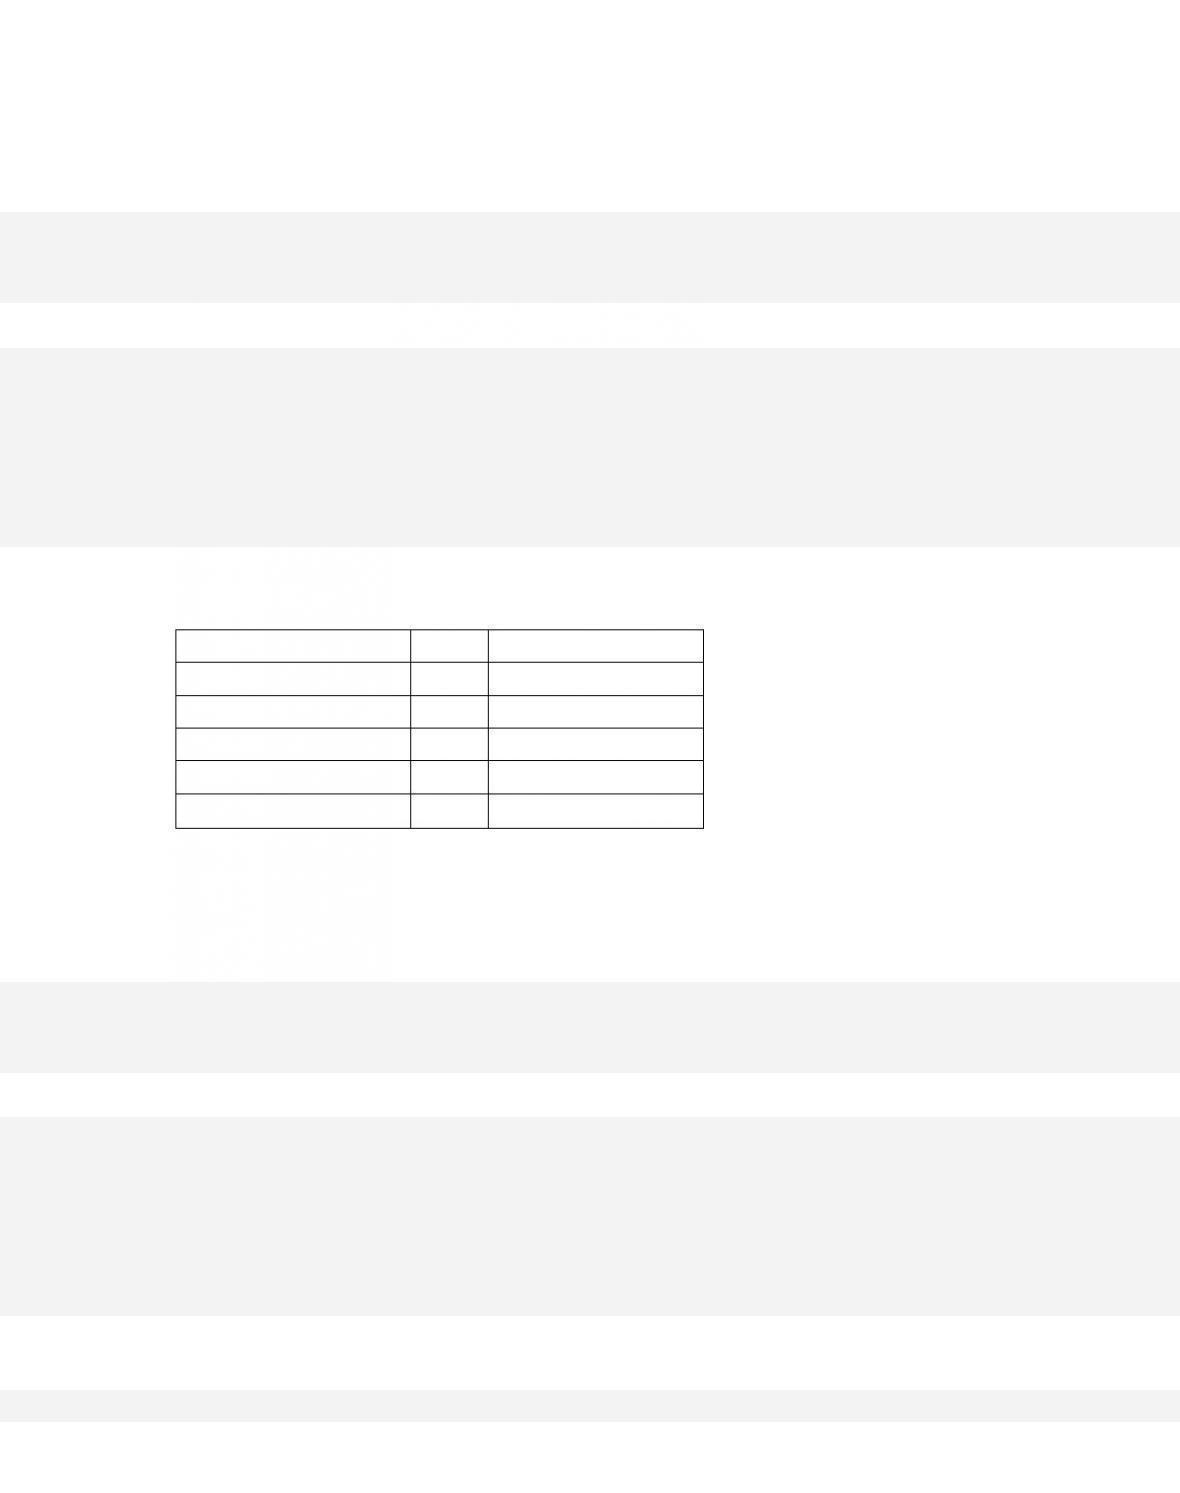
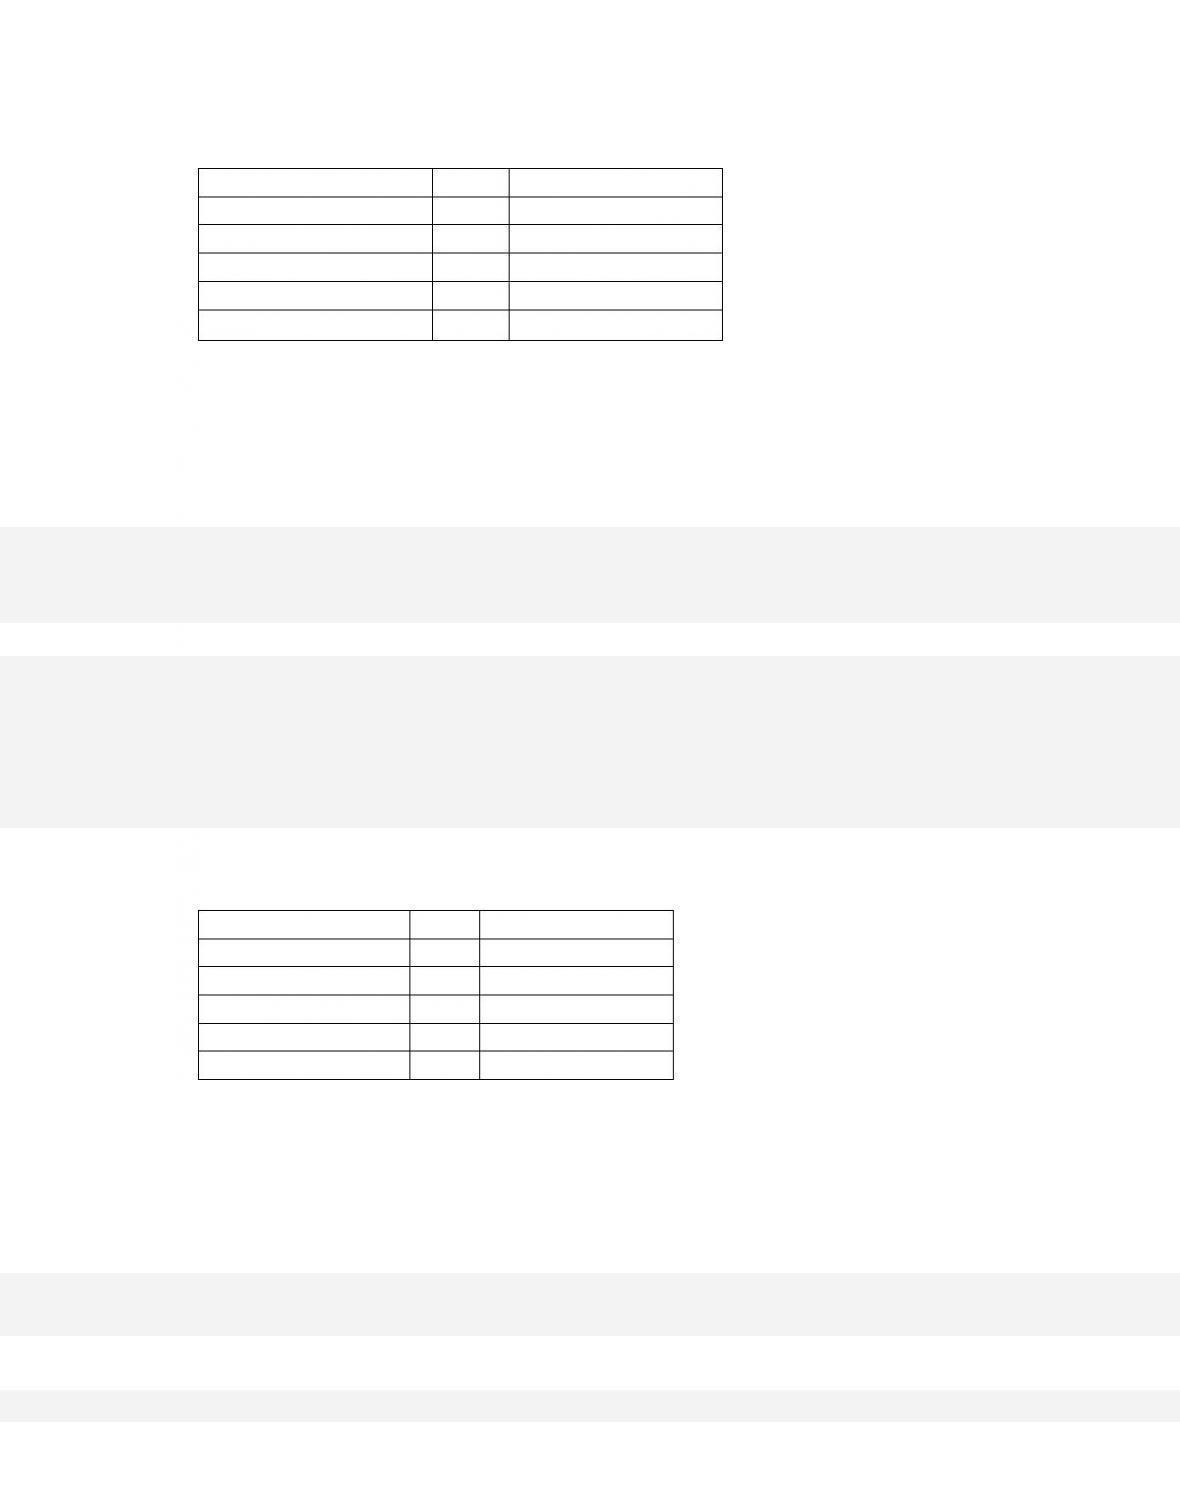
198. Which of the following statements is true about price ceilings?
A. price ceilings create surpluses for goods but shortages for services.
199. (Consider This) Dynamic pricing refers to

B. the rapid inflation that occurs in economies without a stable money supply.
200. (Consider This) Uber’s dynamic pricing
A. prevents regulated taxi drivers from changing their fares.
201. (Consider This) A primary advantage of Uber to government-regulated taxis is that

3-96
Copyright © 2018 McGraw-Hill Education. All rights reserved. No reproduction or distribution without the prior
written consent of McGraw-Hill Education.
Learning Objective: 03–06 Identify what government-set prices are and how they can cause
product surpluses and shortages.
Test Bank: I
Top ic:
Application: Government-Set Prices
Topic: Market Equilibrium
202. (Consider This) Surge prices
203. (Consider This) Suppose that salsa manufacturers sell 2 million bottles at $3.50 in one year
and 3 million bottles at $3 in the next year. Based on this information, we can conclude that the
204. (Consider This) Suppose that coffee growers sell 200 million pounds of coffee beans at $2
per pound in 2015 and 240 million pounds for $3 per pound in 2016. Based on this information,
we can conclude that the

3-97
205. (Last Word) In examining the relationship between student loans and college tuition, the
New York Federal Reserve Bank found that
A. increases in tuition costs caused an increase in student borrowing.
206. (Last Word) Based on economic theory and research on tuition costs and student
borrowing, the best way to reduce tuition costs for students would be to
A. increase subsidies for student loans.

3-98
Copyright © 2018 McGraw-Hill Education. All rights reserved. No reproduction or distribution without the prior
written consent of McGraw-Hill Education.
AACSB: Knowledge Application
A c c e s s i b i l i t y :
Keyboard Navigation
Blooms: Understand
Diffic ulty:
02 Medium
Learning Objective: 03–05 Explain how changes in supply and demand affect equilibrium
prices and quantities.
Test Bank: I
Top ic:
Changes in Supply, Demand, and Equilibrium
Topic: Market Equilibrium
207. (Last Word) According to research by the New York Federal Reserve Bank, which of the
following best explains rising tuition costs over the past several years?
D. widespread closing of colleges and universities, leading to a dramatic reduction in the supply
of higher education
True / False Questions
208. Surpluses drive market prices up; shortages drive them down.

3-99
209. If demand increases and supply simultaneously decreases, equilibrium price will rise.
210. The rationing function of prices refers to the fact that government must distribute any
surplus goods that may be left in a competitive market.
211. An increase in quantity supplied might be caused by an increase in production costs.
212. An increase in demand accompanied by an increase in supply will increase the equilibrium
quantity, but the effect on equilibrium price will be indeterminate.

3-100
Copyright © 2018 McGraw-Hill Education. All rights reserved. No reproduction or distribution without the prior
written consent of McGraw-Hill Education.
AACSB: Knowledge Application
A c c e s s i b i l i t y :
Keyboard Navigation
Blooms: Understand
Diffic ulty:
02 Medium
Learning Objective: 03–05 Explain how changes in supply and demand affect equilibrium
prices and quantities.
Test Bank: I
Top ic:
Changes in Supply, Demand, and Equilibrium
213. A government subsidy per unit of output increases supply.
214. Consumers buy more of normal goods as their incomes rise.
215. Toothpaste and toothbrushes are substitute goods.