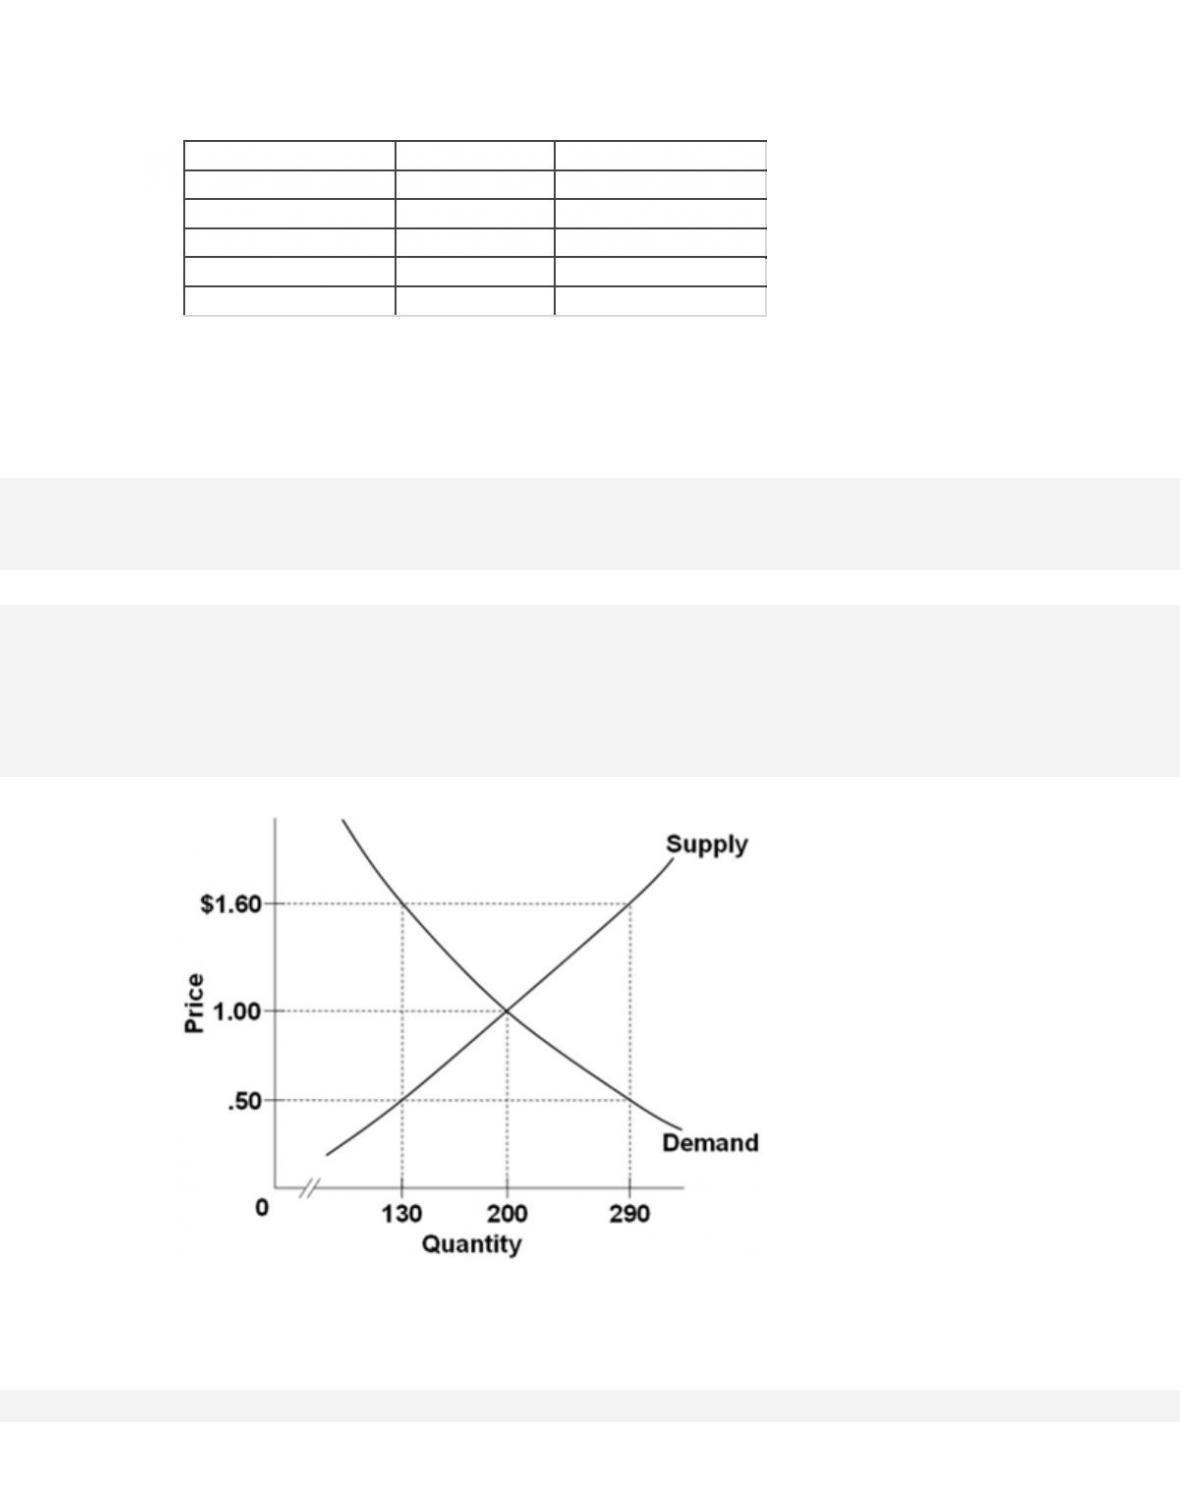
3-41
Per Month
Bushel
Month
45
$5
77
50
4
73
56
3
68
61
2
61
67
1
57
If price was initially $4 and free to fluctuate, we would expect the
A. quantity supplied to continue to exceed the quantity demanded.
99.
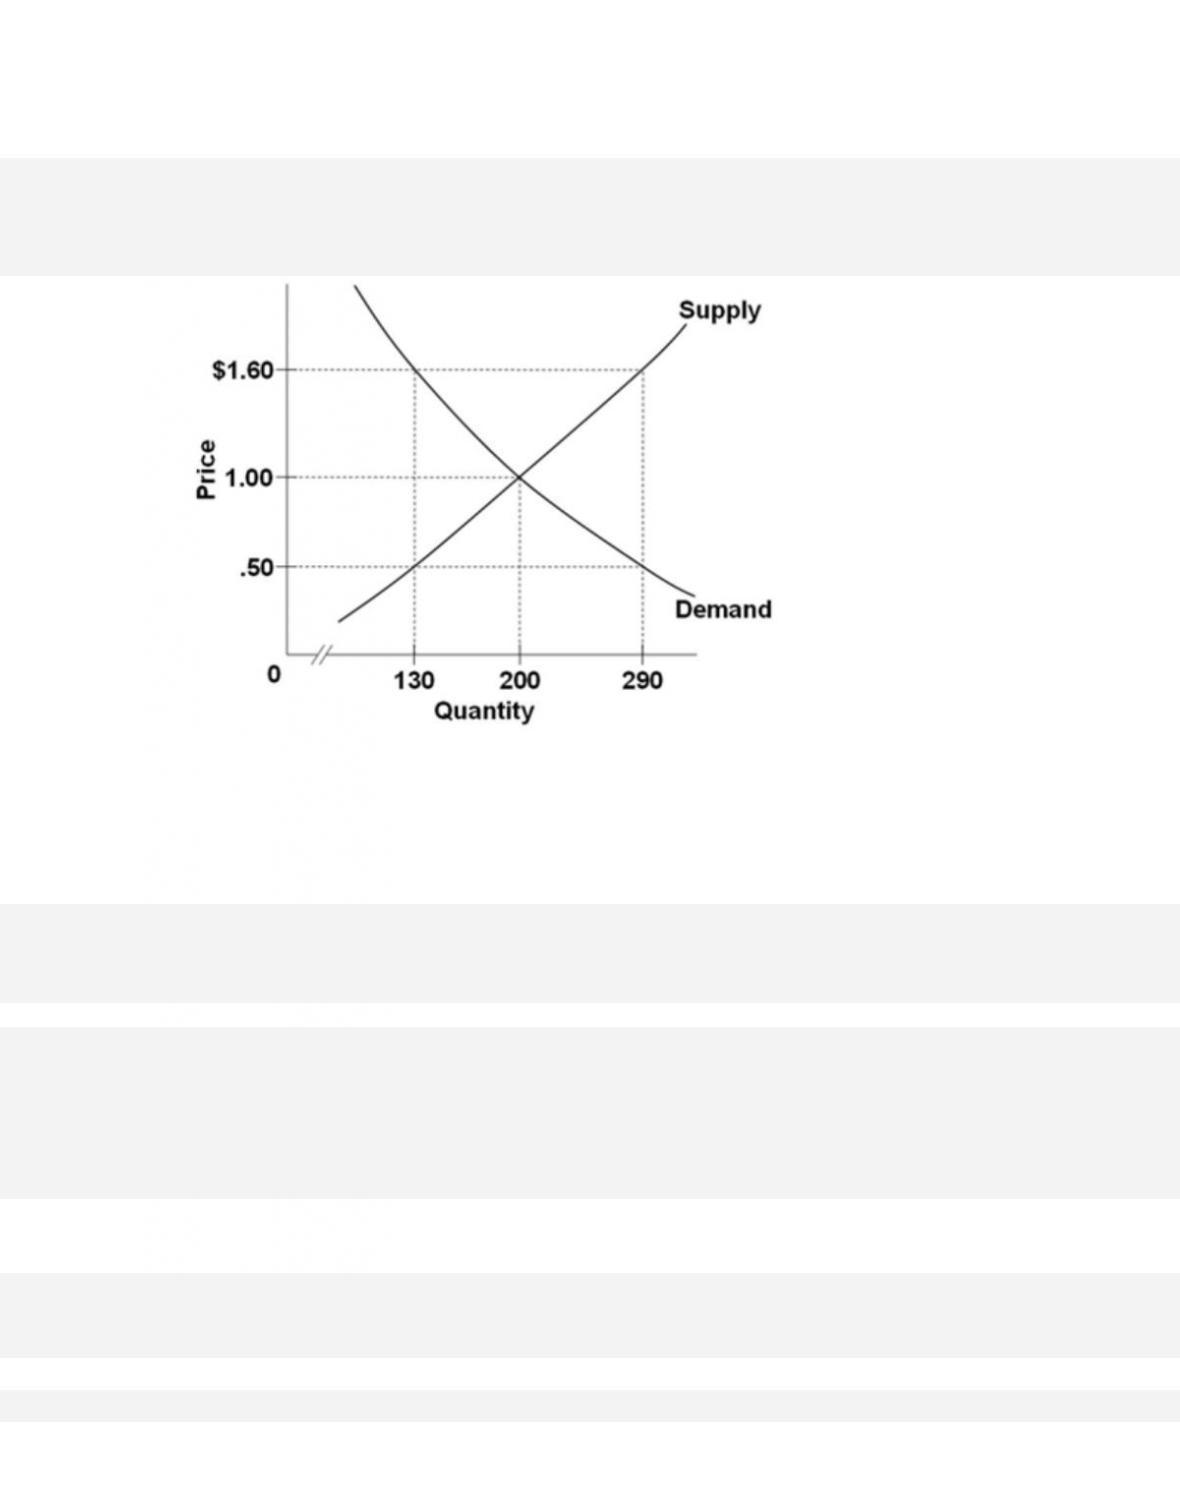
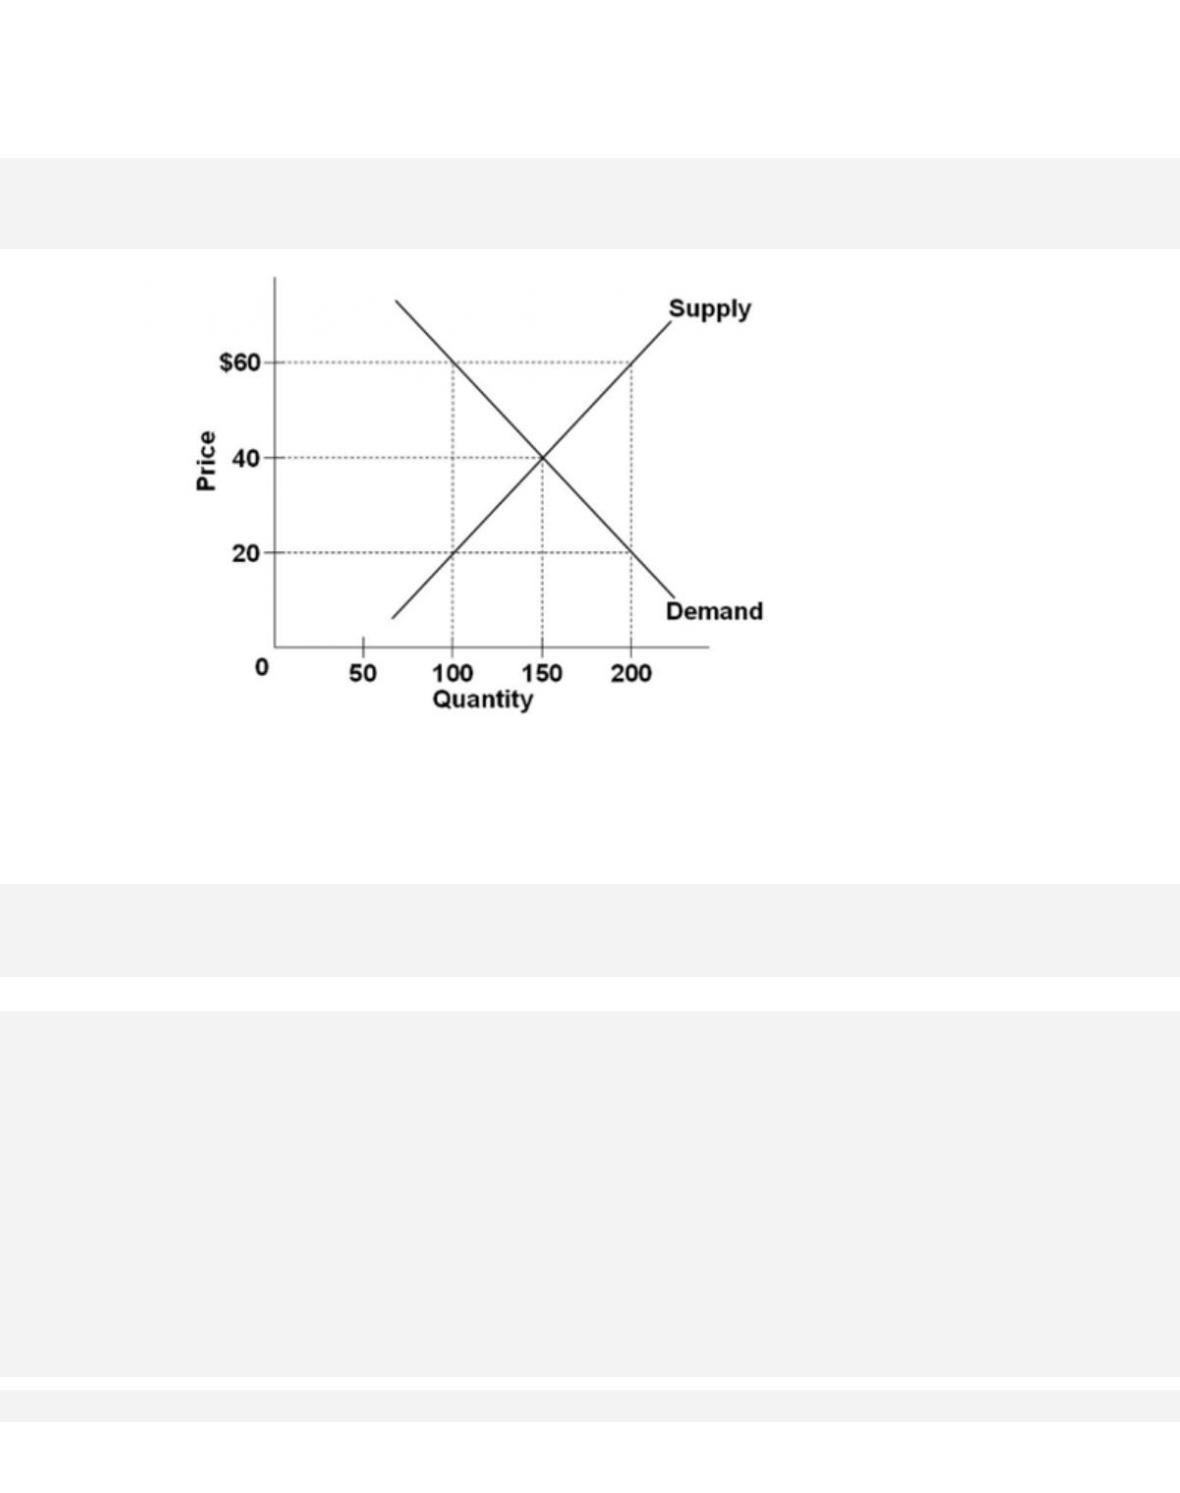
Refer to the diagram. The equilibrium price and quantity in this market will be
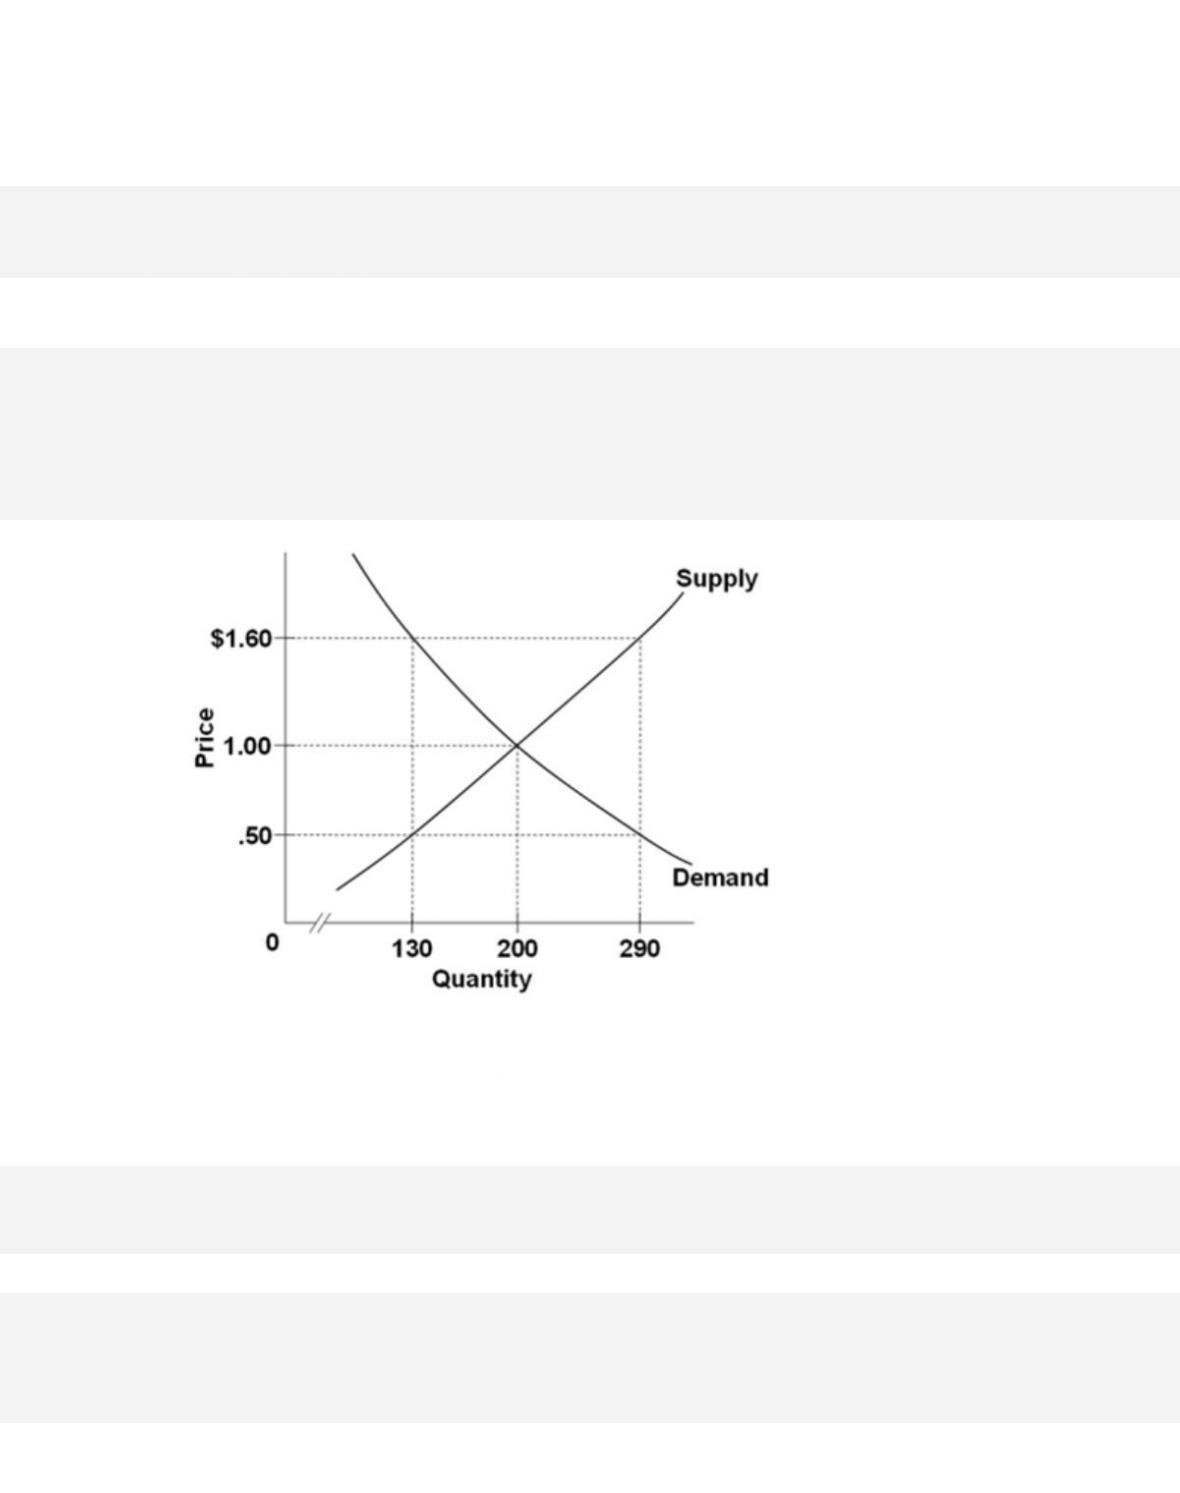
D. $1.60 and 290.
100.
Refer to the diagram. A surplus of 160 units would be encountered if the price was
A. $1.10, that is, $1.60 minus $.50.
3-43
Copyright © 2018 McGraw-Hill Education. All rights reserved. No reproduction or distribution without the prior
written consent of McGraw-Hill Education.
Diffic ulty:
02 Medium
Learning Objective: 03–04 Relate how supply and demand interact to determine market
equilibrium.
Test Bank: I
Top ic:
Market Equilibrium
101.
Refer to the diagram. A shortage of 160 units would be encountered if price was
A. $1.10, that is, $1.60 minus $.50.
102. If there is a surplus of a product, its price

3-44
C. will rise in the near future.
D. is in equilibrium.
103. A market is in equilibrium
A. provided there is no surplus of the product.
104. If the demand and supply curves for product X are stable, a government–mandated increase
in the price of X will
A. increase the supply of X and decrease the demand for X.
105. At the equilibrium price,
A. quantity supplied may exceed quantity demanded or vice versa.
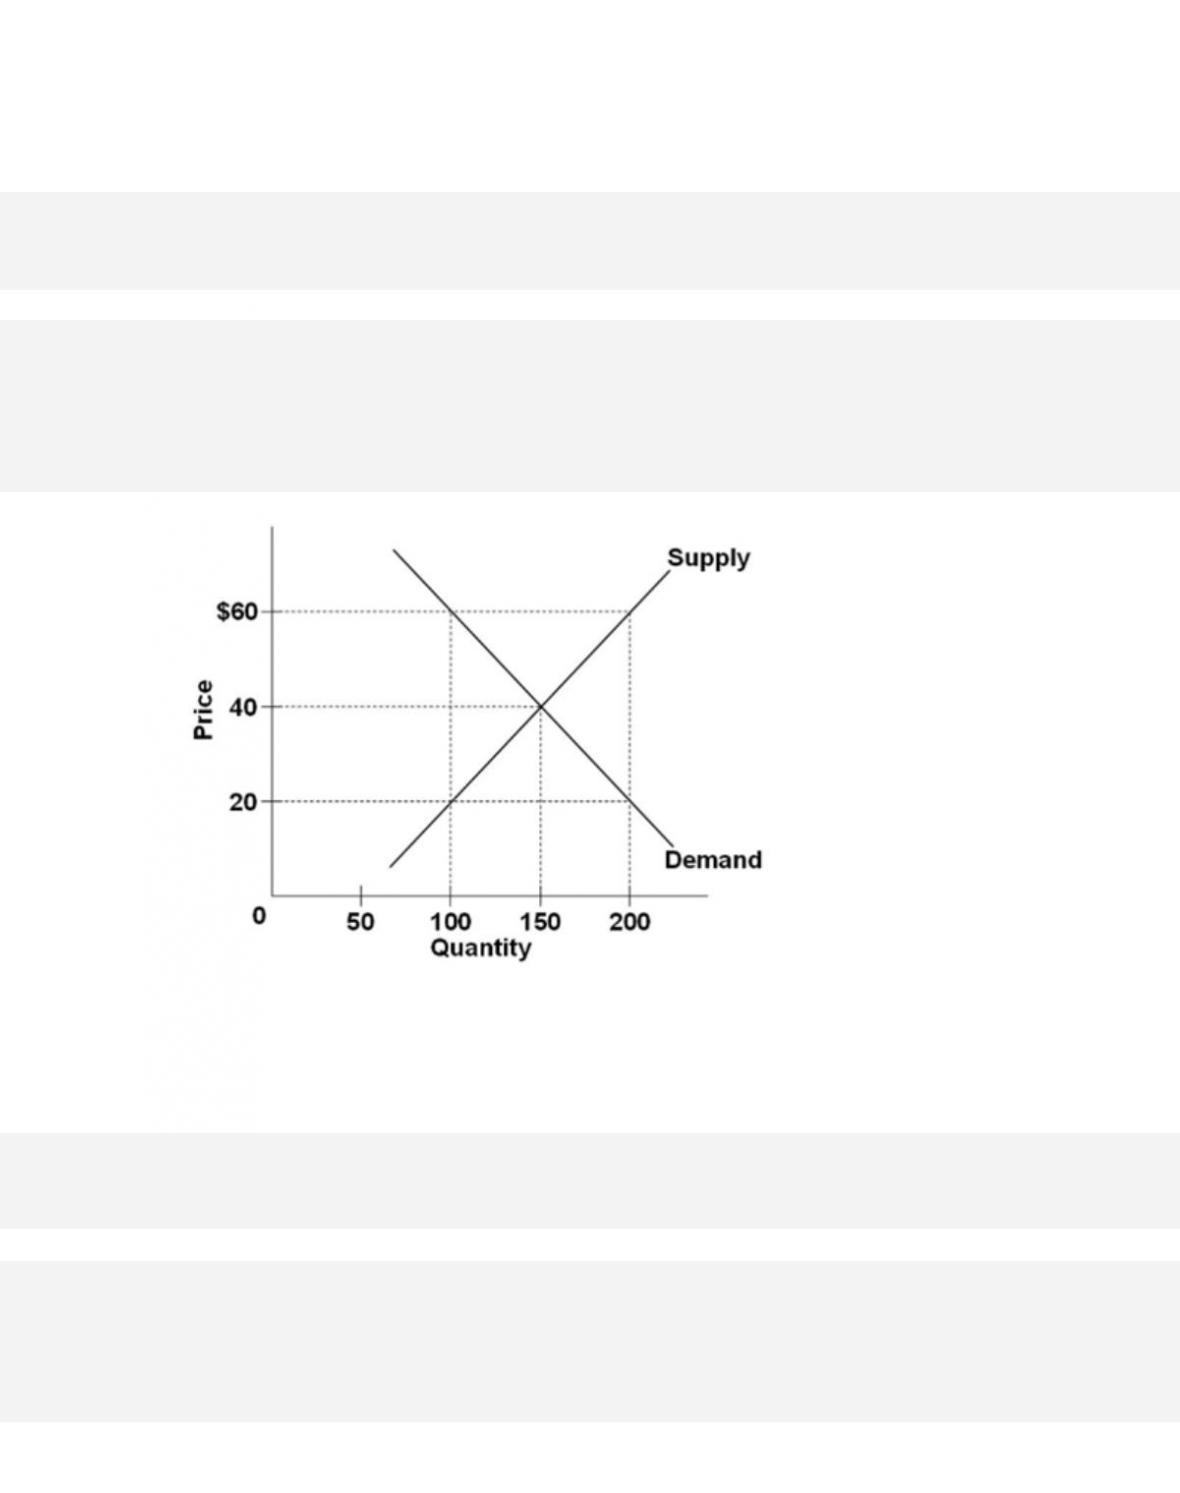
106.
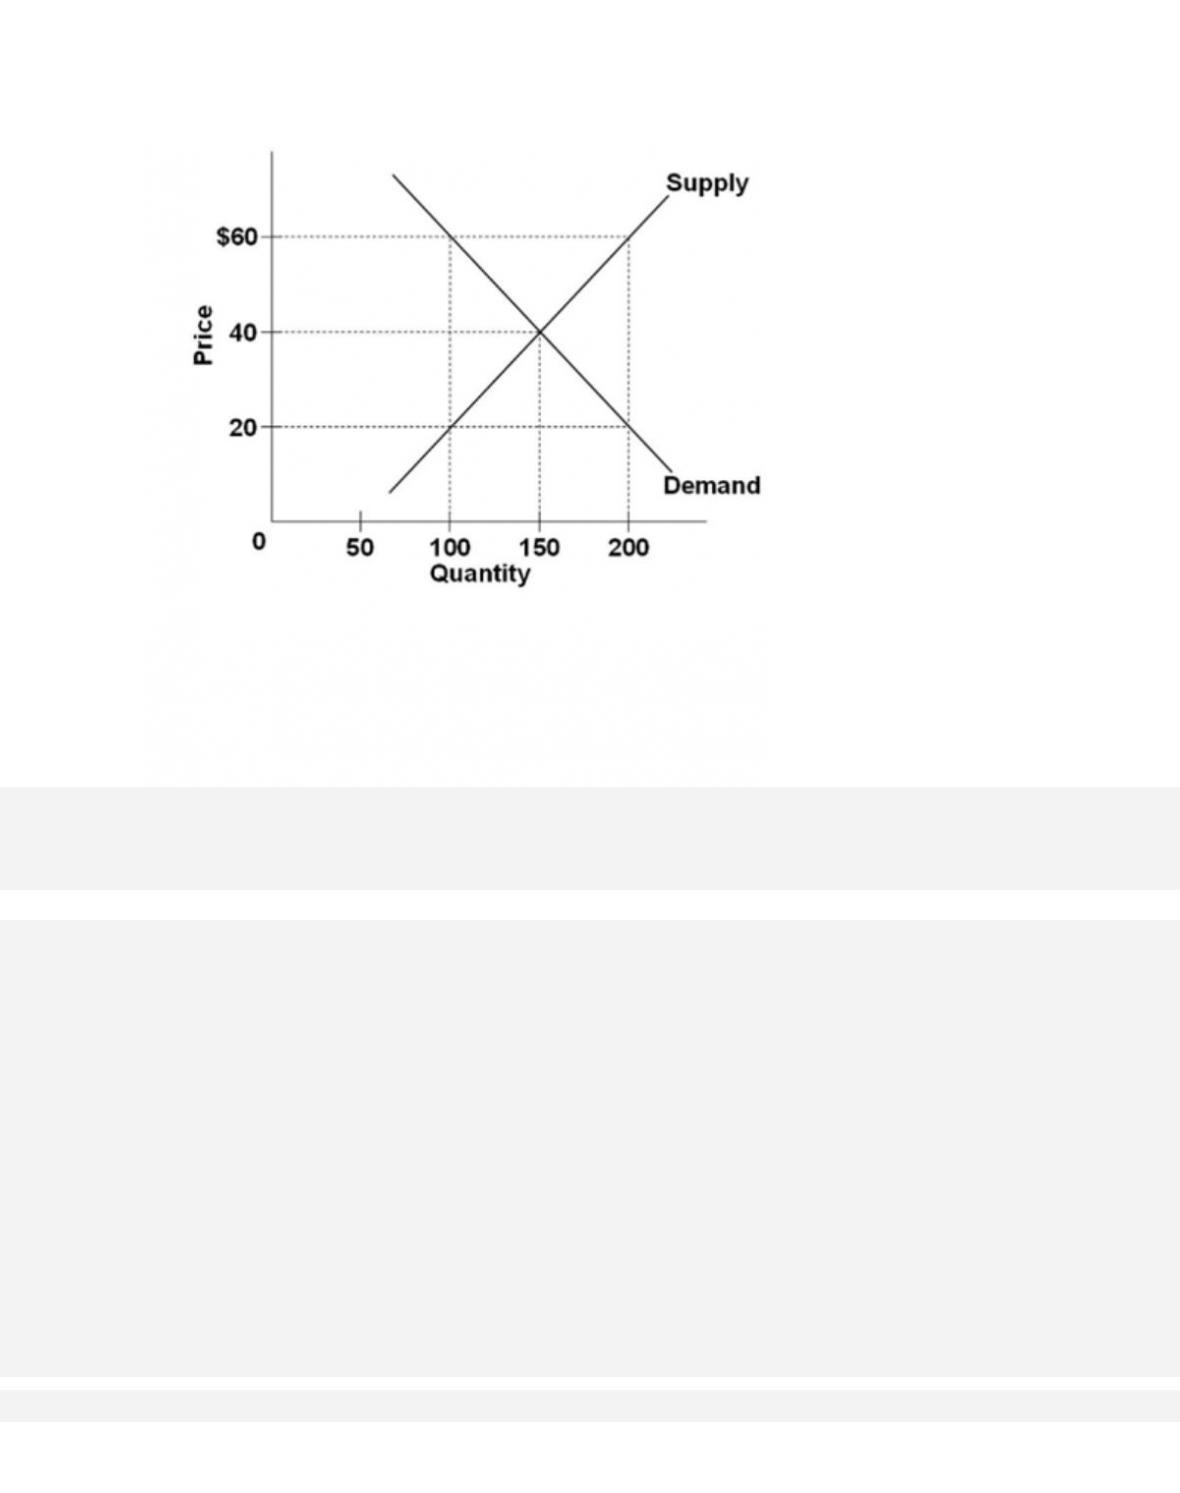
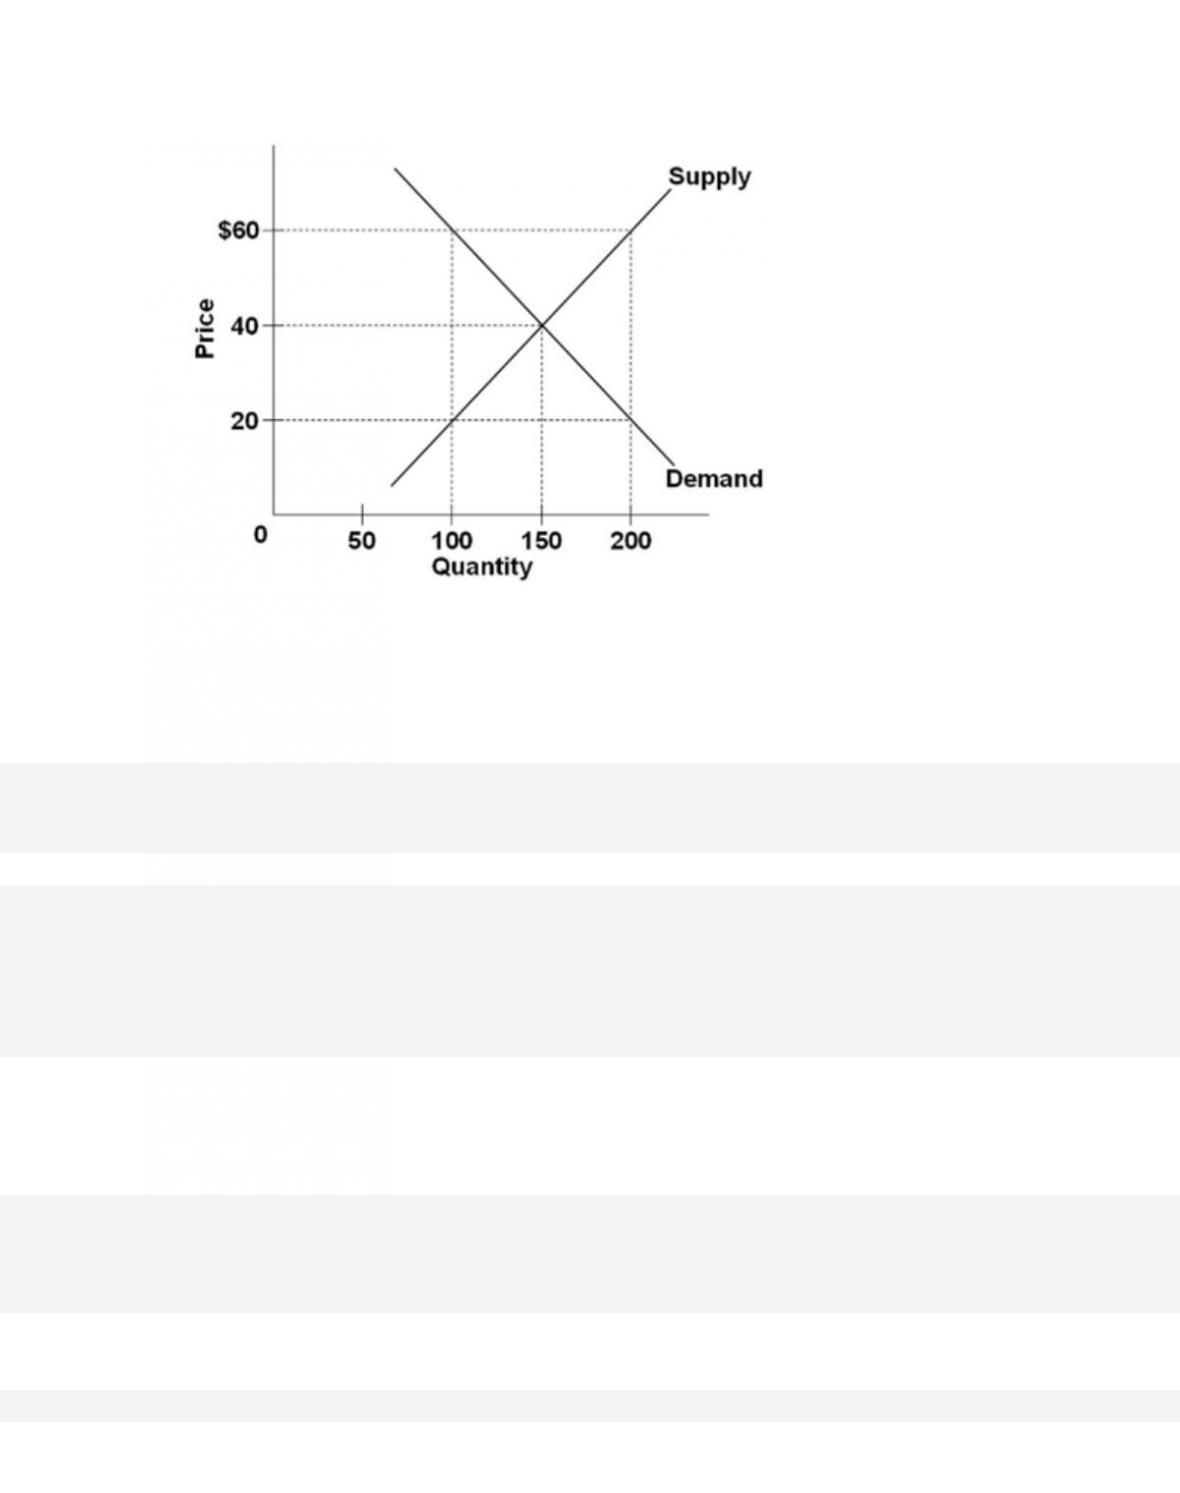
Refer to the diagram. A price of $60 in this market will result in
A. equilibrium.
3-46
Copyright © 2018 McGraw-Hill Education. All rights reserved. No reproduction or distribution without the prior
written consent of McGraw-Hill Education.
Learning Objective: 03–04 Relate how supply and demand interact to determine market
equilibrium.
Test Bank: I
Top ic:
Market Equilibrium
107.
Refer to the diagram. A price of $20 in this market will result in a
A. shortage of 50 units.
108.
Refer to the diagram. The highest price that buyers will be willing and able to pay for 100 units
of this product is
3-48
109.
Refer to the diagram. If this is a competitive market, price and quantity will move toward
A. $60 and 100, respectively.
110. At the point where the demand and supply curves for a product intersect,
A. the selling price and the buying price need not be equal.
B. the market may, or may not, be in equilibrium.

3-49
Copyright © 2018 McGraw-Hill Education. All rights reserved. No reproduction or distribution without the prior
written consent of McGraw-Hill Education.
AACSB: Knowledge Application
A c c e s s i b i l i t y :
Keyboard Navigation
Blooms: Understand
Diffic ulty:
02 Medium
Learning Objective: 03–04 Relate how supply and demand interact to determine market
equilibrium.
Test Bank: I
Top ic:
Market Equilibrium
111. The rationing function of prices refers to the
A. tendency of supply and demand to shift in opposite directions.
112. If there is a shortage of product X, and the price is free to change,
A. fewer resources will be allocated to the production of this good.
113. At the current price, there is a shortage of a product. We would expect price to

A. increase, quantity demanded to increase, and quantity supplied to decrease.
114. A surplus of a product will arise when price is
A. above equilibrium, with the result that quantity demanded exceeds quantity supplied.
115. If price is above the equilibrium level, competition among sellers to reduce the resulting
D. shortage will increase quantity demanded and decrease quantity supplied.

3-51
Copyright © 2018 McGraw-Hill Education. All rights reserved. No reproduction or distribution without the prior
written consent of McGraw-Hill Education.
Top ic:
Market Equilibrium
116. If we say that a price is too high to clear the market, we mean that
A. quantity demanded exceeds quantity supplied.
117. Assume in a competitive market that price is initially above the equilibrium level. We can
predict that price will
A. decrease, quantity demanded will decrease, and quantity supplied will increase.
118. Assume in a competitive market that price is initially below the equilibrium level. We can
predict that price will
A. decrease, quantity demanded will decrease, and quantity supplied will increase.

3-52
Copyright © 2018 McGraw-Hill Education. All rights reserved. No reproduction or distribution without the prior
written consent of McGraw-Hill Education.
A c c e s s i b i l i t y :
Keyboard Navigation
Blooms: Understand
Diffic ulty:
02 Medium
Learning Objective: 03–04 Relate how supply and demand interact to determine market
equilibrium.
Test Bank: I
Top ic:
Market Equilibrium
119. A product market is in equilibrium
A. whenever there is no surplus of the product.
120. There will be a surplus of a product when
A. price is below the equilibrium level.
121. Camille’s Creations and Julia’s Jewels both sell beads in a competitive market. If at the
market price of $5 both are running out of beads to sell (they can’t keep up with the quantity
demanded at that price), then we would expect both Camille’s and Julia’s to

A. raise their price and reduce their quantity supplied.
122. Productive efficiency refers to
D. production at some point inside of the production possibilities curve.
123. If an economy produces its most wanted goods but uses outdated production methods, it is
D. engaged in roundabout production.

3-54
Copyright © 2018 McGraw-Hill Education. All rights reserved. No reproduction or distribution without the prior
written consent of McGraw-Hill Education.
Top ic:
Market Equilibrium
124. Allocative efficiency is concerned with
D. reducing the concavity of the production possibilities curve.
125. Allocative efficiency involves determining
A. which output mix will result in the most rapid rate of economic growth.
126. The equilibrium price and quantity in a market usually produce allocative efficiency
because
D. the excess of goods produced at equilibrium guarantees that all will have enough.

3-55
Copyright © 2018 McGraw-Hill Education. All rights reserved. No reproduction or distribution without the prior
written consent of McGraw-Hill Education.
Blooms: Understand
Diffic ulty:
02 Medium
Learning Objective: 03–04 Relate how supply and demand interact to determine market
equilibrium.
Test Bank: I
Top ic:
Market Equilibrium
127. Allocative efficiency refers to
D. production at some point inside of the production possibilities curve.
128. Which of the following statements is true about productive and allocative efficiency?
D. Productive efficiency and allocative efficiency can only occur together; neither can occur
without the other.
129. Other things equal, an excise tax on a product will
A. increase its supply.

3-56
Copyright © 2018 McGraw-Hill Education. All rights reserved. No reproduction or distribution without the prior
written consent of McGraw-Hill Education.
B. increase its price.
C. increase the quantity sold.
D. increase its demand.
130. Assuming conventional supply and demand curves, changes in the determinants of both
supply and demand will generally
D. have no effect on equilibrium price or quantity.
131. Which of the following will cause a decrease in market equilibrium price and an increase
in equilibrium quantity?
D. a decrease in demand

3-57
Copyright © 2018 McGraw-Hill Education. All rights reserved. No reproduction or distribution without the prior
written consent of McGraw-Hill Education.
Test Bank: I
Top ic:
Changes in Supply, Demand, and Equilibrium
132. Suppose that in each of four successive years, producers sell more of their product and at
lower prices. This could be explained
A. by small annual increases in supply accompanied by large annual increases in demand.
133. Which of the following statements is correct?
A. If demand increases and supply decreases, equilibrium price will fall.
134. In which of the following instances is the effect on equilibrium price (whether it rises, falls,
or remains unchanged) dependent on the magnitude of the shifts in supply and demand?
D. supply rises and demand falls
3-58
Copyright © 2018 McGraw-Hill Education. All rights reserved. No reproduction or distribution without the prior
written consent of McGraw-Hill Education.
AACSB: Knowledge Application
A c c e s s i b i l i t y :
Keyboard Navigation
Blooms: Understand
Diffic ulty:
02 Medium
Learning Objective: 03–05 Explain how changes in supply and demand affect equilibrium
prices and quantities.
Test Bank: I
Top ic:
Changes in Supply, Demand, and Equilibrium
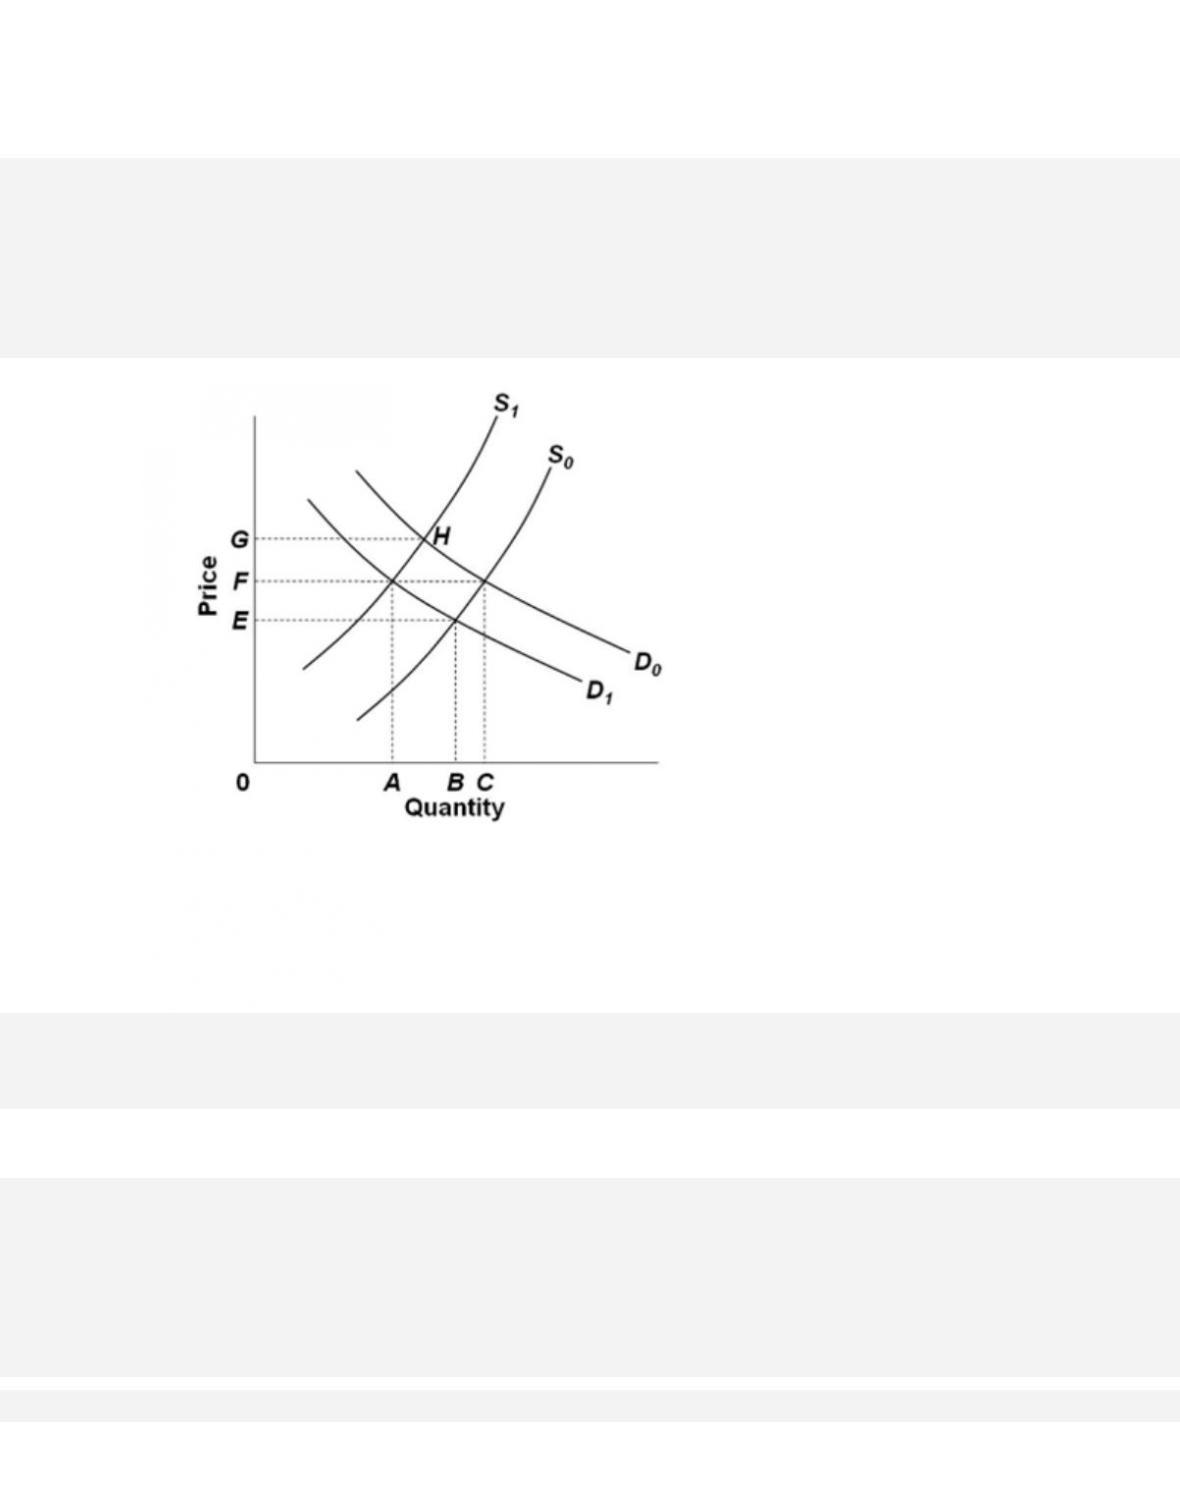
135.
Refer to the diagram, which shows demand and supply conditions in the competitive market for
product X. If the initial demand and supply curves are D0 and S0, equilibrium price and
quantity will be
D. 0E and 0B, respectively.
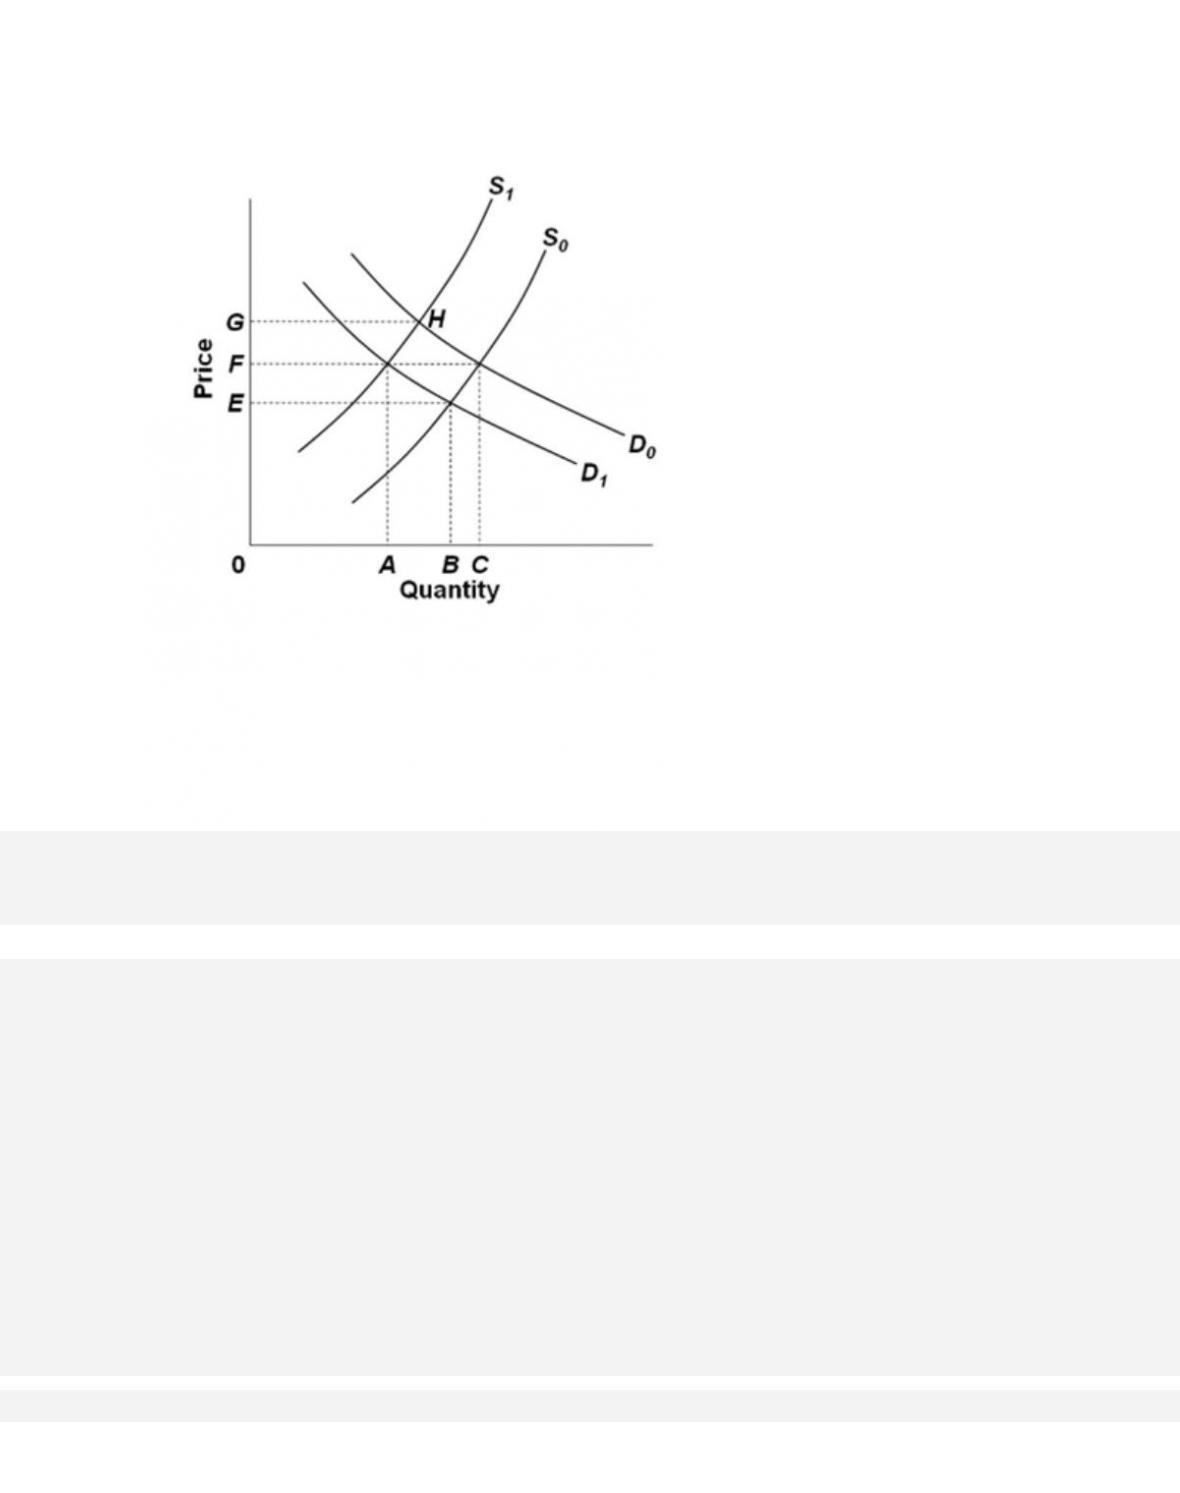
136.
Refer to the diagram, which shows demand and supply conditions in the competitive market for
product X. Given D0, if the supply curve moved from S0 to S1, then
A. supply has increased and equilibrium quantity has decreased.
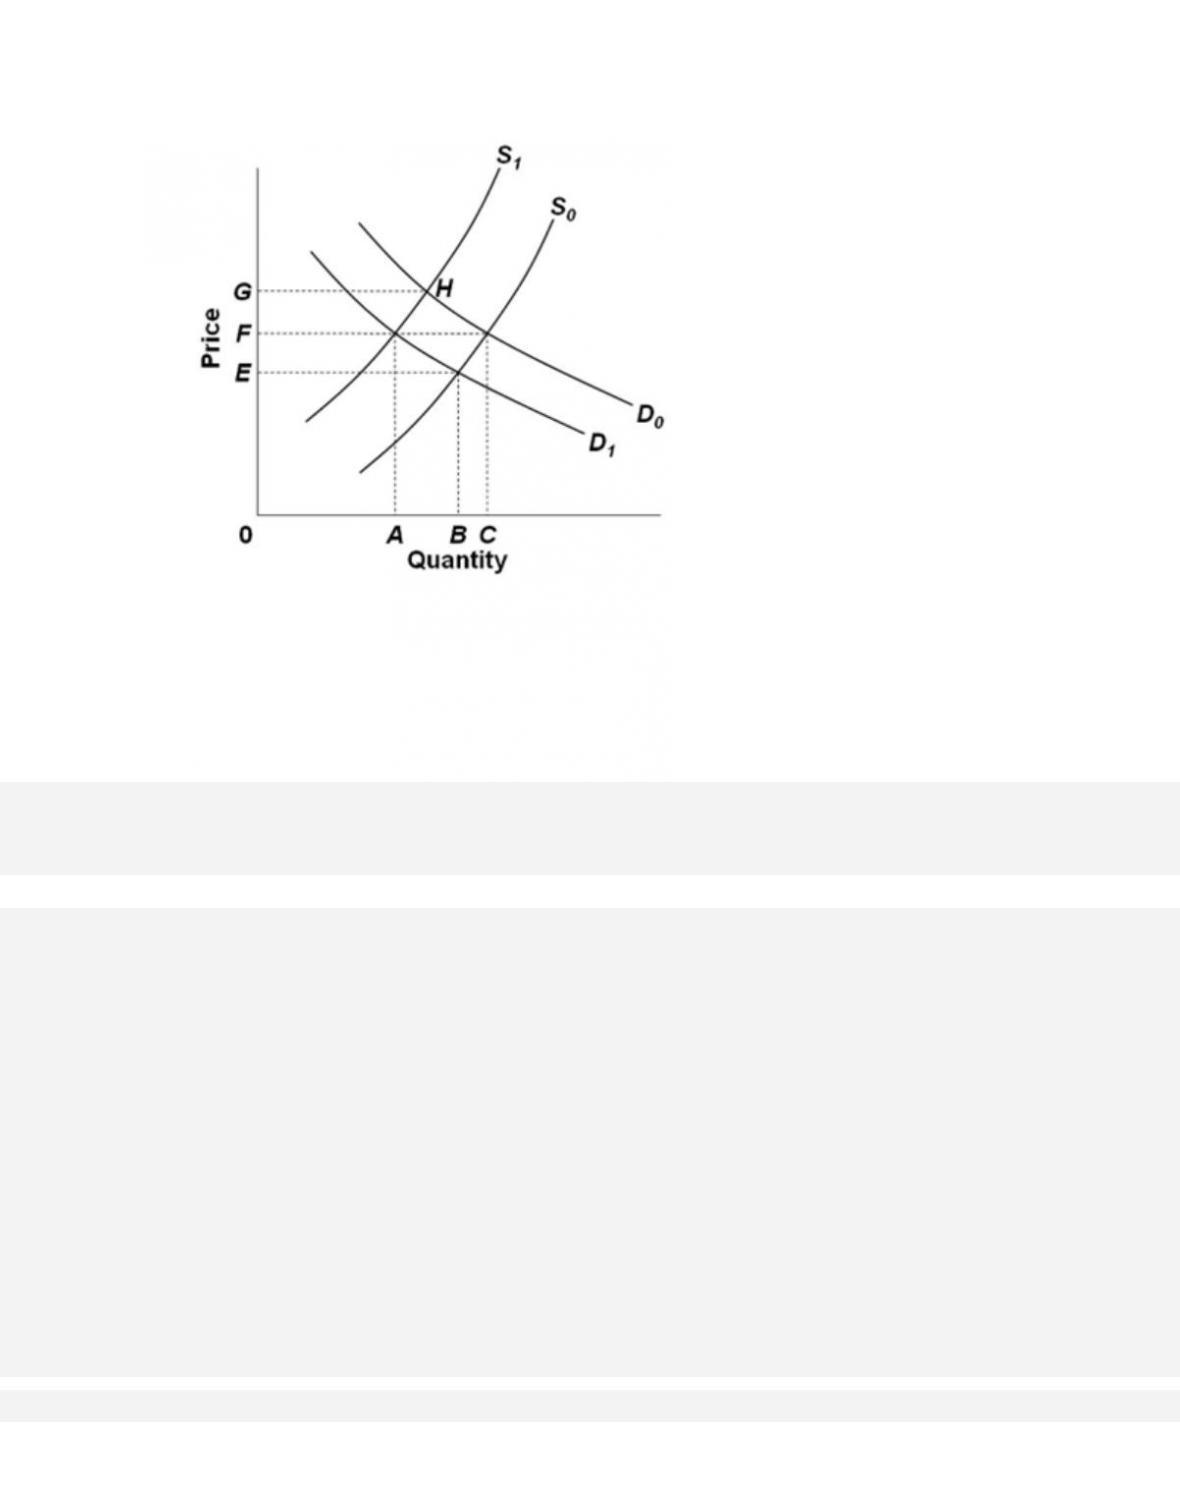
137.
Refer to the diagram, which shows demand and supply conditions in the competitive market for
product X. If supply is S1 and demand D0, then
A. at any price above 0G a shortage would occur.