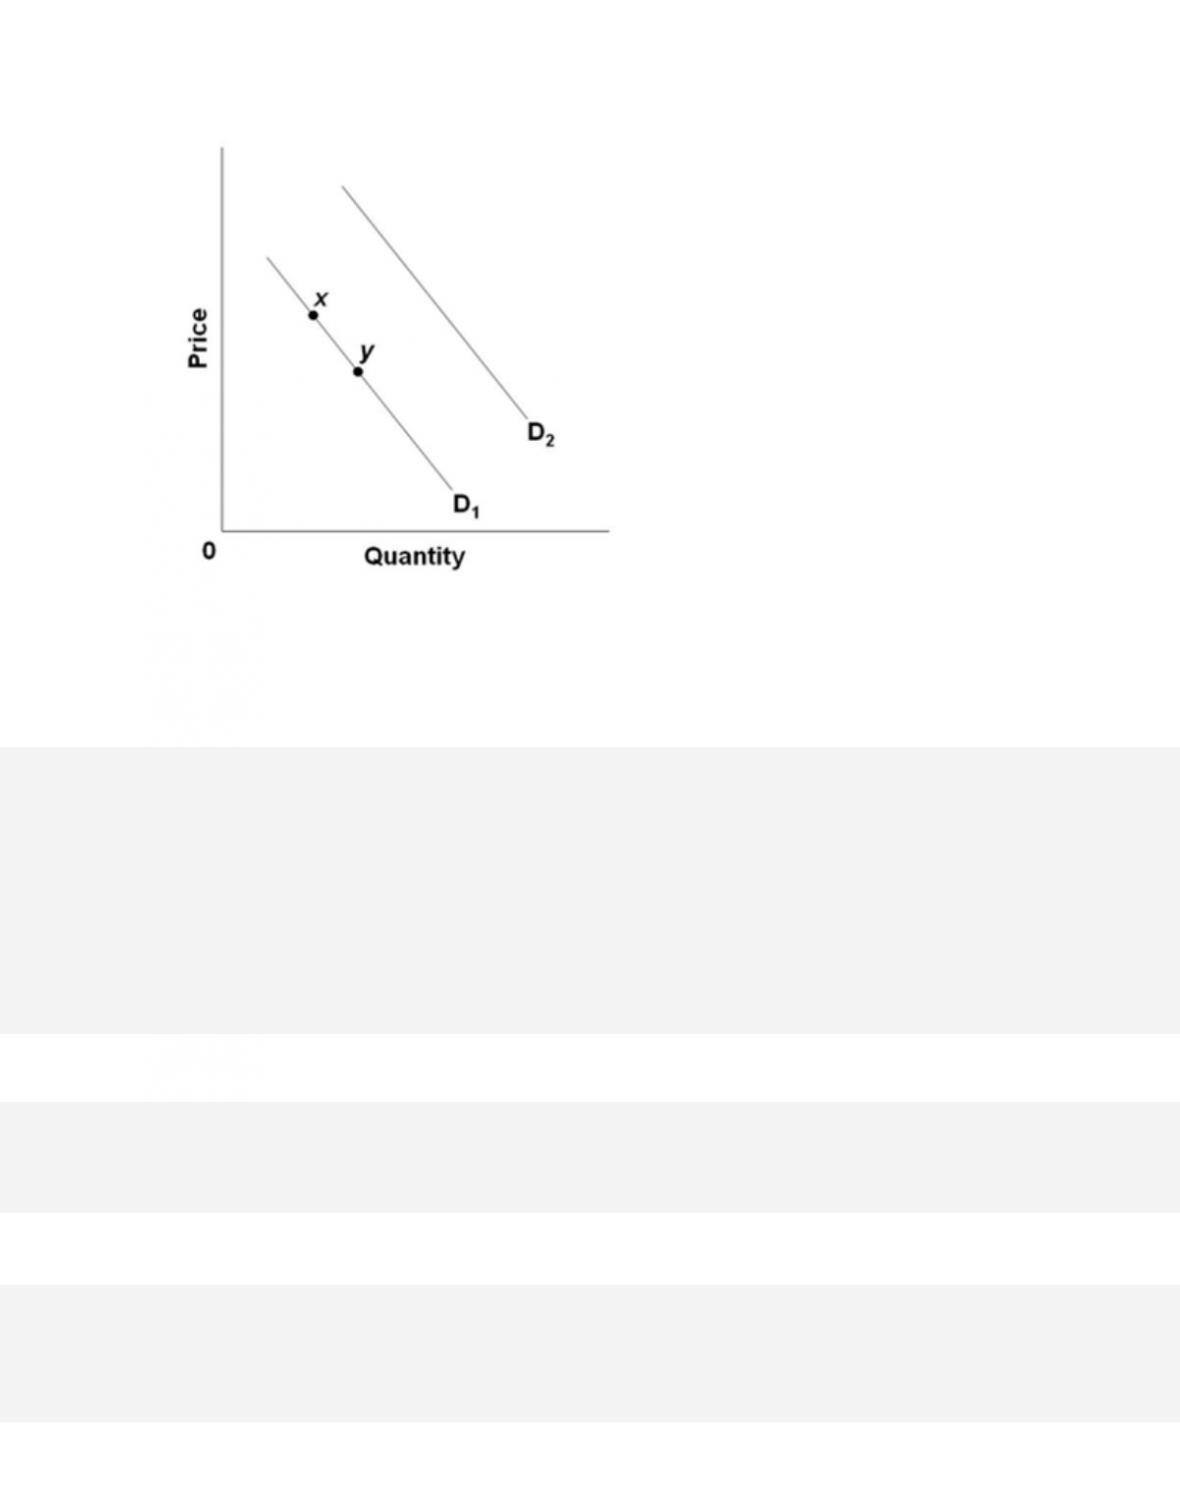
55.
Refer to the diagram. A decrease in quantity demanded is depicted by a
A. move from point x to point y.
56. When an economist says that the demand for a product has increased, this means that
D. the demand curve has shifted to the left.

3-22
Copyright © 2018 McGraw-Hill Education. All rights reserved. No reproduction or distribution without the prior
written consent of McGraw-Hill Education.
Diff iculty:
02 Medium
Learning Objective: 03–02 Describe demand and explain how it can change.
Test Bank: I
Topic:
Demand
57. “In the corn market, demand often exceeds supply and supply sometimes exceeds demand.”
“The price of corn rises and falls in response to changes in supply and demand.” In which of
these two statements are the terms demand and supply being used correctly?
58. By an “increase in demand,” economists mean that
A. product price has fallen, so consumers move down to a new point on the demand curve.
59. The term “quantity demanded”
A. refers to the entire series of prices and quantities that comprise the demand schedule.

3-23
Copyright © 2018 McGraw-Hill Education. All rights reserved. No reproduction or distribution without the prior
written consent of McGraw-Hill Education.
AACSB: Knowledge Application
A c c e s s i b i l i t y :
Keyboard Navigation
Blooms: Understand
Diff iculty:
02 Medium
Learning Objective: 03–02 Describe demand and explain how it can change.
Test Bank: I
Topic:
Demand
60. A decrease in the demand for recreational fishing boats might be caused by an increase in
the
A. income of sports fishers.
61. Assume that the demand curve for product C is downsloping. If the price of C falls from
$2.00 to $1.75,
A. a smaller quantity of C will be demanded.
62. An increase in the quantity demanded means that

3-24
Copyright © 2018 McGraw-Hill Education. All rights reserved. No reproduction or distribution without the prior
written consent of McGraw-Hill Education.
C. the demand curve has shifted to the right.
D. the demand curve has shifted to the left.
63. An increase in product price will cause
D. the supply curve to shift to the left.
64. In moving along a demand curve, which of the following is not held constant?
D. prices of complementary goods
65. In which of the following statements are the terms “demand“ and “quantity demanded” used
correctly?
3-25
Copyright © 2018 McGraw-Hill Education. All rights reserved. No reproduction or distribution without the prior
written consent of McGraw-Hill Education.
A. When the price of ice cream rose, the demand for both ice cream and ice cream toppings fell.
B. When the price of ice cream rose, the quantity demanded of ice cream fell, and the demand
for ice cream toppings fell.
C. When the price of ice cream rose, the demand for ice cream fell, and the quantity demanded
of ice cream toppings fell.
D. None of these statements use the terms correctly.
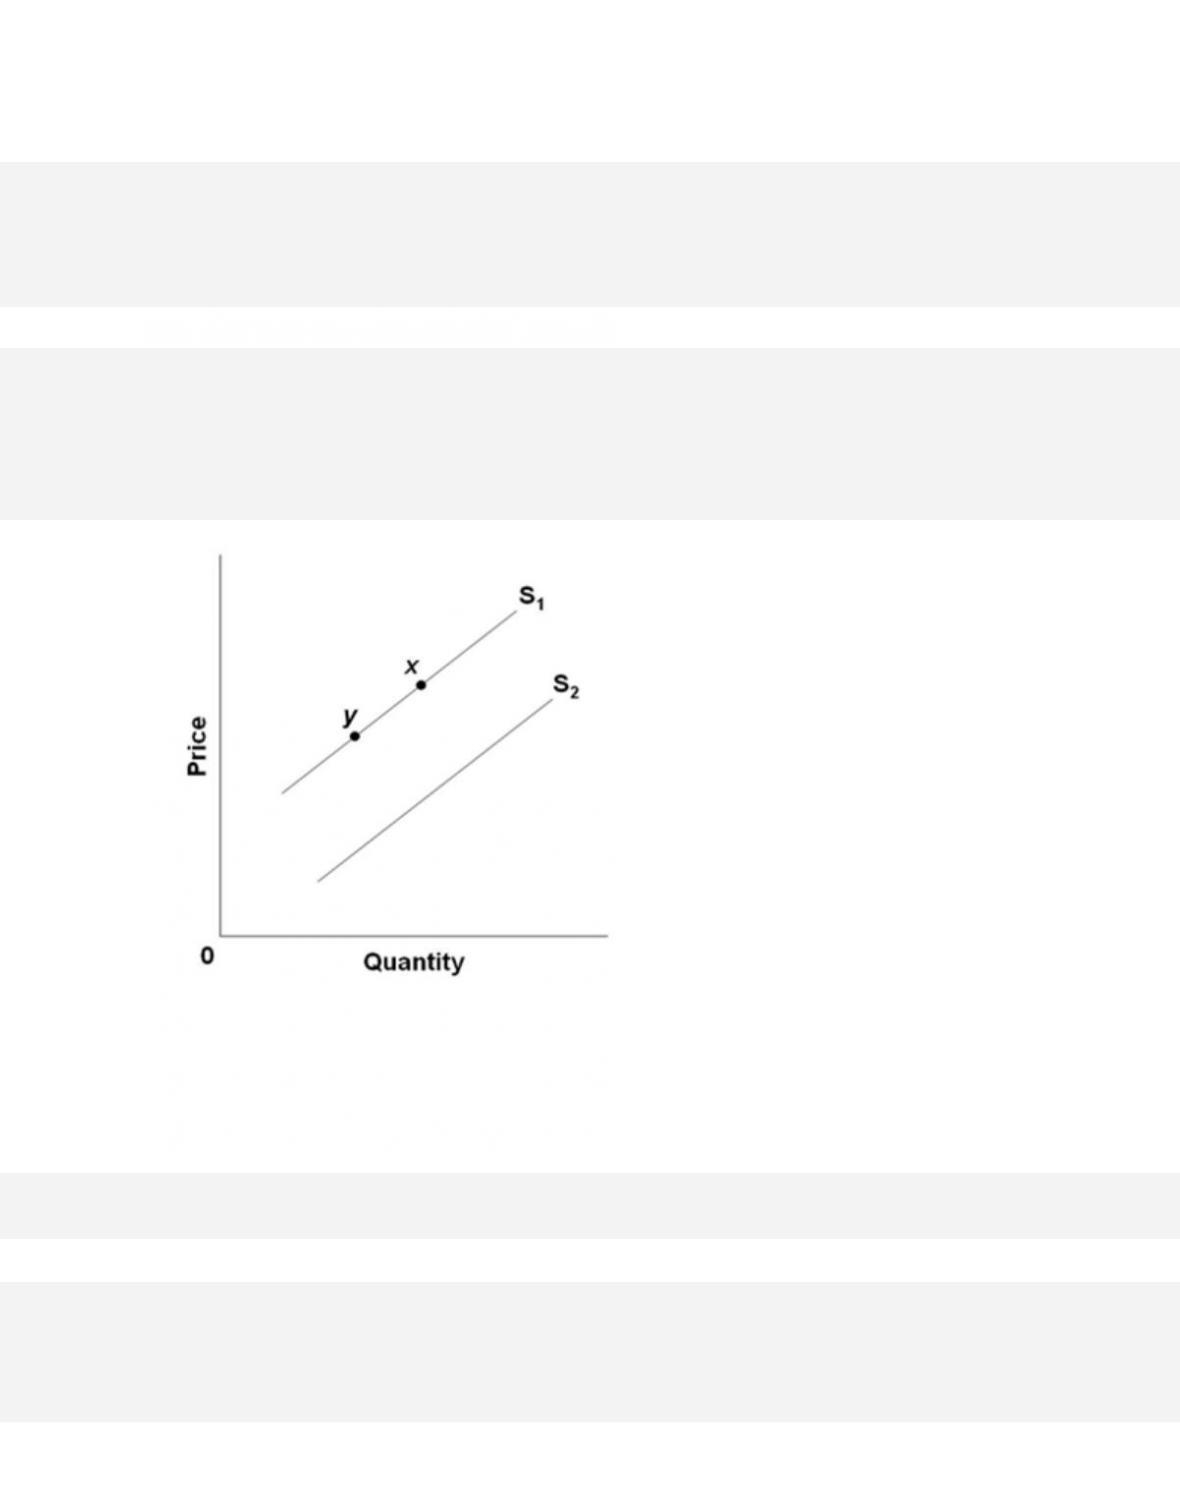
66.
Refer to the diagram. A decrease in supply is depicted by a
A. move from point x to point y.
B. Shift from S1 to S2.
3-26
Copyright © 2018 McGraw-Hill Education. All rights reserved. No reproduction or distribution without the prior
written consent of McGraw-Hill Education.
Learning Objective: 03–03 Describe supply and explain how it can change.
Test Bank: I
Topic:
Supply
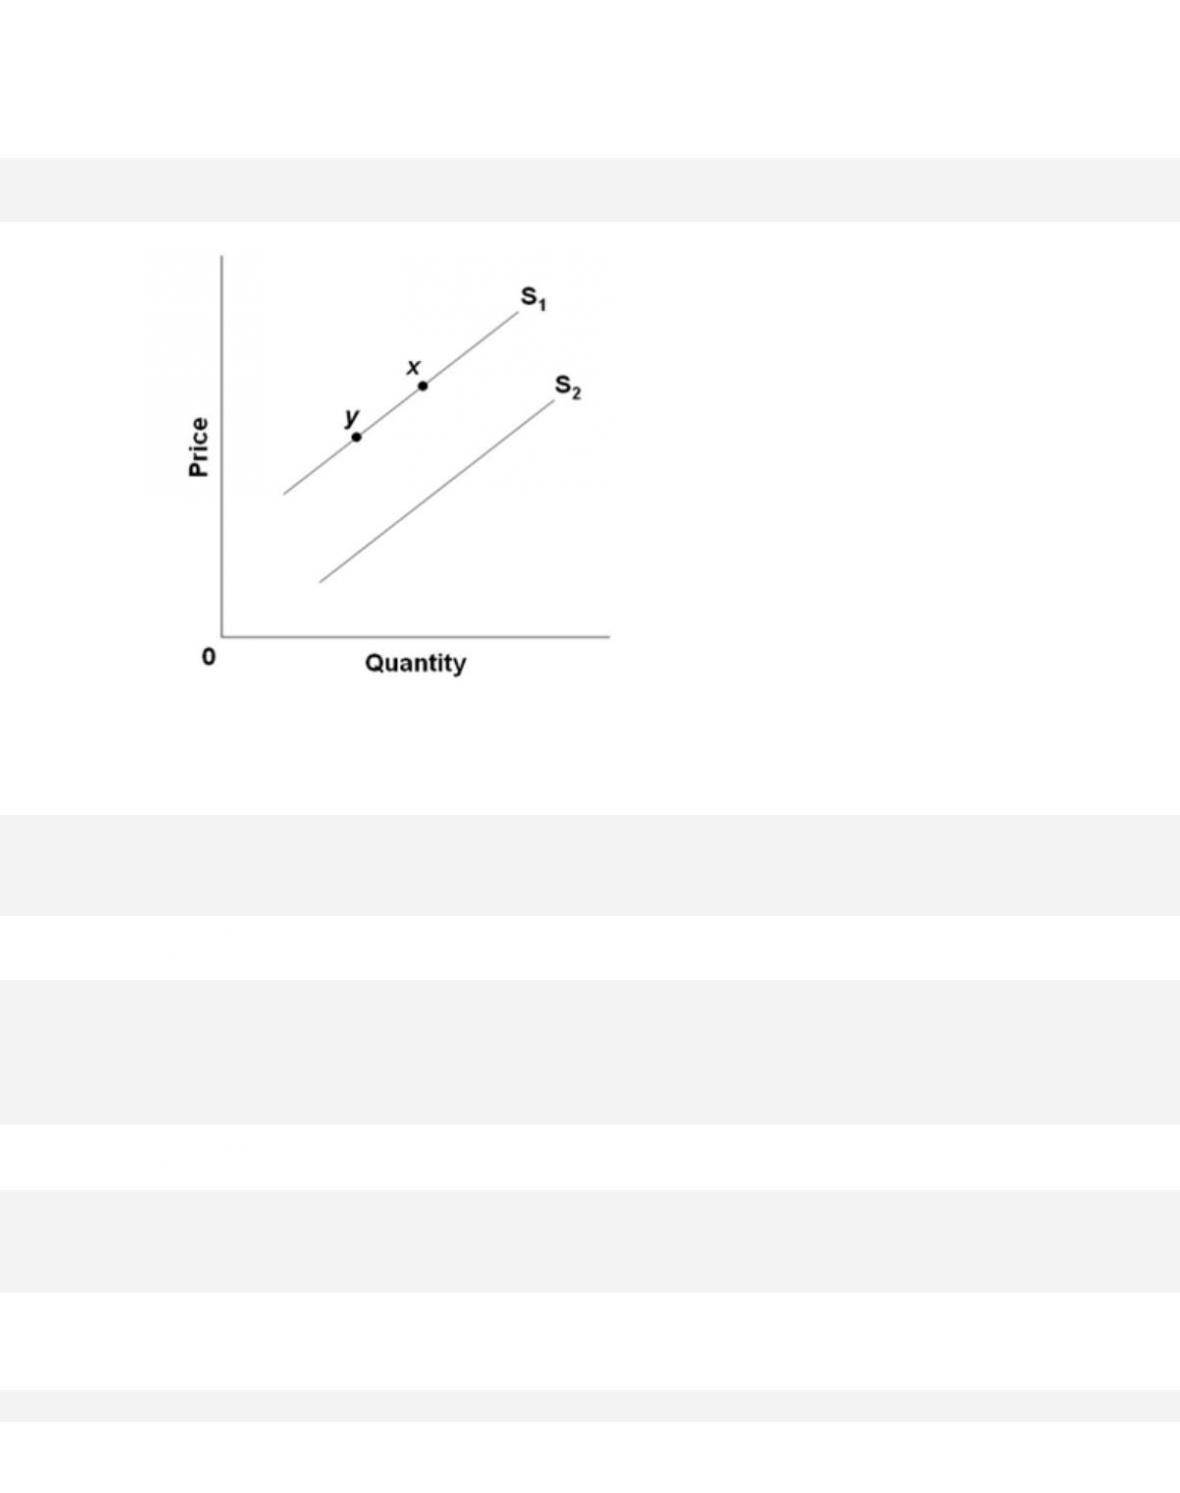
67.
Refer to the diagram. An increase in quantity supplied is depicted by a
D. move from point x to point y.
68. The law of supply indicates that, other things equal,
D. producers will offer more of a product at low prices than at high prices.
3-27
Copyright © 2018 McGraw-Hill Education. All rights reserved. No reproduction or distribution without the prior
written consent of McGraw-Hill Education.
AACSB: Knowledge Application
A c c e s s i b i l i t y :
Keyboard Navigation
Blooms: Understand
Diff iculty:
02 Medium
Learning Objective: 03–03 Describe supply and explain how it can change.
Test Bank: I
Topic:
Supply
69. The upward slope of the supply curve reflects the
A. principle of specialization in production.
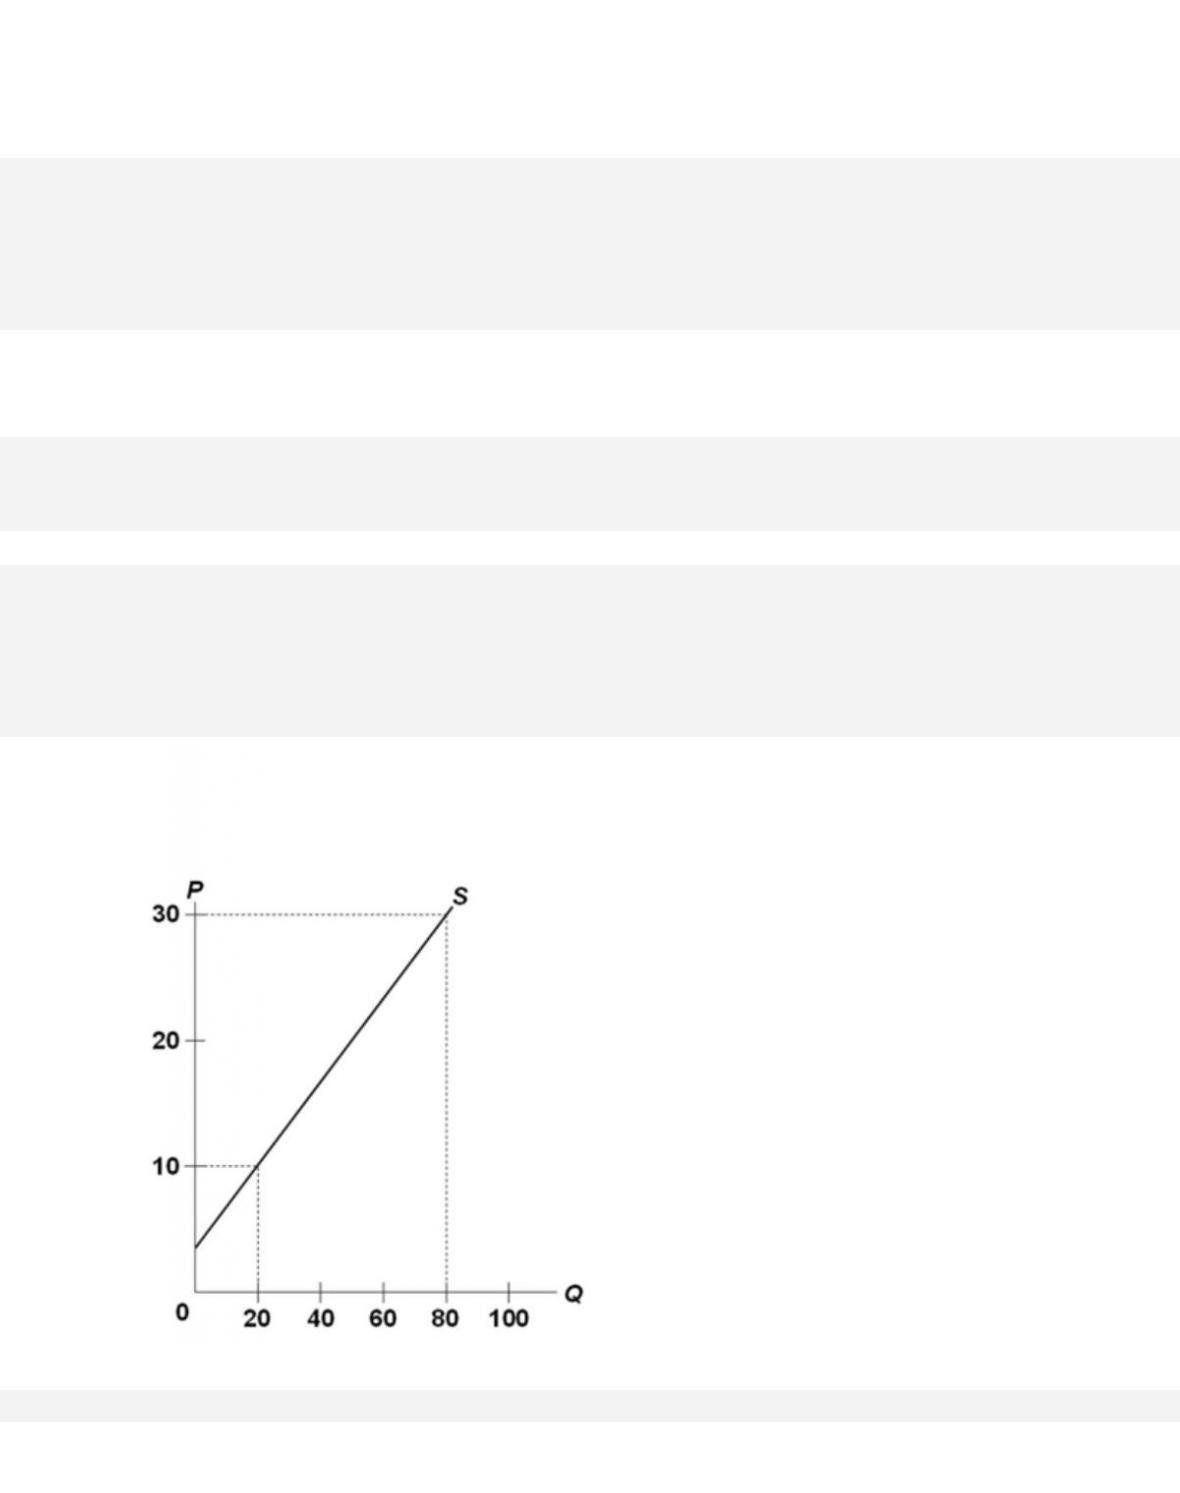
70. (Advanced analysis) The equation for the supply curve in the below diagram is
approximately

D. P = 4 – 3Q.
71. The supply curve shows the relationship between
D. physical inputs of resources and the resulting units of output.
72. A firm’s supply curve is upsloping because
A. the expansion of production necessitates the use of qualitatively inferior inputs.

73. Increasing marginal cost of production explains
A. the law of demand.
74. A leftward shift of a product supply curve might be caused by
A. an improvement in the relevant technique of production.
75. The location of the product supply curve depends on
D. the location of the demand curve.

76. An improvement in production technology will
A. increase equilibrium price.
77. Because of unseasonably cold weather, the supply of oranges has substantially decreased.
This statement indicates the
A. demand for oranges will necessarily rise.
78. If producers must obtain higher prices than before to produce a given level of output, then
the following has occurred.
A. a decrease in demand

3-31
Copyright © 2018 McGraw-Hill Education. All rights reserved. No reproduction or distribution without the prior
written consent of McGraw-Hill Education.
Learning Objective: 03–03 Describe supply and explain how it can change.
Test Bank: I
Topic:
Supply
79. In moving along a supply curve, which of the following is not held constant?
A. the number of firms producing this good
80. Assume product A is an input in the production of product B. In turn, product B is a
complement to product C. We can expect a decrease in the price of A to
D. increase the supply of B and decrease the demand for C.
81. Assume a drought in the Great Plains reduces the supply of wheat. Noting that wheat is a
basic ingredient in the production of bread, and potatoes are a consumer substitute for bread,
we would expect the price of wheat to

D. fall, the supply of bread to increase, and the demand for potatoes to increase.
82. Suppose product X is an input in the production of product Y. Product Y in turn is a
substitute for product Z. An increase in the price of X can be expected to
D. decrease the supply of Z.
83. Other things equal, if the price of a key resource used to produce product X falls, the
D. supply curve of product X will not shift.

84. When the price of oil declines significantly, the price of gasoline also declines. The latter
occurs because of a(n)
A. increase in the demand for gasoline.
85. An increase in the excise tax on cigarettes raises the price of cigarettes by shifting the
A. demand curve for cigarettes rightward.
86. A government subsidy to the producers of a product
D. increases product demand.

3-34
Copyright © 2018 McGraw-Hill Education. All rights reserved. No reproduction or distribution without the prior
written consent of McGraw-Hill Education.
Test Bank: I
Topic:
Supply
87. Suppose that at prices of $1, $2, $3, $4, and $5 for product Z, the corresponding quantities
supplied are 3, 4, 5, 6, and 7 units, respectively. Which of the following would increase the
quantities supplied of Z to, say, 6, 8, 10, 12, and 14 units at these prices?
D. increases in the incomes of the buyers of Z
88. Suppose that corn prices rise significantly. If farmers expect the price of corn to continue
rising relative to other crops, then we would expect
A. the supply of ethanol, a corn-based product, to increase.
89.
(1)
Qd
(2)
Qd
(3)
Price
(4)
Qs
(5)
Qs
50
40
$10
70
80
60
50
9
60
70
80
60
8
50
60
90
70
7
40
50

100
80
6
30
40
Refer to the table. If demand is represented by columns (3) and (1) and supply is represented by
columns (3) and (4), equilibrium price and quantity will be
A. $10 and 60 units.
90.
(1)
Qd
(2)
Qd
(3)
Price
(4)
Qs
(5)
Qs
50
40
$10
70
80
60
50
9
60
70
80
60
8
50
60
90
70
7
40
50
100
80
6
30
40
Refer to the table. In relation to column (3), a change from column (2) to column (1) would
indicate a(n)
D. decrease in supply.

3-36
Copyright © 2018 McGraw-Hill Education. All rights reserved. No reproduction or distribution without the prior
written consent of McGraw-Hill Education.
Learning Objective: 03-02 Describe demand and explain how it can change.
Learning Objective: 03–04 Relate how supply and demand interact to determine market
equilibrium.
Test Bank: I
Topic:
Demand
Topic: Market Equilibrium
91.
(1)
Qd
(2)
Qd
(3)
Price
(4)
Qs
(5)
Qs
50
40
$10
70
80
60
50
9
60
70
80
60
8
50
60
90
70
7
40
50
100
80
6
30
40
Refer to the table. In relation to column (3), a change from column (5) to column (4) would
indicate a(n)
A. increase in demand.
92.
(1)
Qd
(2)
Qd
(3)
Price
(4)
Qs
(5)
Qs
50
40
$10
70
80

60
50
9
60
70
80
60
8
50
60
90
70
7
40
50
100
80
6
30
40
Refer to the table. Suppose that demand is represented by columns (3) and (2) and supply is
represented by columns (3) and (5). If the price were artificially set at $9,
A. the market would clear.
93.
(1)
Qd
(2)
Qd
(3)
Price
(4)
Qs
(5)
Qs
50
40
$10
70
80
60
50
9
60
70
80
60
8
50
60
90
70
7
40
50
100
80
6
30
40
Refer to the table. Suppose that demand is represented by columns (3) and (2) and supply is
represented by columns (3) and (5). If the price were artificially set at $6,
A. the market would clear.

3-38
Copyright © 2018 McGraw-Hill Education. All rights reserved. No reproduction or distribution without the prior
written consent of McGraw-Hill Education.
Blooms: Remember
Di fficul ty:
01 Easy
Learning Objective: 03–06 Identify what government-set prices are and how they can cause
product surpluses and shortages.
Test Bank: I
Topic:
Application: Government-Set Prices
94.
(1)
Qd
(2)
Qd
(3)
Price
(4)
Qs
(5)
Qs
50
40
$10
70
80
60
50
9
60
70
80
60
8
50
60
90
70
7
40
50
100
80
6
30
40
Refer to the table. In relation to column (3), a change from column (1) to column (2) would
mostly likely be caused by
D. government subsidizing production of the good.
95.
(1)
Qd
(2)
Qd
(3)
Price
(4)
Qs
(5)
Qs
50
40
$10
70
80
3-39
60
50
9
60
70
80
60
8
50
60
90
70
7
40
50
100
80
6
30
40
Refer to the table. In relation to column (3), a change from column (4) to column (5) would most
likely be caused by
D. an increase in input prices.
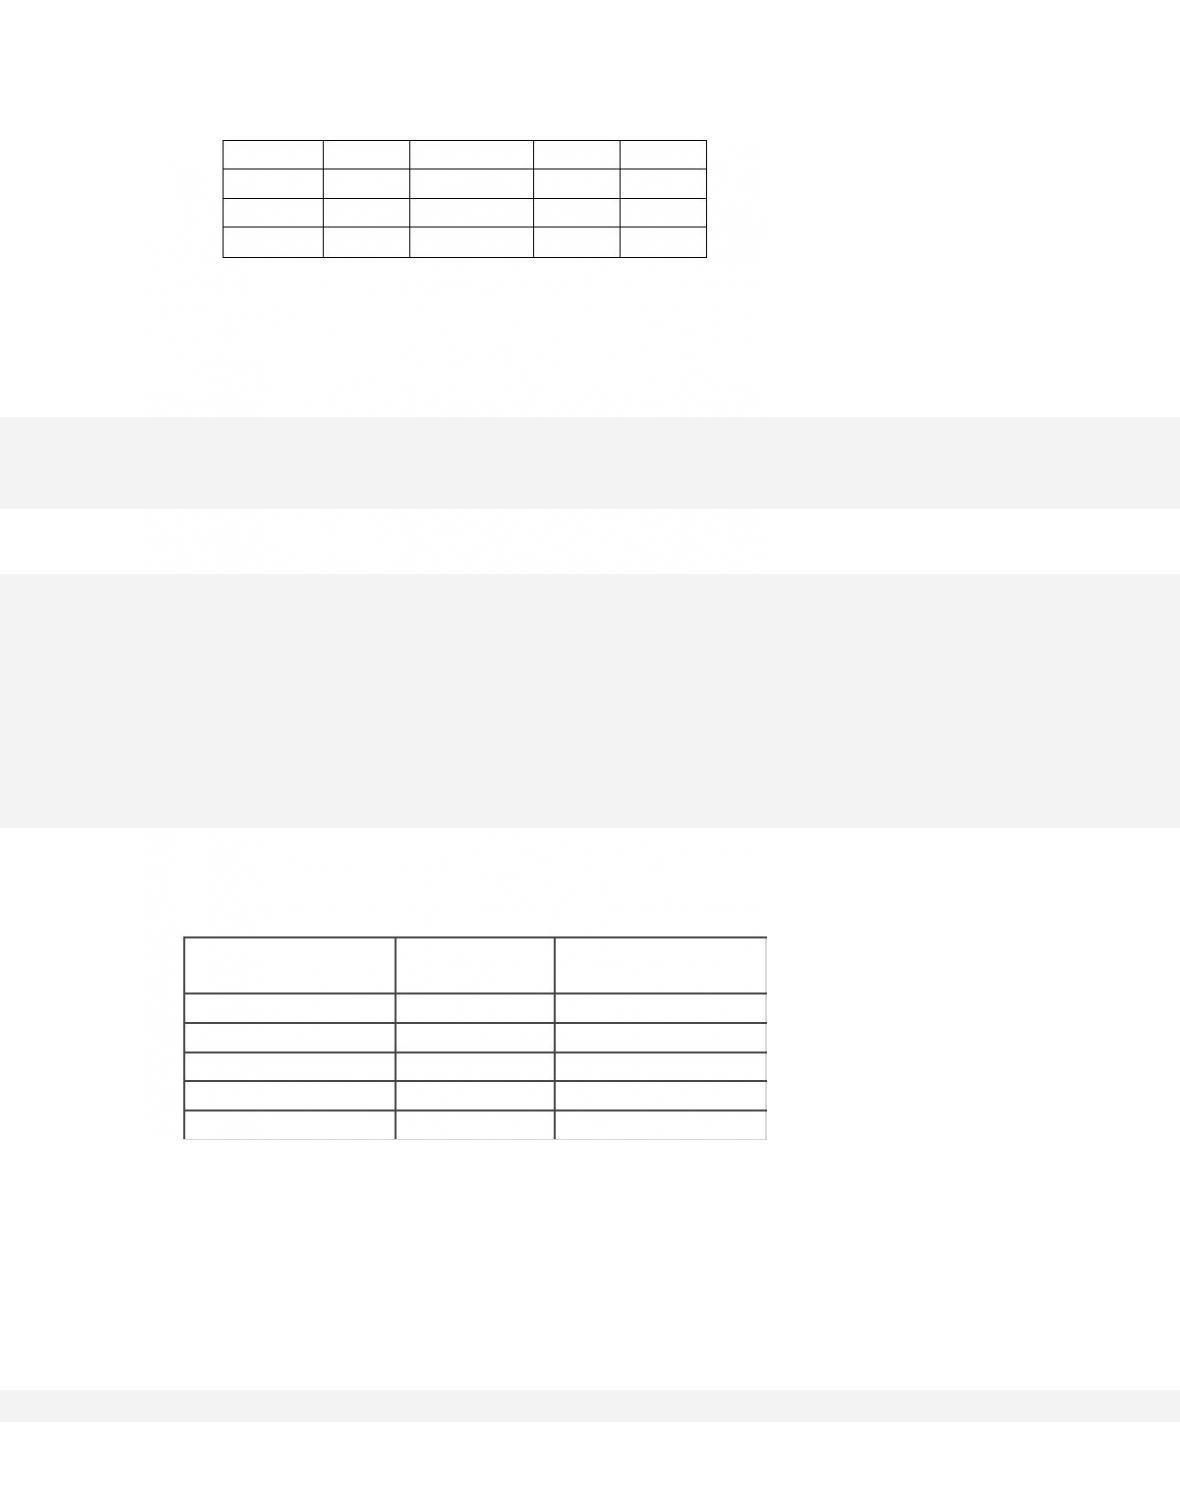
96. Answer the question on the basis of the given supply and demand data for wheat.
Bushels Demanded
Per Month
Price Per
Bushel
Bushels Supplied Per
Month
45
$5
77
50
4
73
56
3
68
61
2
61
67
1
57
Equilibrium price will be
A. $4.
B. $3.

3-40
Copyright © 2018 McGraw-Hill Education. All rights reserved. No reproduction or distribution without the prior
written consent of McGraw-Hill Education.
C. $2.
D. $1.
97. Answer the question on the basis of the given supply and demand data for wheat.
Bushels Demanded
Per Month
Price Per
Bushel
Bushels Supplied Per
Month
45
$5
77
50
4
73
56
3
68
61
2
61
67
1
57
If the price in this market was $4,
A. the market would clear; quantity demanded would equal quantity supplied.
98. Answer the question on the basis of the given supply and demand data for wheat.
Bushels Demanded
Price Per
Bushels Supplied Per