Chapter 03 Demand, Supply, and Market Equilibrium Answer Key
Multiple Choice Questions
1. A market
A. reflects upsloping demand and downsloping supply curves.
2. Markets, viewed from the perspective of the supply and demand model,
D. are approximated by markets in which a single seller determines price.
3. The law of demand states that, other things equal,
D. consumers will buy more of a product at high prices than at low prices.
3-2
Copyright © 2018 McGraw-Hill Education. All rights reserved. No reproduction or distribution without the prior
written consent of McGraw-Hill Education.
Learning Objective: 03–02 Describe demand and explain how it can change.
Test Bank: I
Top ic:
Demand
4. Graphically, the market demand curve is
A. steeper than any individual demand curve that is part of it.
B. greater than the sum of the individual demand curves.
5. The demand curve shows the relationship between
A. money income and quantity demanded.
B. price and production costs.
6. Economists use the term “demand” to refer to
A. a particular price-quantity combination on a stable demand curve.
B. the total amount spent on a particular commodity over a fixed time period.
3-3
Copyright © 2018 McGraw-Hill Education. All rights reserved. No reproduction or distribution without the prior
written consent of McGraw-Hill Education.
Diffic ulty:
02 Medium
Learning Objective: 03–02 Describe demand and explain how it can change.
Test Bank: I
Top ic:
Demand
7. The relationship between quantity supplied and price is , and the relationship between
quantity demanded and price is .
C. inverse; inverse
D. direct; direct
8. When the price of a product increases, a consumer is able to buy less of it with a given money
income. This describes the
A. cost effect.
B. inflationary effect.
9. A demand curve
A. shows the relationship between price and quantity supplied.
3-4
written consent of McGraw-Hill Education.
D. shows the relationship between income and spending.
10. An increase in the price of a product will reduce the amount of it purchased because
A. the higher price will signal to consumers that the good is of low quality.
B. the higher price means that real incomes have risen.
11. When the price of a product rises, consumers with a given money income shift their
purchases to other products whose prices are now relatively lower. This statement describes
A. an inferior good.
B. the rationing function of prices.
12. When the price of a product falls, the purchasing power of our money income rises and thus
permits consumers to purchase more of the product. This statement describes
3-5
A. an inferior good.
B. the rationing function of prices.
13. Because successive units of a good produce less and less additional satisfaction, the price
must fall to encourage a buyer to purchase more units of the good. This statement is most
consistent with which explanation for the law of demand?
D. the income effect
14. According to the concept of diminishing marginal utility, consumers will purchase more of a
good when the price falls because
A. substitutes are relatively more expensive.
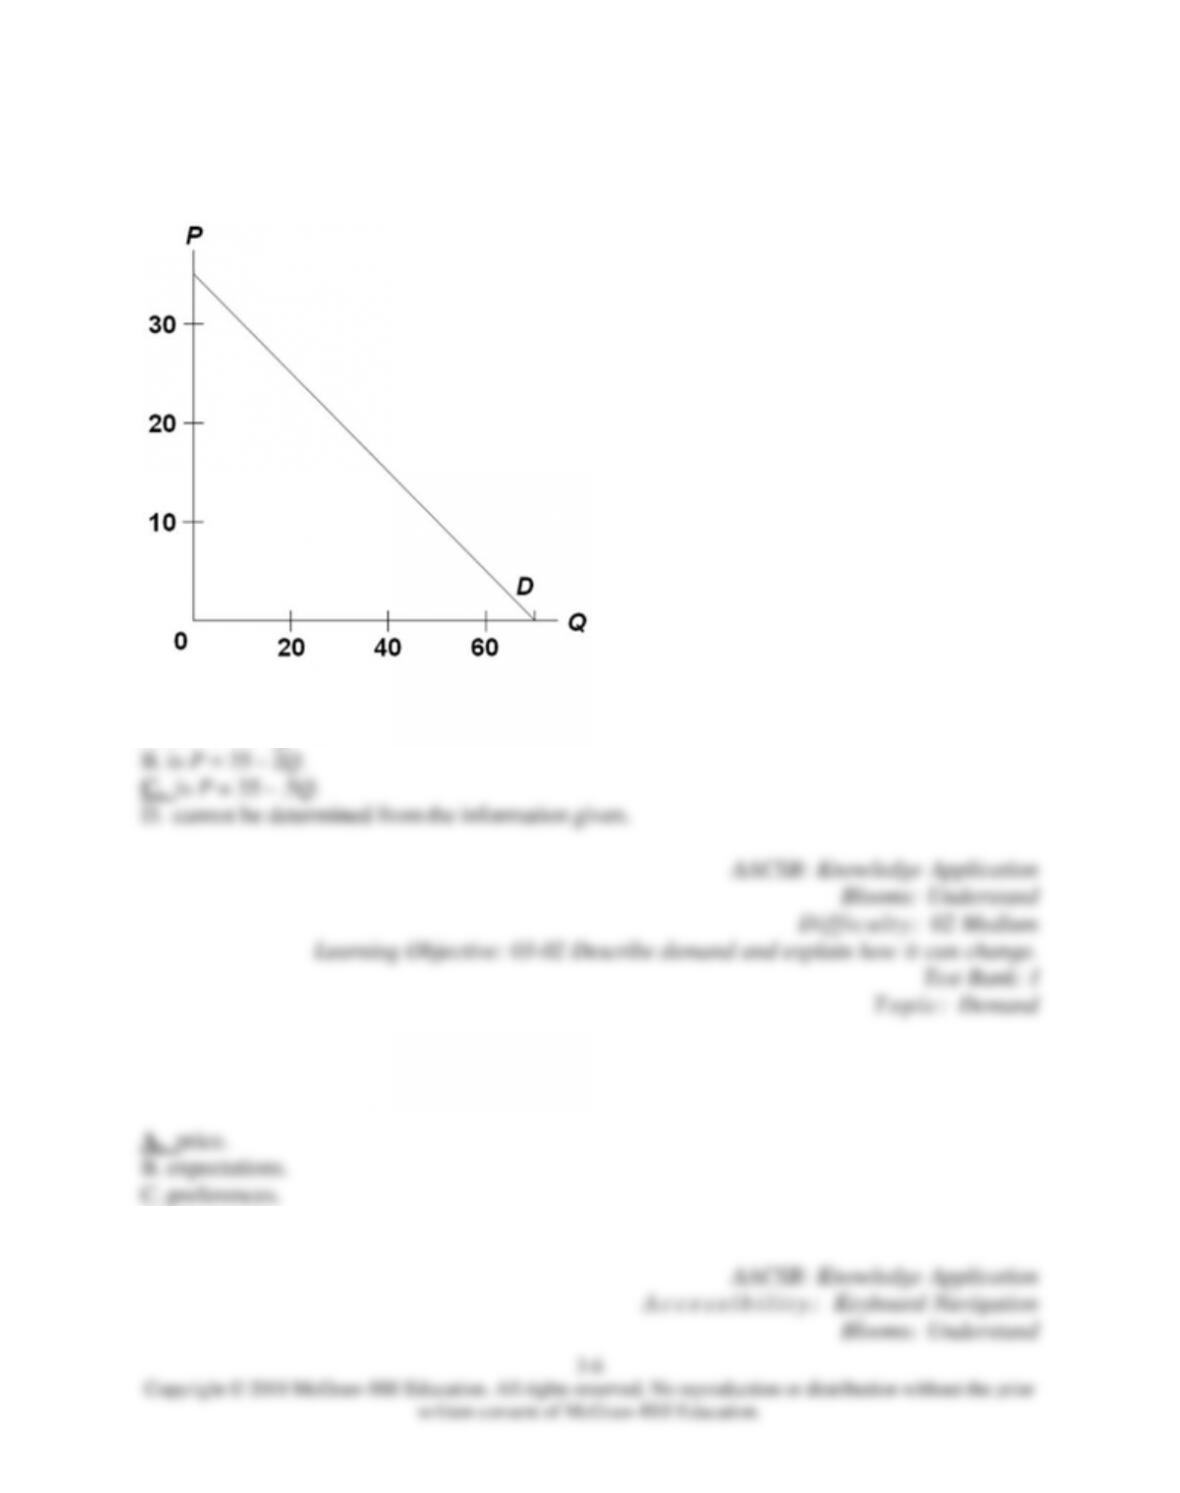
15. (Advanced analysis) The equation for the demand curve in the below diagram
A. is P = 70 – Q.
16. The construction of demand and supply curves assumes that the primary variable influencing
decisions to produce and purchase goods is
D. incomes.
3-7
Copyright © 2018 McGraw-Hill Education. All rights reserved. No reproduction or distribution without the prior
written consent of McGraw-Hill Education.
Diffic ulty:
02 Medium
Learning Objective: 03–02 Describe demand and explain how it can change.
Test Bank: I
Top ic:
Demand
17. One reason that the quantity demanded of a good increases when its price falls is that the
A. price decline shifts the supply curve to the left.
B. lower price shifts the demand curve to the left.
18. Steve went to his favorite hamburger restaurant with $3, expecting to buy a $2 hamburger
and a $1 soda. When he arrived, he discovered that hamburgers were on sale for $1 each, so
Steve bought two hamburgers and a soda. Steve’s response to the decrease in the price of
hamburgers is best explained by
A. the substitution effect.
19. When the price of Nike soccer balls fell, Ronaldo purchased more Nike soccer balls and
fewer adidas soccer balls. Which of the following best explains Ronaldo’s decision to buy
more Nike soccer balls?
3-8
Copyright © 2018 McGraw-Hill Education. All rights reserved. No reproduction or distribution without the prior
written consent of McGraw-Hill Education.
C. an increase in the demand for Nike soccer balls
D. the price effect
20. A recent study found that an increase in the federal tax on beer (which would increase the
price of beer) would reduce the demand for marijuana. Based on this information we can
conclude that
A. beer and marijuana are substitute goods.
21. In the past few years, the demand for donuts has greatly increased. This increase in demand
might best be explained by
A. an increase in the cost of making donuts.
B. an increase in the price of coffee.
22. Which of the following will not cause the demand for product K to change?
A. a change in the price of close-substitute product J
23. Which of the following would not shift the demand curve for beef?
A. a widely publicized study that indicates beef consumption increases one‘s cholesterol
24. In 2007, the price of oil increased, which in turn caused the price of natural gas to rise. This
can best be explained by saying that oil and natural gas are
A. complementary goods, and the higher price for oil increased the demand for natural gas.
Top ic:
Demand
25. An economist for a bicycle company predicts that, other things equal, a rise in consumer
incomes will increase the demand for bicycles. This prediction assumes that
A. there are many goods that are substitutes for bicycles.
B. there are many goods that are complementary to bicycles.
26. If two goods are complements,
A. they are consumed independently.
27. Blu-ray players and Blu-ray discs are
D. inferior goods.
3-11
Copyright © 2018 McGraw-Hill Education. All rights reserved. No reproduction or distribution without the prior
written consent of McGraw-Hill Education.
Learning Objective: 03–02 Describe demand and explain how it can change.
Test Bank: I
Top ic:
Demand
28. If the demand curve for product B shifts to the right as the price of product A declines, then
A. both A and B are inferior goods.
29. If the price of product L increases, the demand curve for close-substitute product J will
A. shift downward toward the horizontal axis.
30. Which of the following is most likely to be an inferior good?
A. gold watches
3-12
Copyright © 2018 McGraw-Hill Education. All rights reserved. No reproduction or distribution without the prior
written consent of McGraw-Hill Education.
Diffic ulty:
02 Medium
Learning Objective: 03–02 Describe demand and explain how it can change.
Test Bank: I
Top ic:
Demand
31. Which of the following statements is correct?
D. A decline in the price of X will increase the demand for substitute product Y.
32. A shift to the right in the demand curve for product A can be most reasonably explained by
saying that
A. consumer incomes have declined, and consumers now want to buy less of A at each possible
price.
33. Which of the following will cause the demand curve for product A to shift to the left?
A. population growth that causes an expansion in the number of persons consuming A
3-13
Copyright © 2018 McGraw-Hill Education. All rights reserved. No reproduction or distribution without the prior
written consent of McGraw-Hill Education.
AACSB: Knowledge Application
A c c e s s i b i l i t y :
Keyboard Navigation
Blooms: Understand
Diffic ulty:
02 Medium
Learning Objective: 03–02 Describe demand and explain how it can change.
Test Bank: I
Top ic:
Demand
34. If X is a normal good, a rise in money income will shift the
A. supply curve for X to the left.
35. If Z is an inferior good, an increase in money income will shift the
A. supply curve for Z to the left.
36. College students living off-campus frequently consume large amounts of ramen noodles and
boxed macaroni and cheese. When they finish school and start careers, their consumption of
both goods frequently declines. This suggests that ramen noodles and boxed macaroni and
cheese are
3-14
Copyright © 2018 McGraw-Hill Education. All rights reserved. No reproduction or distribution without the prior
written consent of McGraw-Hill Education.
A. inferior goods.
B. normal goods.
C. complementary goods.
D. substitute goods.
37. Other things equal, which of the following might shift the demand curve for gasoline to the
left?
A. the discovery of vast new oil reserves in Montana
38. Running shoes and staplers are
A. substitute goods.
39. The demand for most products varies directly with changes in consumer incomes. Such
products are known as
A. complementary goods.
40. Assume the demand curve for product X shifts to the right. This might be caused by
D. an increase in the price of Y if X and Y are complementary goods.
41. Digital cameras and memory cards are
A. substitute goods.
Top ic:
Demand
42. A decrease in the price of digital cameras will
A. cause the demand curve for memory cards to become vertical.
43. A normal good is one
A. whose amount demanded will increase as its price decreases.
44. If the demand for steak (a normal good) shifts to the left, the most likely reason is that
D. the price of cattle feed has gone up.
3-17
Copyright © 2018 McGraw-Hill Education. All rights reserved. No reproduction or distribution without the prior
written consent of McGraw-Hill Education.
Test Bank: I
Top ic:
Demand
45. If consumer incomes increase, the demand for product X
A. will necessarily remain unchanged.
46. If products A and B are complements and the price of B decreases, the
A. demand curves for both A and B will shift to the left.
B. amount of B purchased will increase, but the demand curve for A will not shift.
47. If products C and D are close substitutes, an increase in the price of C will
A. tend to cause the price of D to fall.
3-18
Copyright © 2018 McGraw-Hill Education. All rights reserved. No reproduction or distribution without the prior
written consent of McGraw-Hill Education.
Learning Objective: 03–02 Describe demand and explain how it can change.
Test Bank: I
Top ic:
Demand
48. In constructing a demand curve for product X,
A. consumer preferences are allowed to vary.
49. An inferior good is
A. one whose demand curve will shift rightward as incomes rise.
50. Suppose an excise tax is imposed on product X. We expect this tax to
A. increase the demand for complementary good Y and decrease the demand for substitute
product Z.
3-19
Copyright © 2018 McGraw-Hill Education. All rights reserved. No reproduction or distribution without the prior
written consent of McGraw-Hill Education.
Blooms: Understand
Diffic ulty:
02 Medium
Learning Objective: 03–02 Describe demand and explain how it can change.
Test Bank: I
Top ic:
Demand
51. An increase in the price of product A will
A. reduce the demand for resources used in the production of A.
52. Which of the following would most likely increase the demand for gasoline?
D. a decrease in the price of public transportation
53. Suppose that tacos and pizza are substitutes, and that soda and pizza are complements. We
would expect an increase in the price of pizza to
A. reduce the demand for tacos and increase the demand for soda.
3-20
Copyright © 2018 McGraw-Hill Education. All rights reserved. No reproduction or distribution without the prior
written consent of McGraw-Hill Education.
AACSB: Knowledge Application
A c c e s s i b i l i t y :
Keyboard Navigation
Blooms: Understand
Diffic ulty:
02 Medium
Learning Objective: 03–02 Describe demand and explain how it can change.
Test Bank: I
Top ic:
Demand
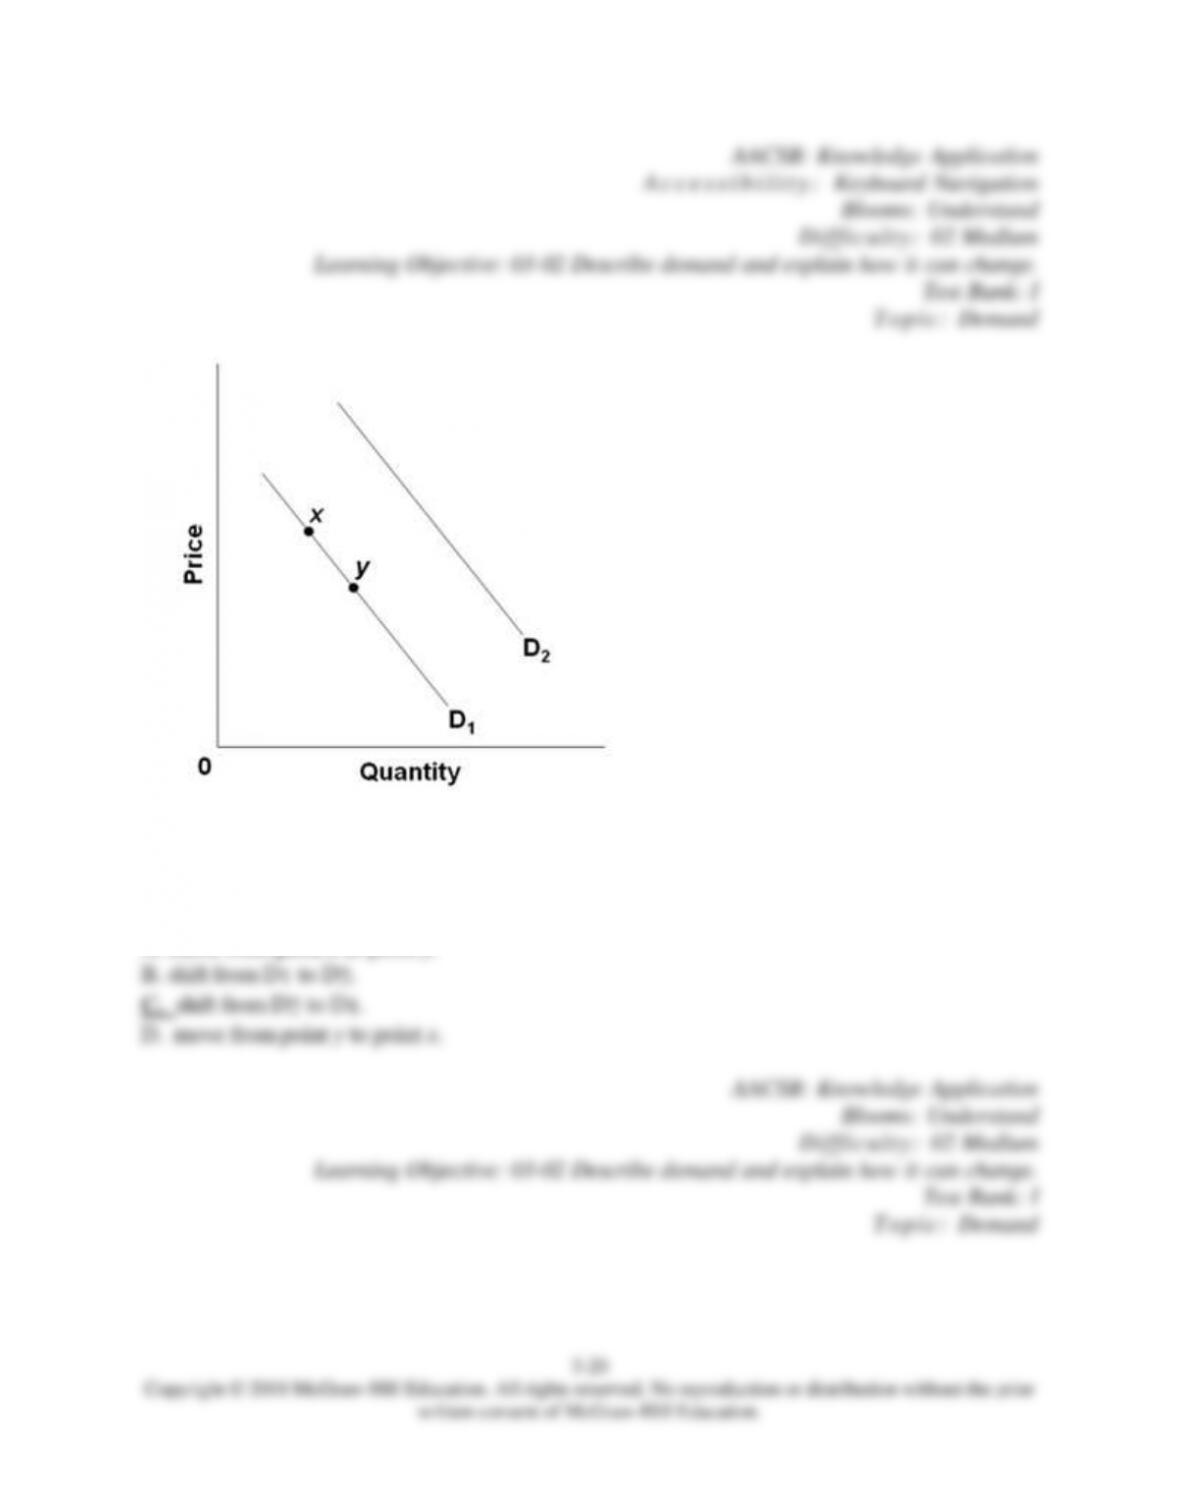
54.
Refer to the diagram. A decrease in demand is depicted by a
A. move from point x to point y.