1-141
264.
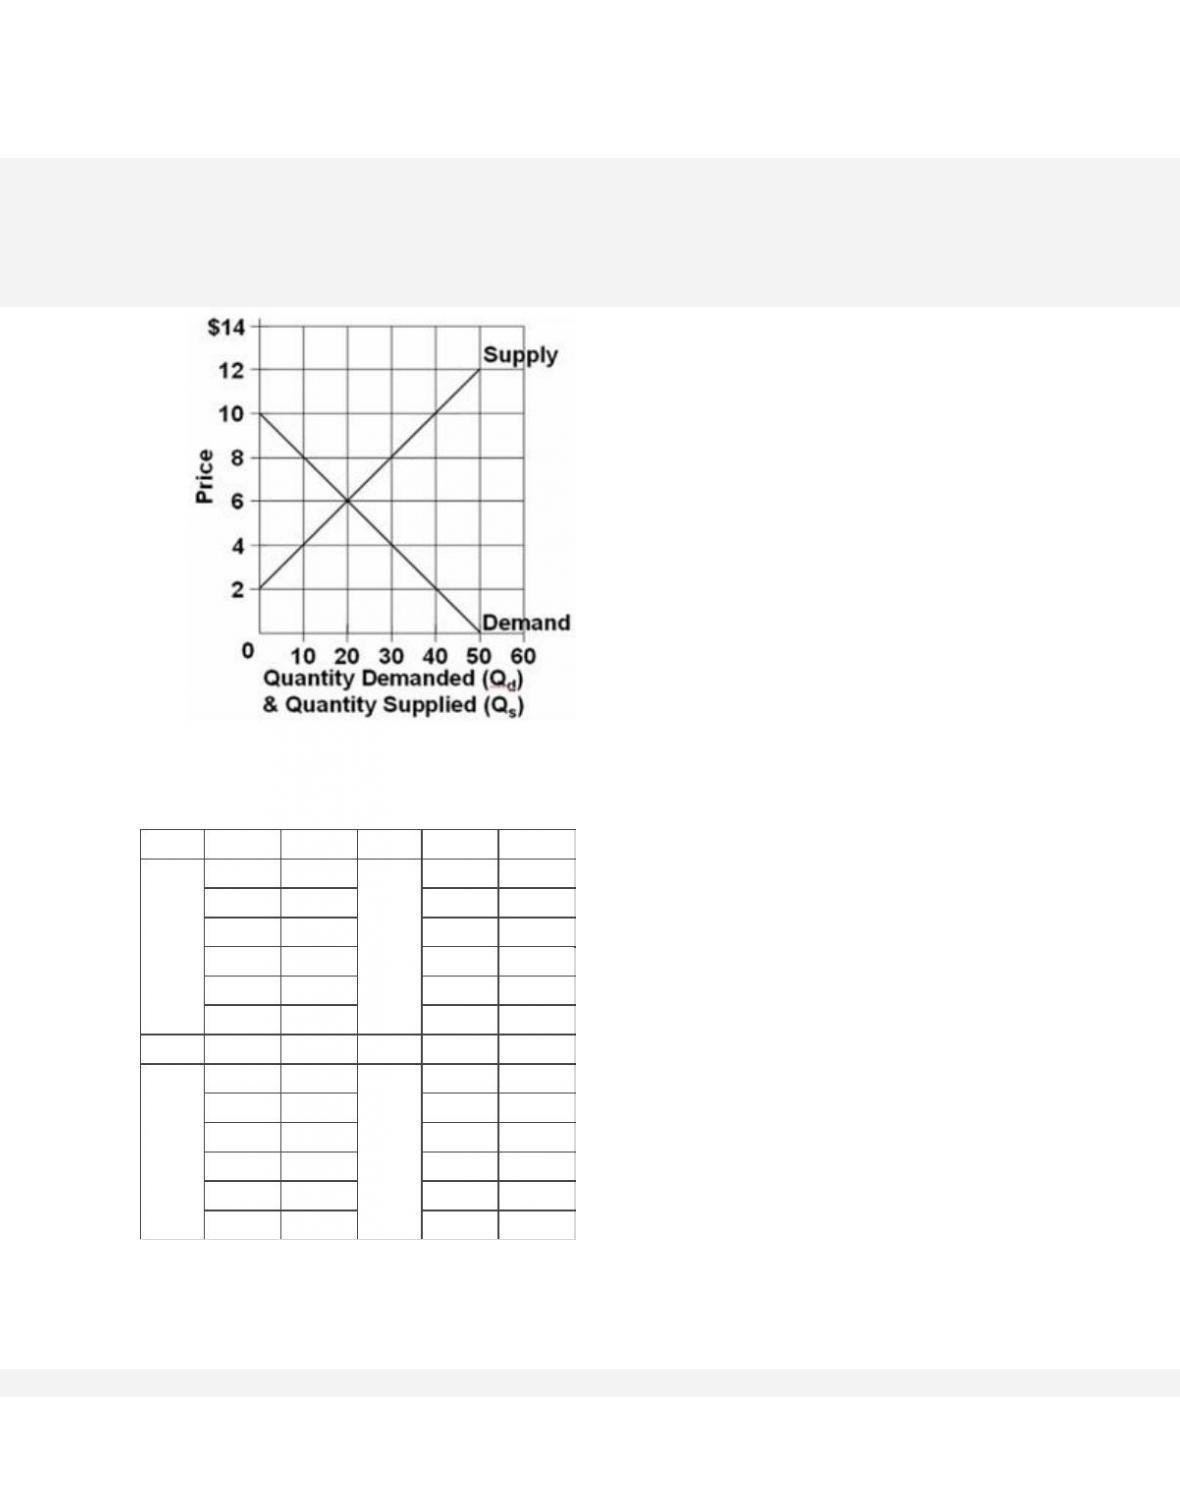
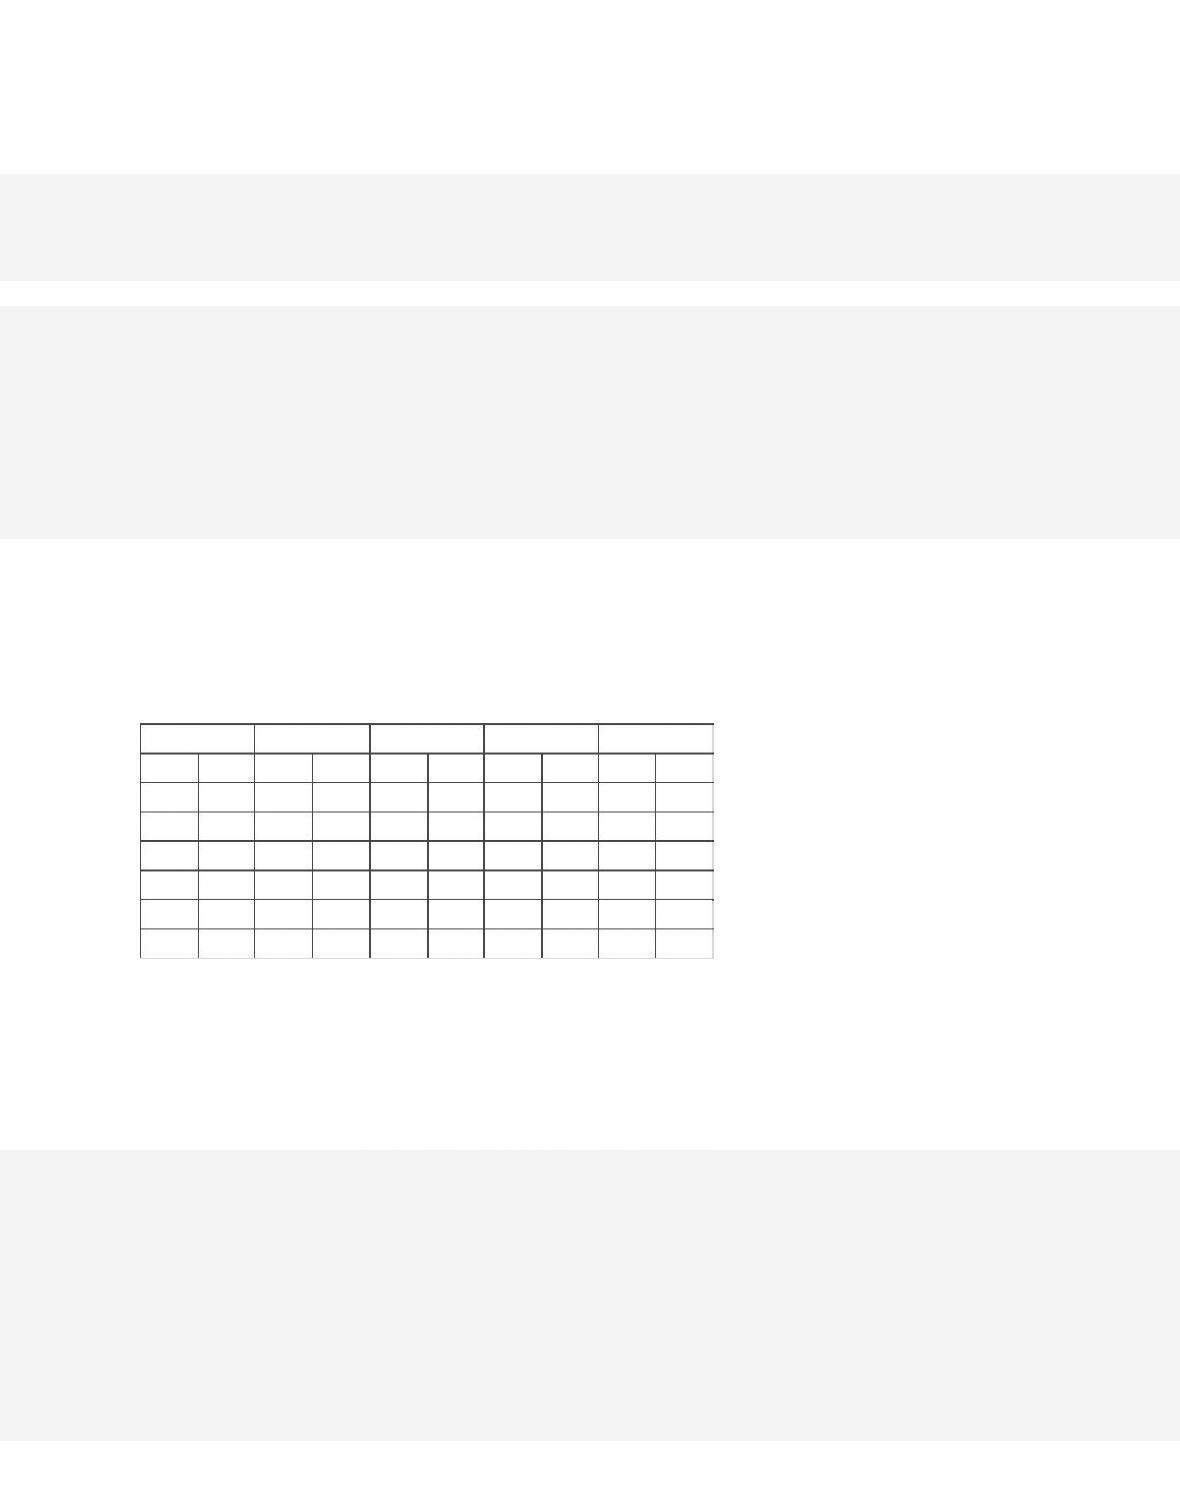
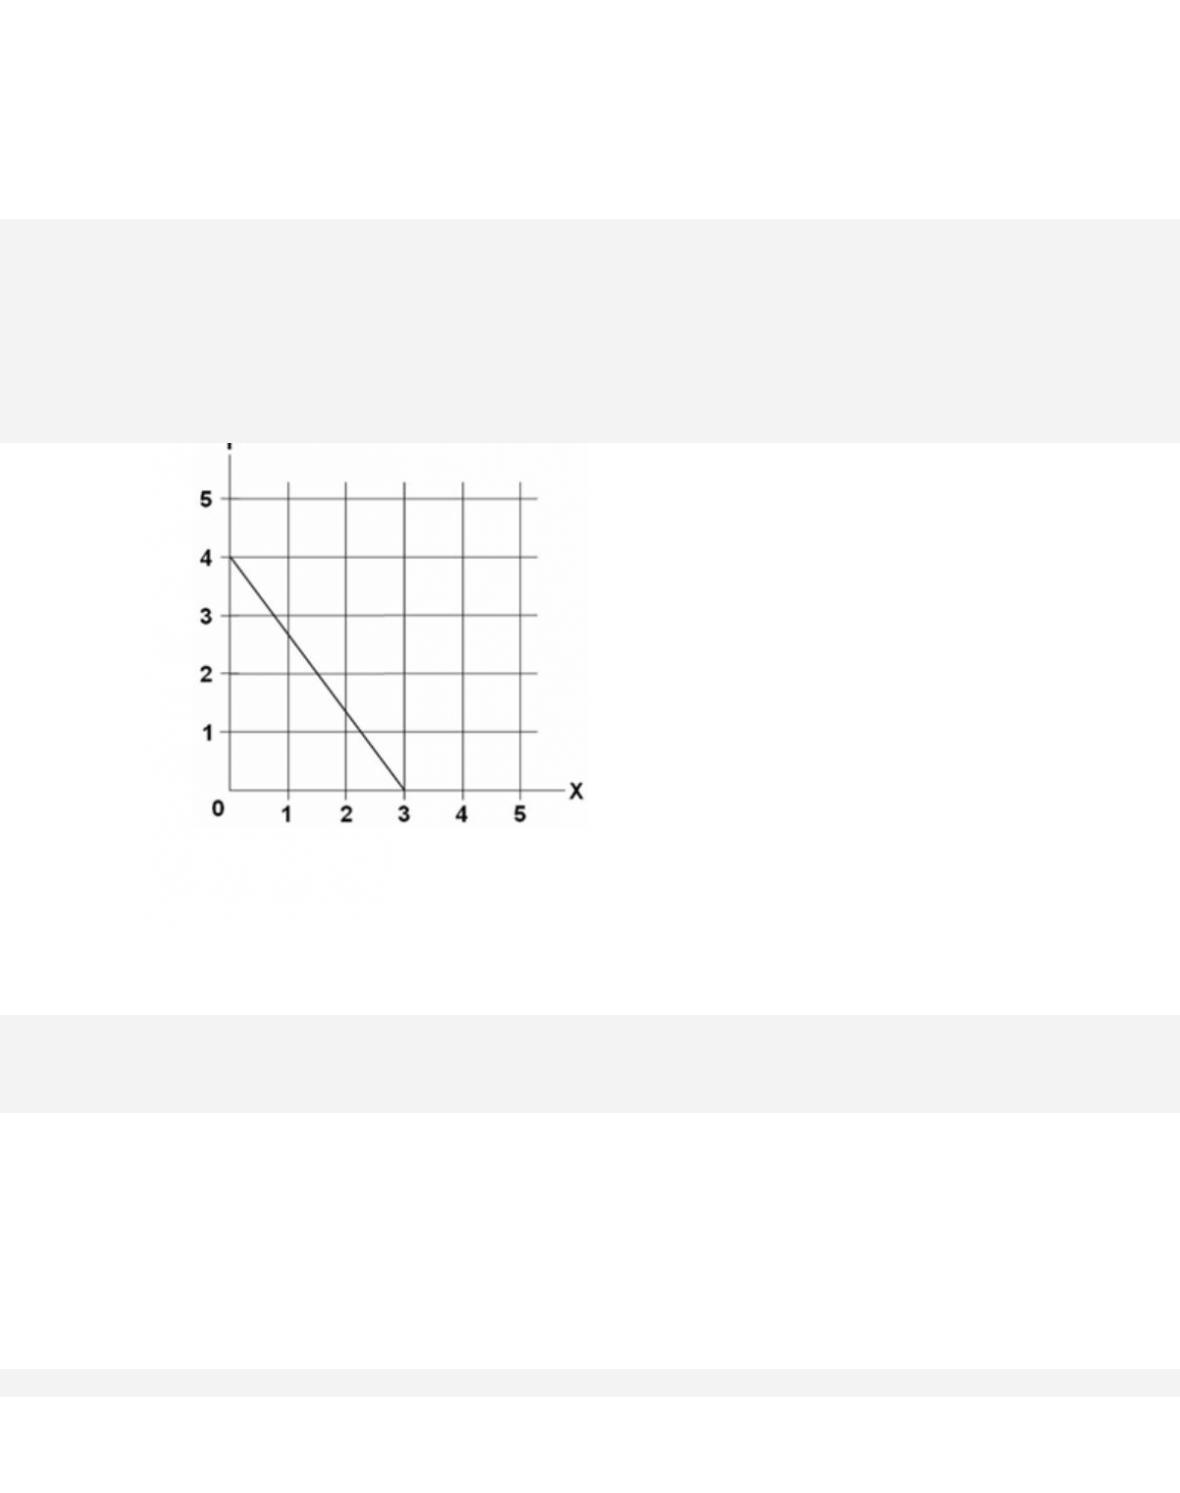
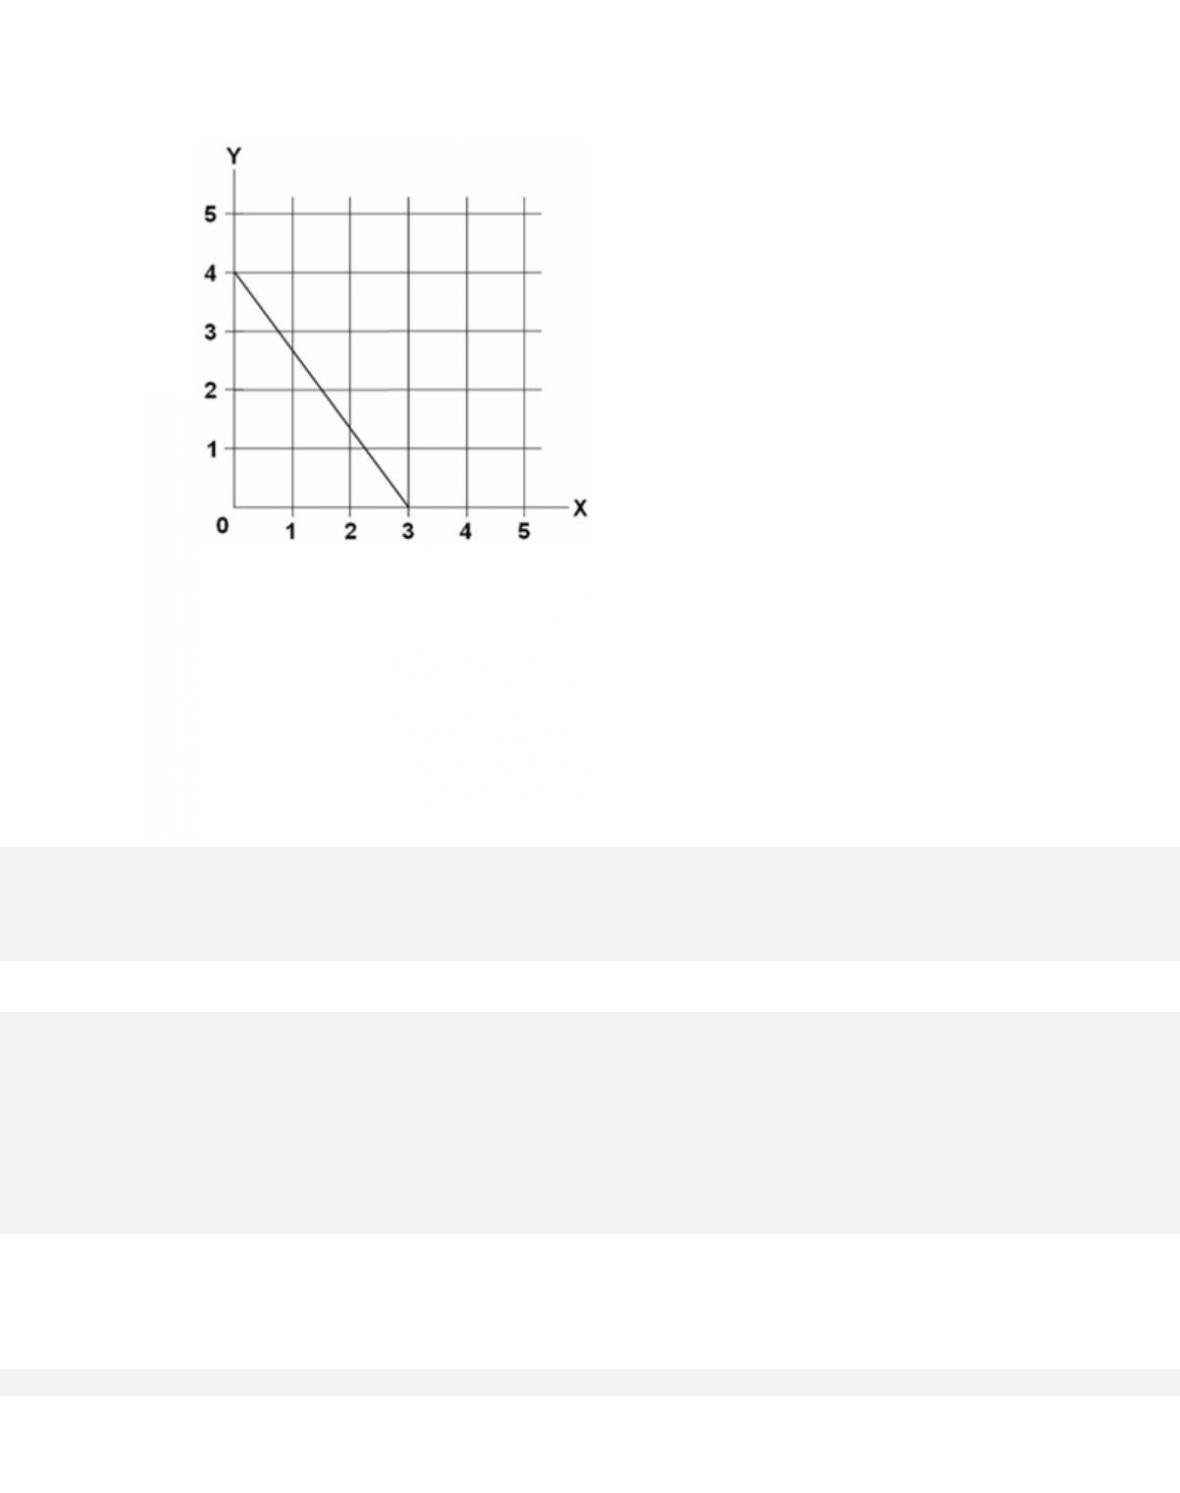
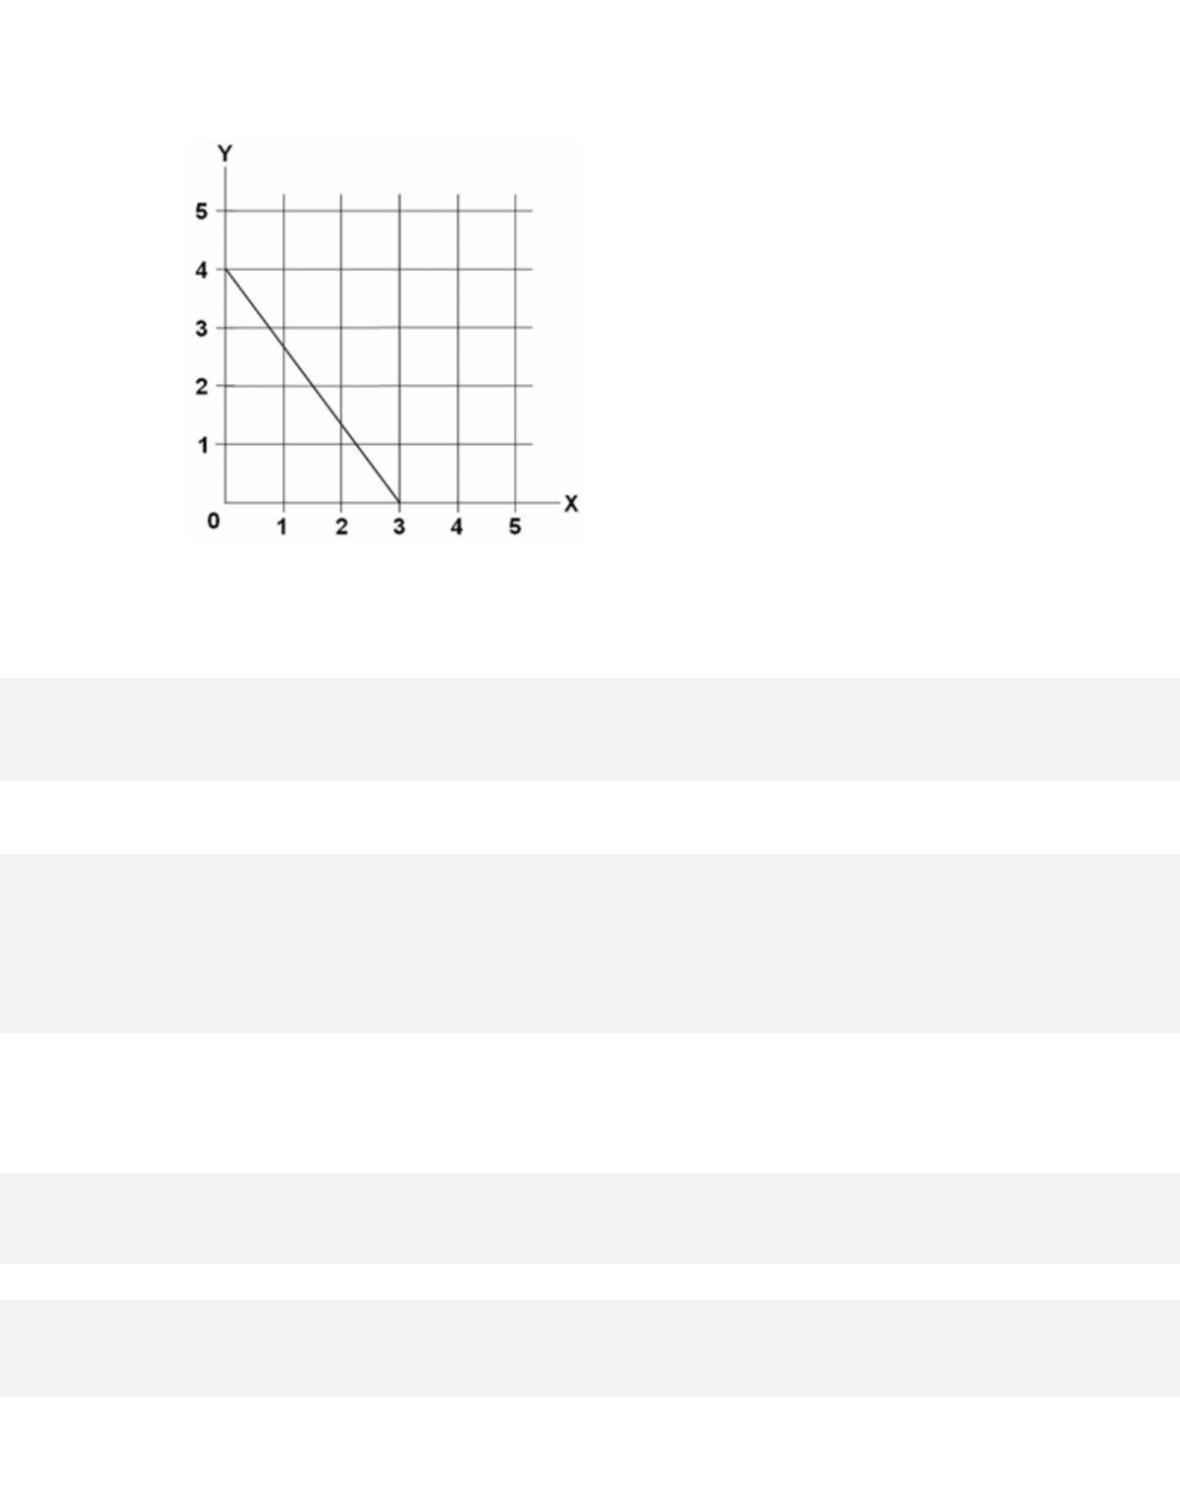
Refer to the graph. Which of the following schedules correctly reflects “supply”?
A)
P
Qs
B)
P
Qs
$12
50
$14
50
10
30
12
40
8
10
10
30
6
0
8
20
4
0
6
10
2
0
4
0
C)
P
Qs
D)
P
Qs
$12
50
$12
0
10
40
10
0
8
30
8
10
6
20
6
20
4
10
4
30
2
0
2
40
A.
option A
B.
option B
265.
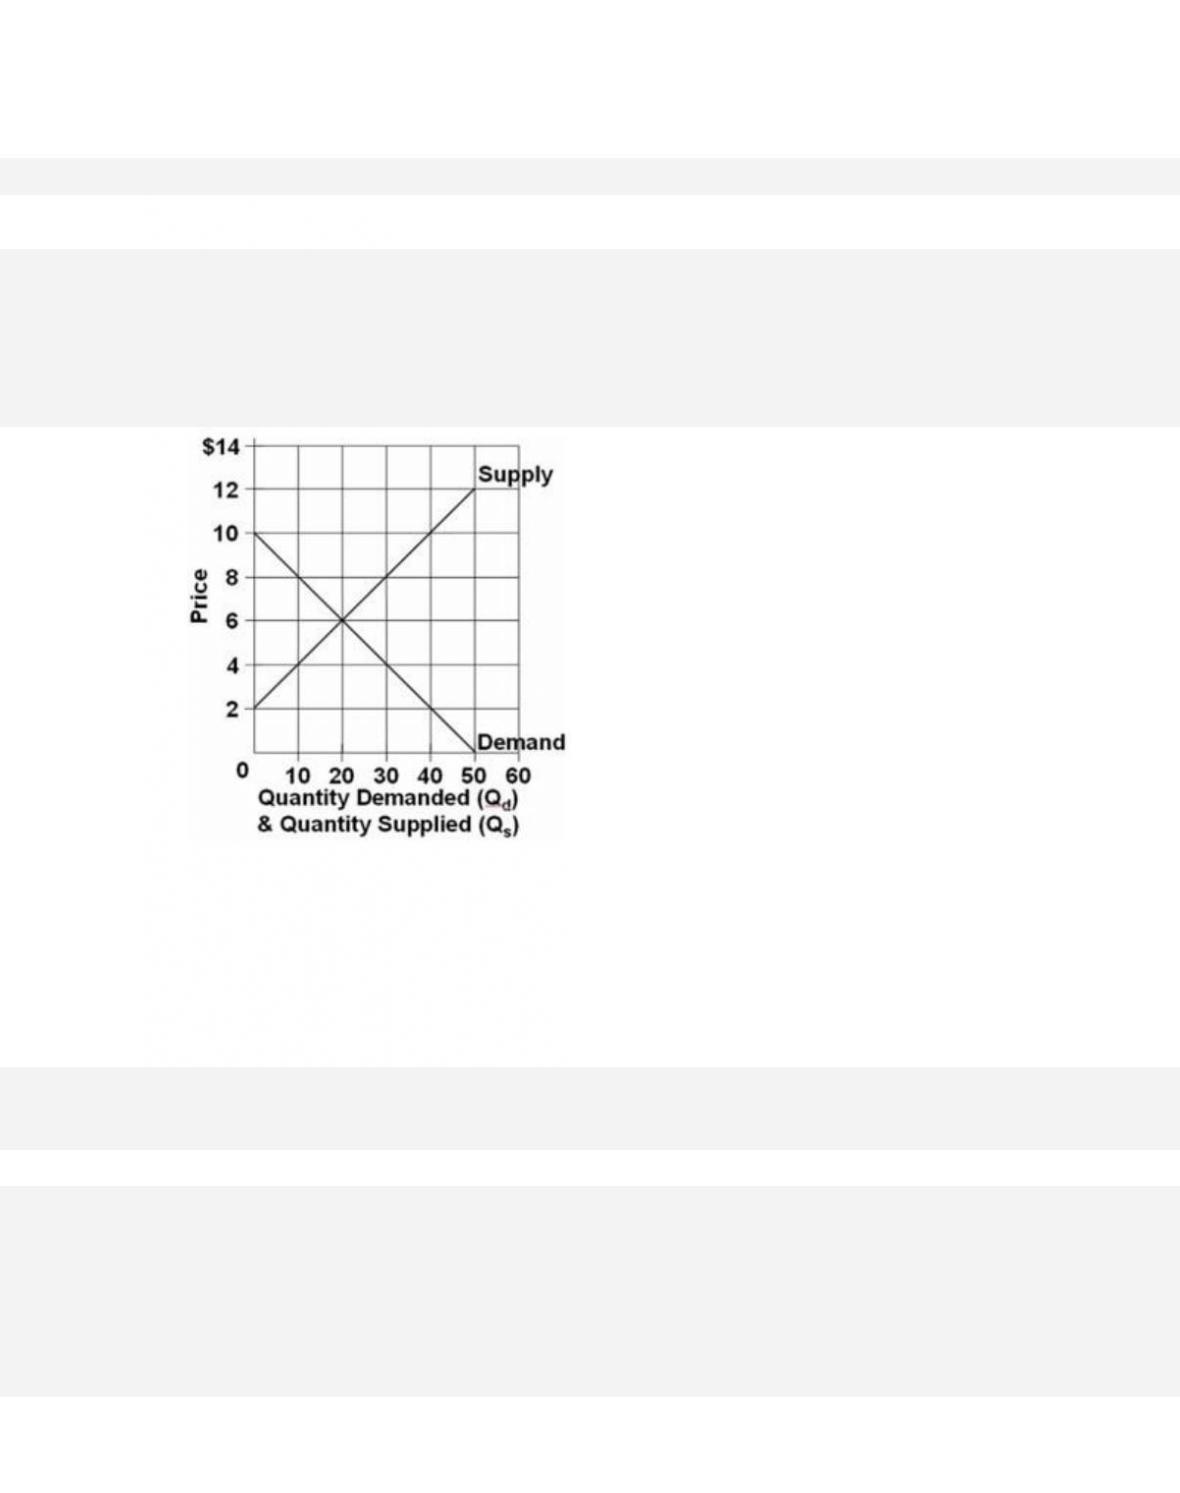
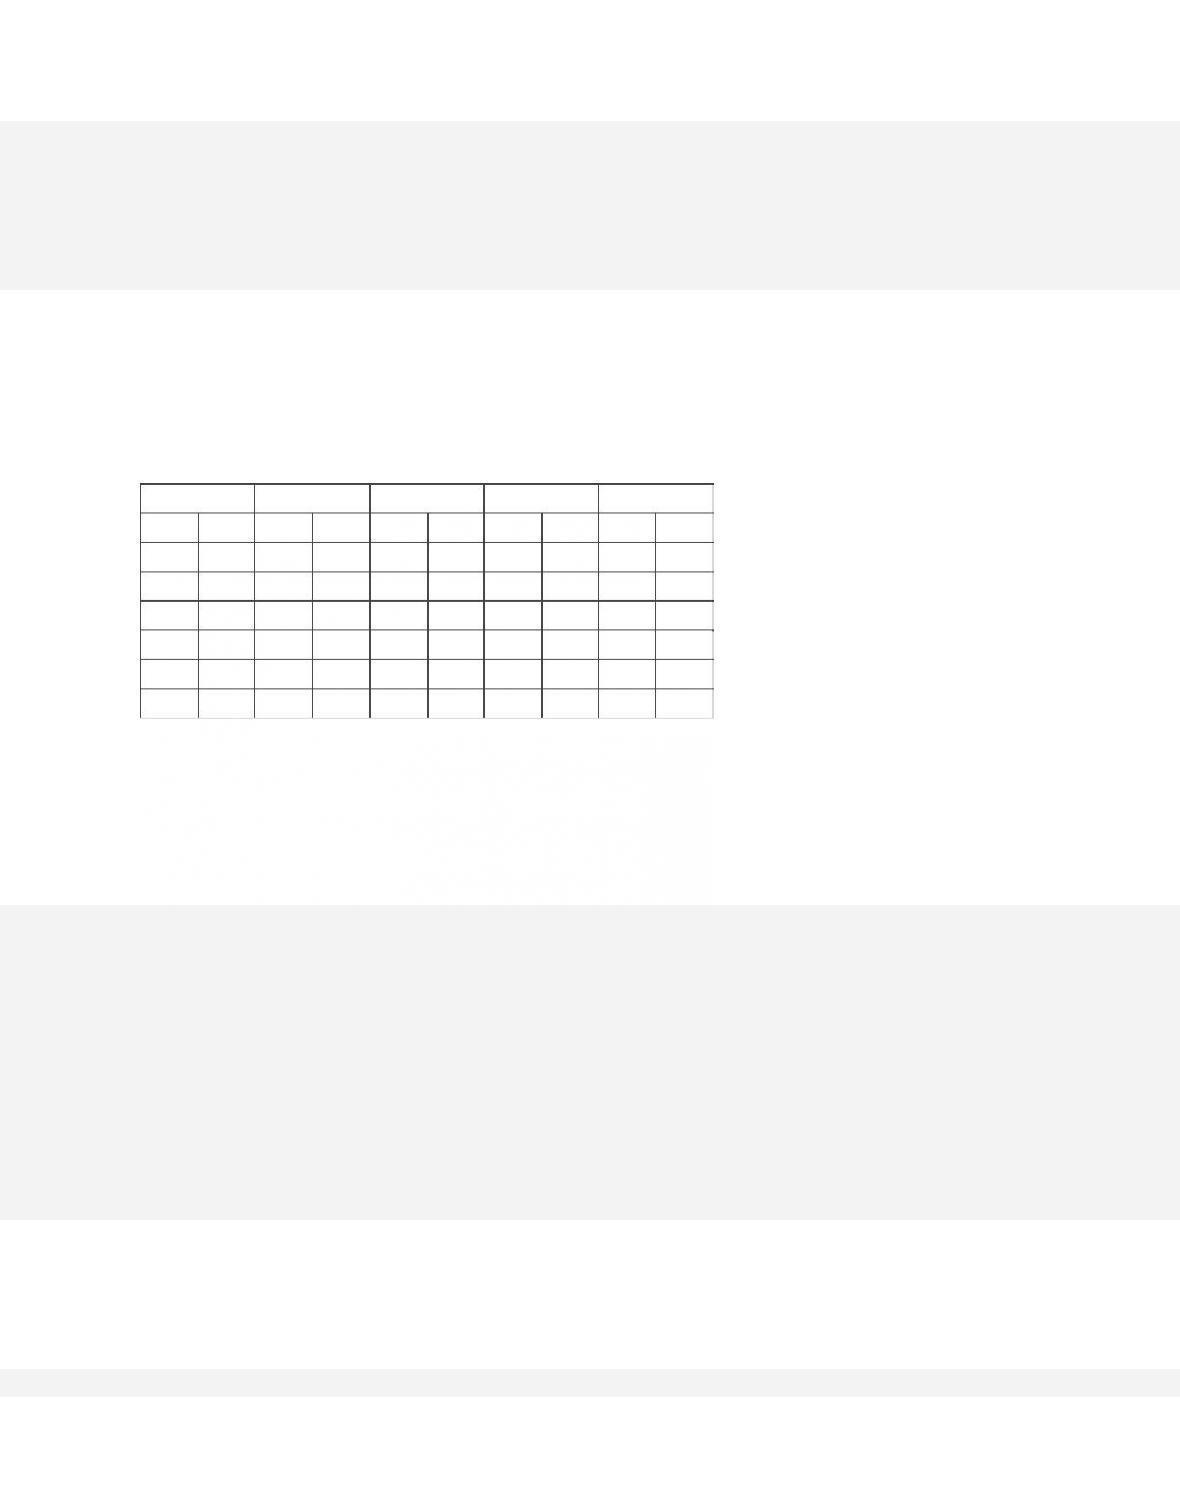
Refer to the graph. Using Qd for quantity demanded and P for price, which of the following
equations correctly states the demand for this product?
A. P = Qd/10
1-143
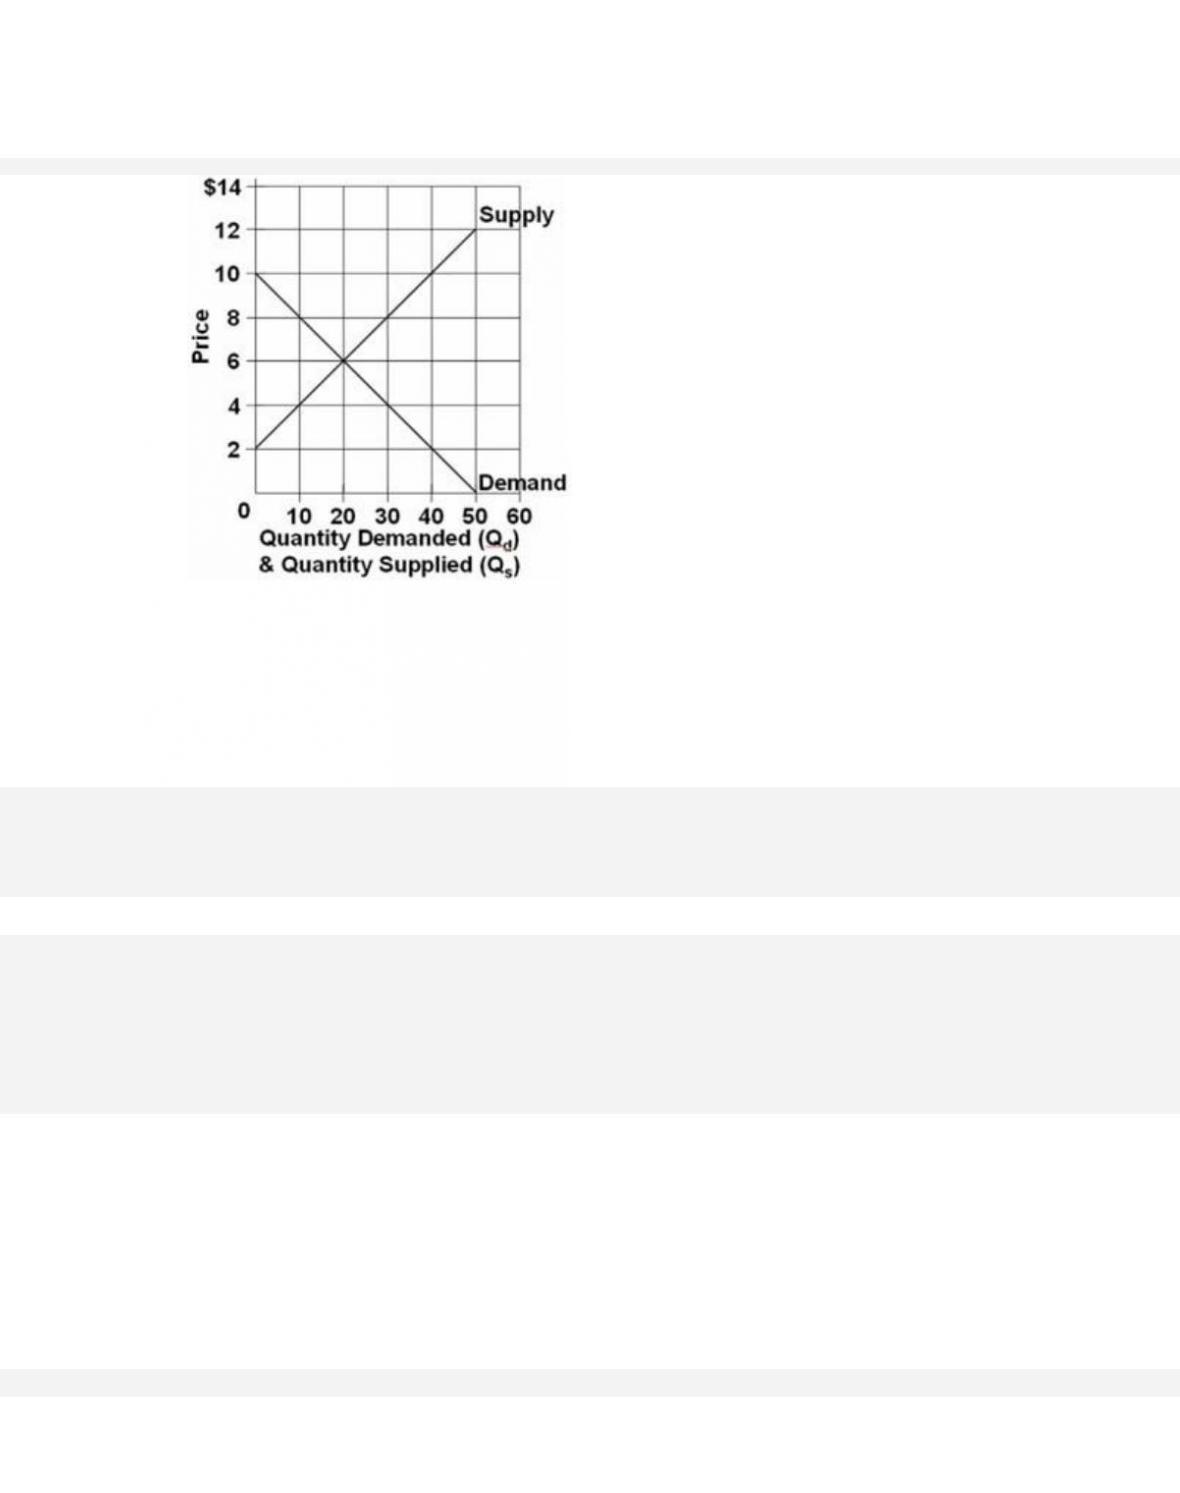
266.
Refer to the graph. Using Qs for quantity supplied and P for price, which of the following
equations correctly states the supply of this product?
A.
P = 4 + .2Qs
267. Assume a household would consume $100 worth of goods and services per week if its
weekly income were zero and would spend an additional $80 per week for each
$100 of additional income. Letting C represent consumption and Y represent income, the
equation that summarizes this relationship is
A. C = 80 + 100Y.

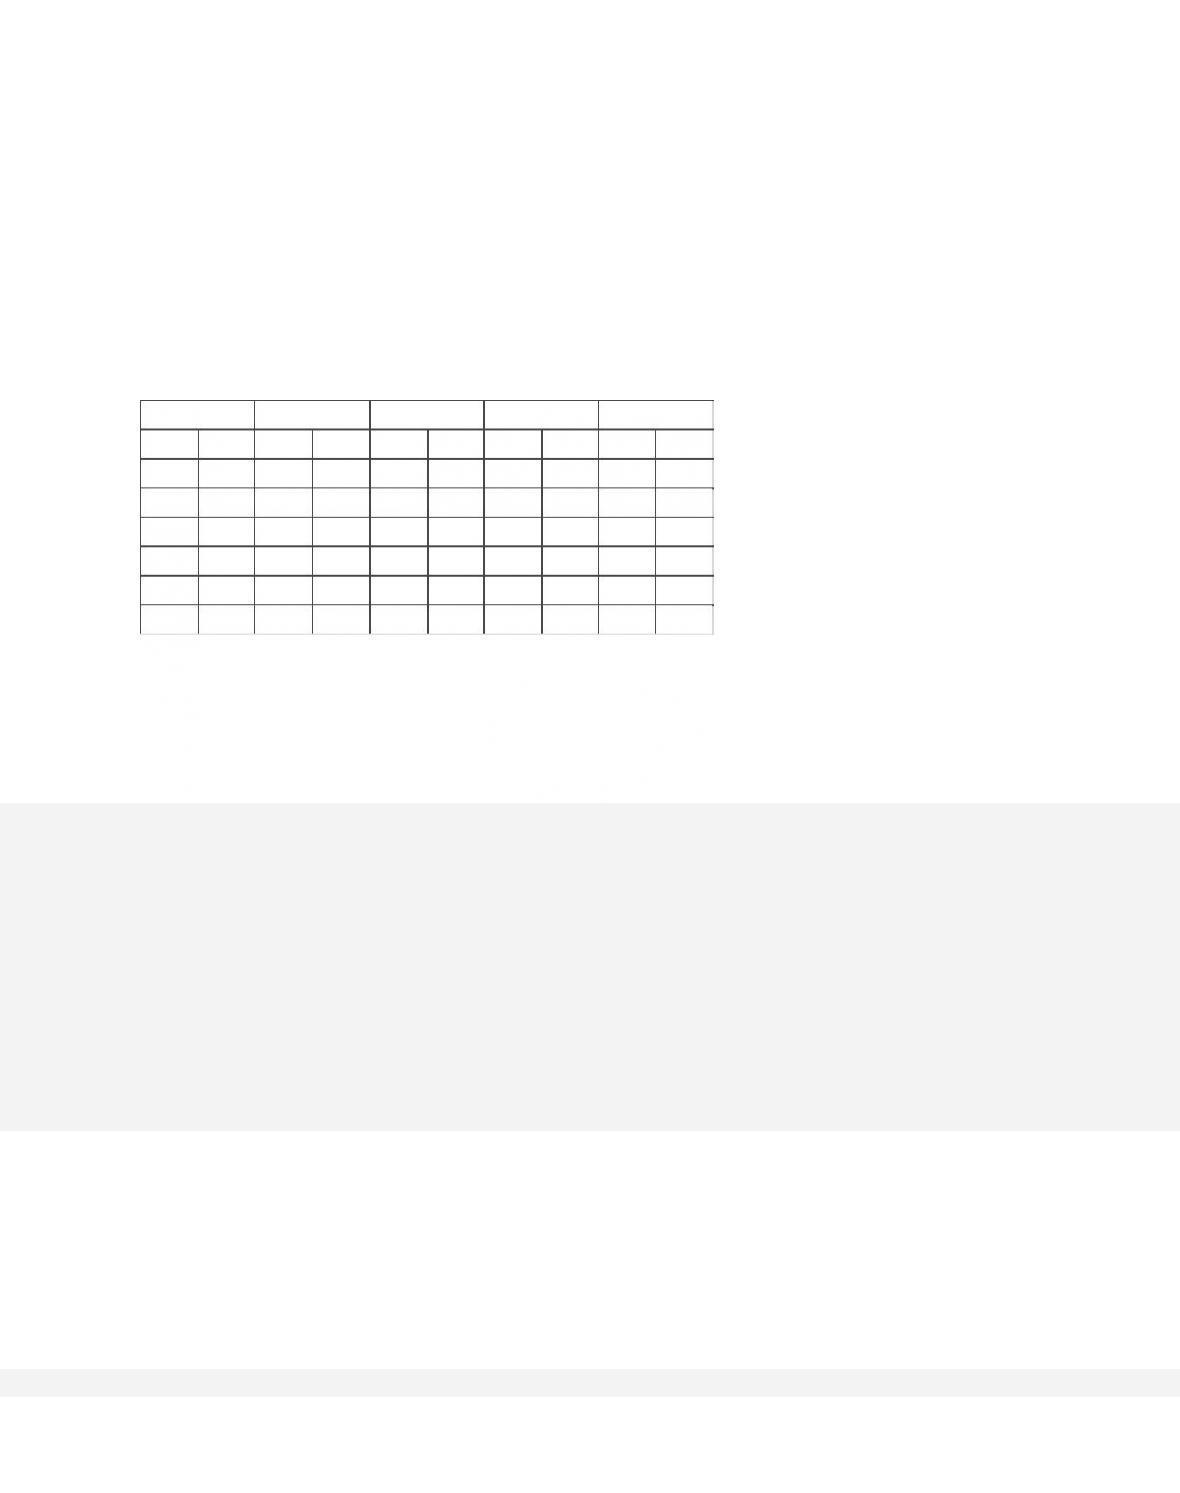
268.
Answer the question on the basis of the following five data sets, wherein it is
assumed that the variable shown on the left is the independent variable and the one on the
right is the dependent variable. Assume in graphing these data that the independent
variable is shown on the horizontal axis and the dependent variable on the vertical
axis.
(1)
(2)
(3)
(4)
(5)
J
K
L
M
N
P
R
T
U
V
0
10
0
-15
100
40
0
-15
0
0
40
20
30
-5
80
50
20
-25
5
10
80
30
60
5
60
60
40
-35
10
20
120
40
90
15
40
70
60
-45
15
30
160
50
120
25
20
80
80
-55
20
40
200
60
150
35
0
90
100
-65
25
50
Refer to the data sets. The variables are directly related in
A.
all five data sets.
B.
none of the data sets.
1-145
Test Bank: I
To pi c:
Appendix: Graphs and Their Meaning
269.
Answer the question on the basis of the following five data sets, wherein it is
assumed that the variable shown on the left is the independent variable and the one on the
right is the dependent variable. Assume in graphing these data that the independent
variable is shown on the horizontal axis and the dependent variable on the vertical
axis.
(1)
(2)
(3)
(4)
(5)
J
K
L
M
N
P
R
T
U
V
0
10
0
-15
100
40
0
-15
0
0
40
20
30
-5
80
50
20
-25
5
10
80
30
60
5
60
60
40
-35
10
20
120
40
90
15
40
70
60
-45
15
30
160
50
120
25
20
80
80
-55
20
40
200
60
150
35
0
90
100
-65
25
50
Refer to the data sets. The vertical intercept is positive for
A. all five data sets.
270.
Answer the question on the basis of the following five data sets, wherein it is
assumed that the variable shown on the left is the independent variable and the one on the
right is the dependent variable. Assume in graphing these data that the independent
variable is shown on the horizontal axis and the dependent variable on the vertical
axis.

1-146
(1)
(2)
(3)
(4)
(5)
J
K
L
M
N
P
R
T
U
V
0
10
0
-15
100
40
0
-15
0
0
40
20
30
-5
80
50
20
-25
5
10
80
30
60
5
60
60
40
-35
10
20
120
40
90
15
40
70
60
-45
15
30
160
50
120
25
20
80
80
-55
20
40
200
60
150
35
0
90
100
-65
25
50
Refer to the data sets. The vertical intercept is negative for
A.
none of the data sets.
271.
Answer the question on the basis of the following five data sets, wherein it is
assumed that the variable shown on the left is the independent variable and the one on the
right is the dependent variable. Assume in graphing these data that the independent
variable is shown on the horizontal axis and the dependent variable on the vertical
axis.
(1)
(2)
(3)
(4)
(5)
J
K
L
M
N
P
R
T
U
V
0
10
0
-15
100
40
0
-15
0
0
40
20
30
-5
80
50
20
-25
5
10
80
30
60
5
60
60
40
-35
10
20
120
40
90
15
40
70
60
-45
15
30
160
50
120
25
20
80
80
-55
20
40
200
60
150
35
0
90
100
-65
25
50
Refer to the data sets. The equation for data set 3 is
D. P = 40 + .5N.
272.
Answer the question on the basis of the following five data sets, wherein it is
assumed that the variable shown on the left is the independent variable and the one on the
right is the dependent variable. Assume in graphing these data that the independent
variable is shown on the horizontal axis and the dependent variable on the vertical
axis.
(1)
(2)
(3)
(4)
(5)
J
K
L
M
N
P
R
T
U
V
0
10
0
-15
100
40
0
-15
0
0
40
20
30
-5
80
50
20
-25
5
10
80
30
60
5
60
60
40
-35
10
20
120
40
90
15
40
70
60
-45
15
30
160
50
120
25
20
80
80
-55
20
40
200
60
150
35
0
90
100
-65
25
50
Refer to the data sets. For which data set(s) is the vertical intercept zero?
A. data set 4
1-148
273.
Answer the question on the basis of the following five data sets, wherein it is
assumed that the variable shown on the left is the independent variable and the one on the
right is the dependent variable. Assume in graphing these data that the independent
variable is shown on the horizontal axis and the dependent variable on the vertical
axis.
(1)
(2)
(3)
(4)
(5)
J
K
L
M
N
P
R
T
U
V
0
10
0
-15
100
40
0
-15
0
0
40
20
30
-5
80
50
20
-25
5
10
80
30
60
5
60
60
40
-35
10
20
120
40
90
15
40
70
60
-45
15
30
160
50
120
25
20
80
80
-55
20
40
200
60
150
35
0
90
100
-65
25
50
Refer to the data sets. The equation for data set 5 is
A. V = .5Y.
274.
Answer the question on the basis of the following five data sets, wherein it is
assumed that the variable shown on the left is the independent variable and the one on the
right is the dependent variable. Assume in graphing these data that the independent
variable is shown on the horizontal axis and the dependent variable on the vertical
axis.
(1)
(2)
(3)
(4)
(5)
J
K
L
M
N
P
R
T
U
V
0
10
0
-15
100
40
0
-15
0
0
40
20
30
-5
80
50
20
-25
5
10
80
30
60
5
60
60
40
-35
10
20
120
40
90
15
40
70
60
-45
15
30
160
50
120
25
20
80
80
-55
20
40
200
60
150
35
0
90
100
-65
25
50
Refer to the data sets. Which of the data sets would graph as an upsloping line?
A.
1 only
275.
If the equation y = 15 – 4x was plotted, the
A.
vertical intercept would be –4.
D.
the slope would be -10.
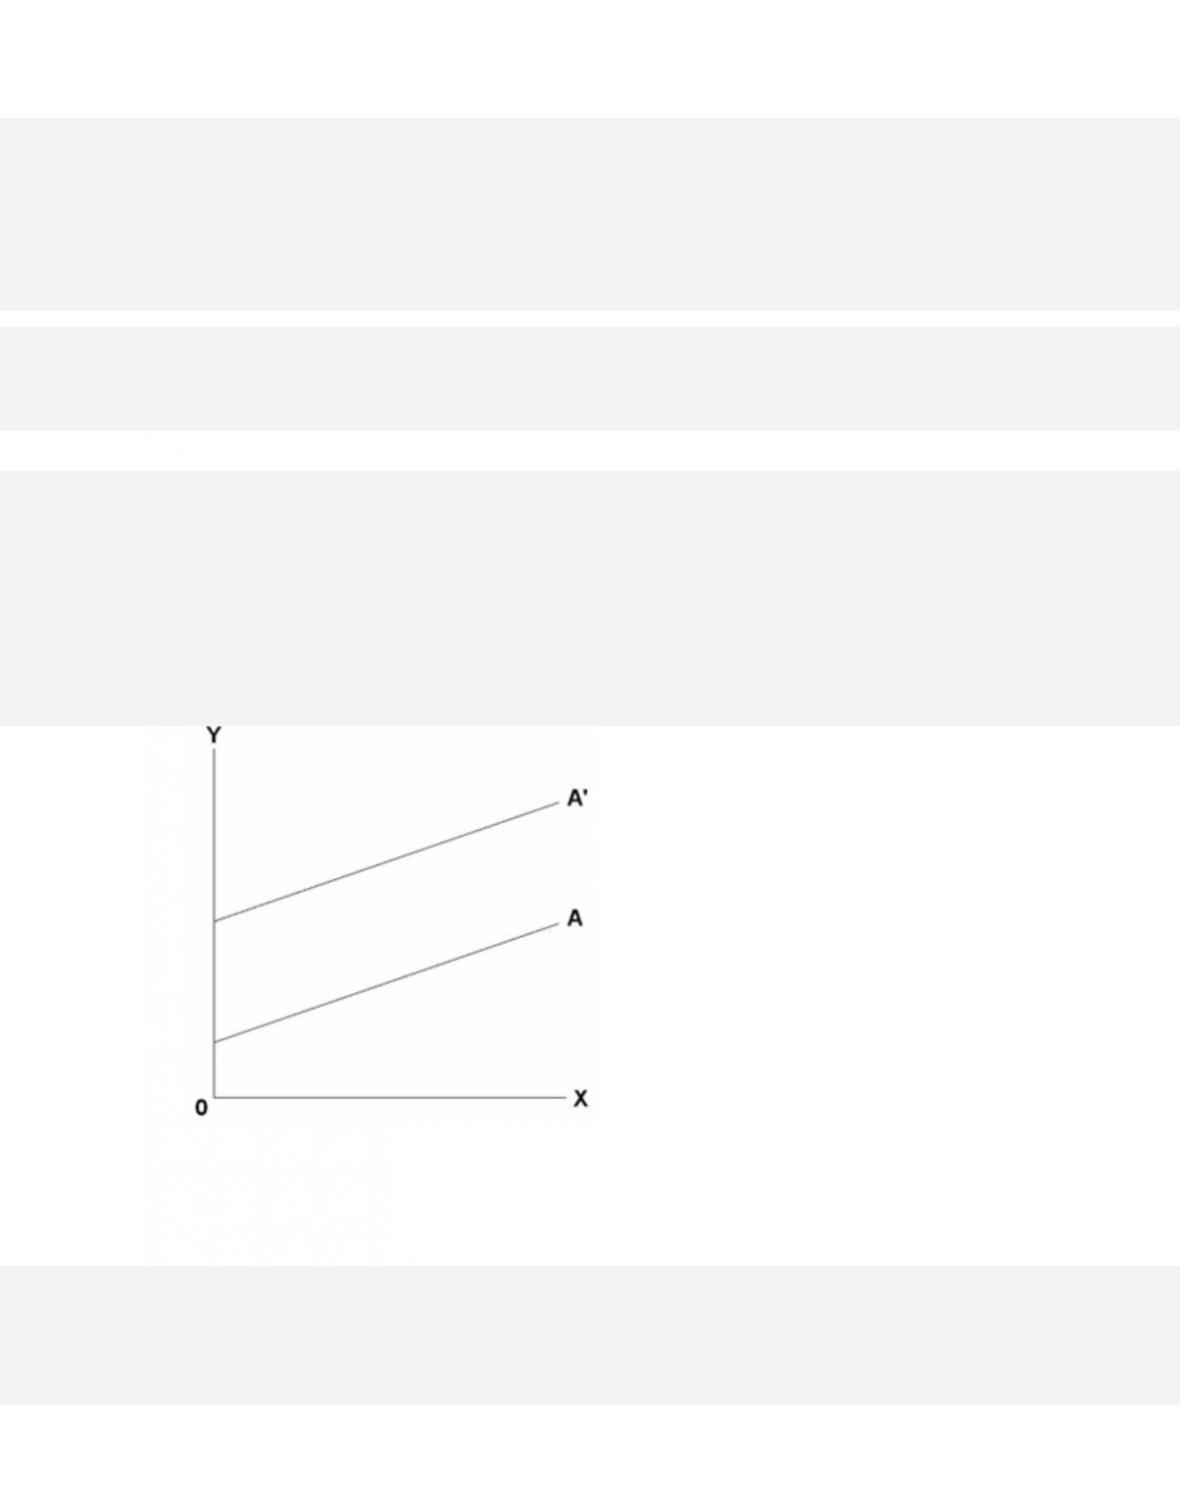
277.
The movement from line A to line A‘ represents a change in
1-151
C.
both the slope and the intercept.
D.
neither the slope nor the intercept.
278.
In the diagram, variables X and Y are
A.
both dependent variables.
1-152
279.
In the diagram, the vertical intercept and slope are
AACSB: Knowledge Application
Blooms: Understand
Difficulty:
02 Medium
Learning Objective: 01–08 Appendix: Understand graphs, curves, and slopes as they relate
to economics.
Test Bank: I
To pi c:
Appendix: Graphs and Their Meaning
D.
4 and +3/4 respectively.
280.
In the diagram, the equation for this line is
D. y = 4 + 1⅓x.
281.
If we are considering the relationship between two variables and release one of the
other-things–equal assumptions, we would expect
A. the relationship to change from direct to inverse.
1-154
282.
The amount of pizzas that consumers want to buy per week is reflected in the
equation P = 15 – .02Qd, where Qd is the amount of pizzas purchased per week and P is
the price of pizzas. On the basis of this information, we can say that
A.
if pizzas were free, people would consume 800 per week.
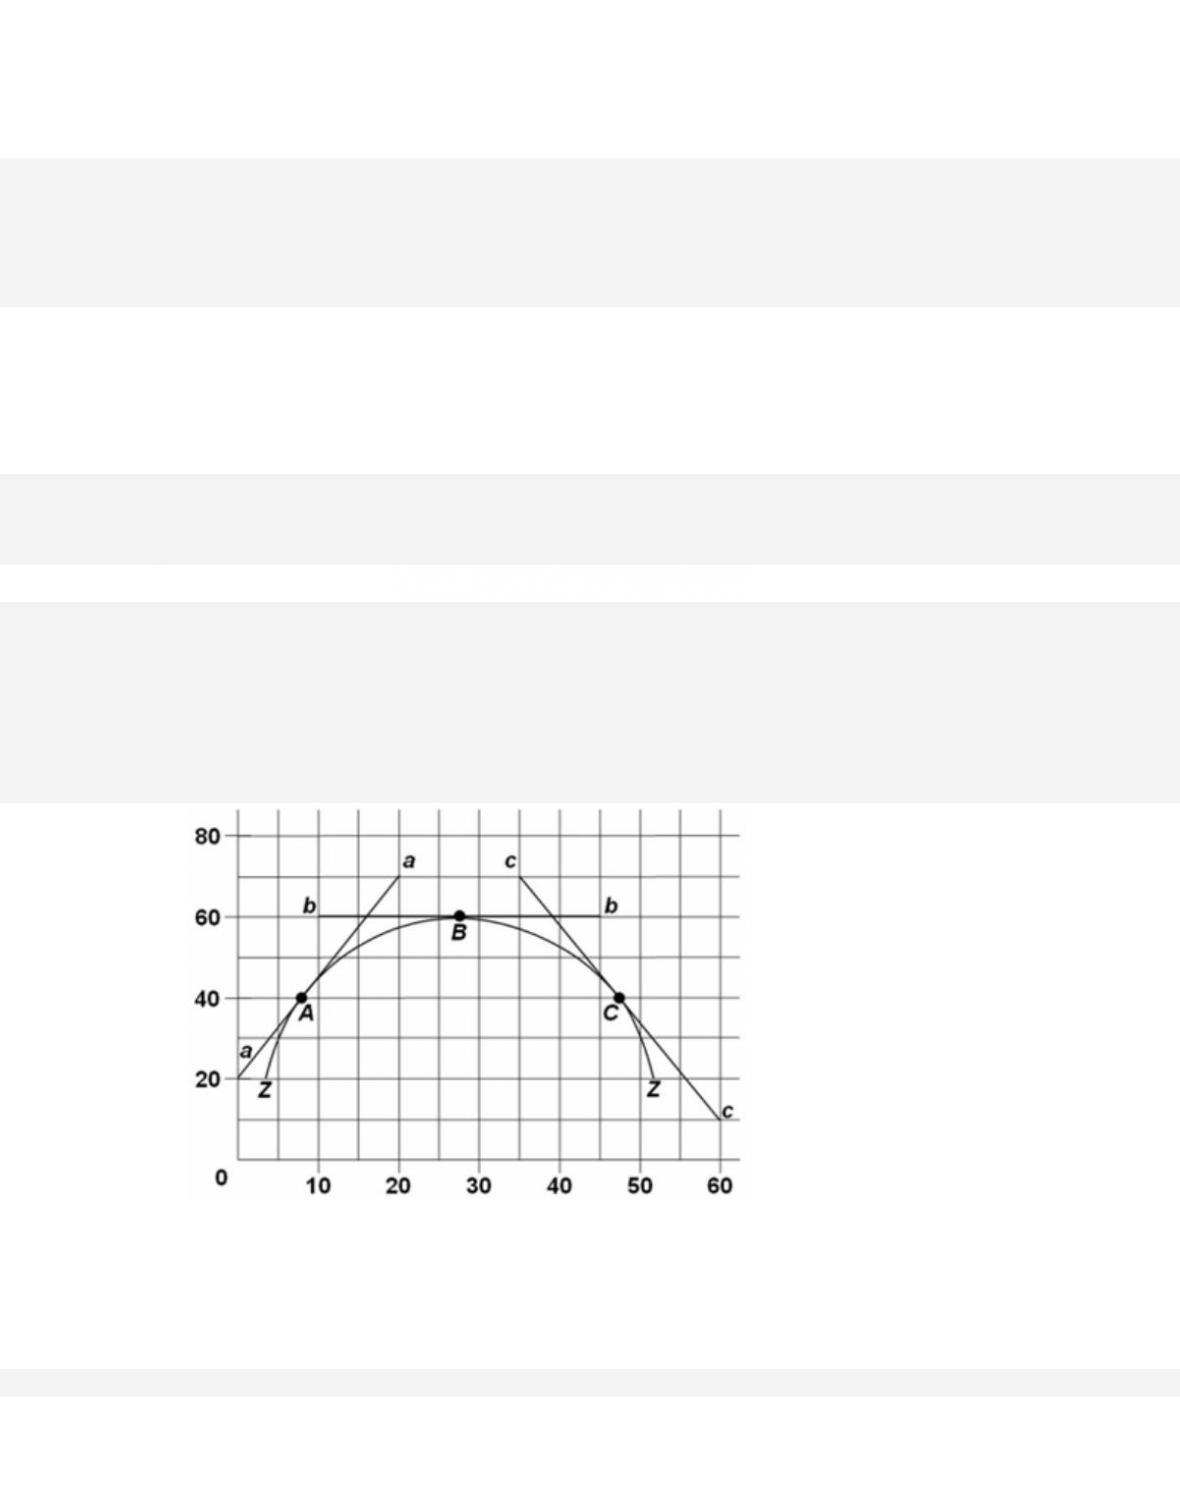
283.
Refer to the diagram. The slope of curve ZZ at point A is approximately
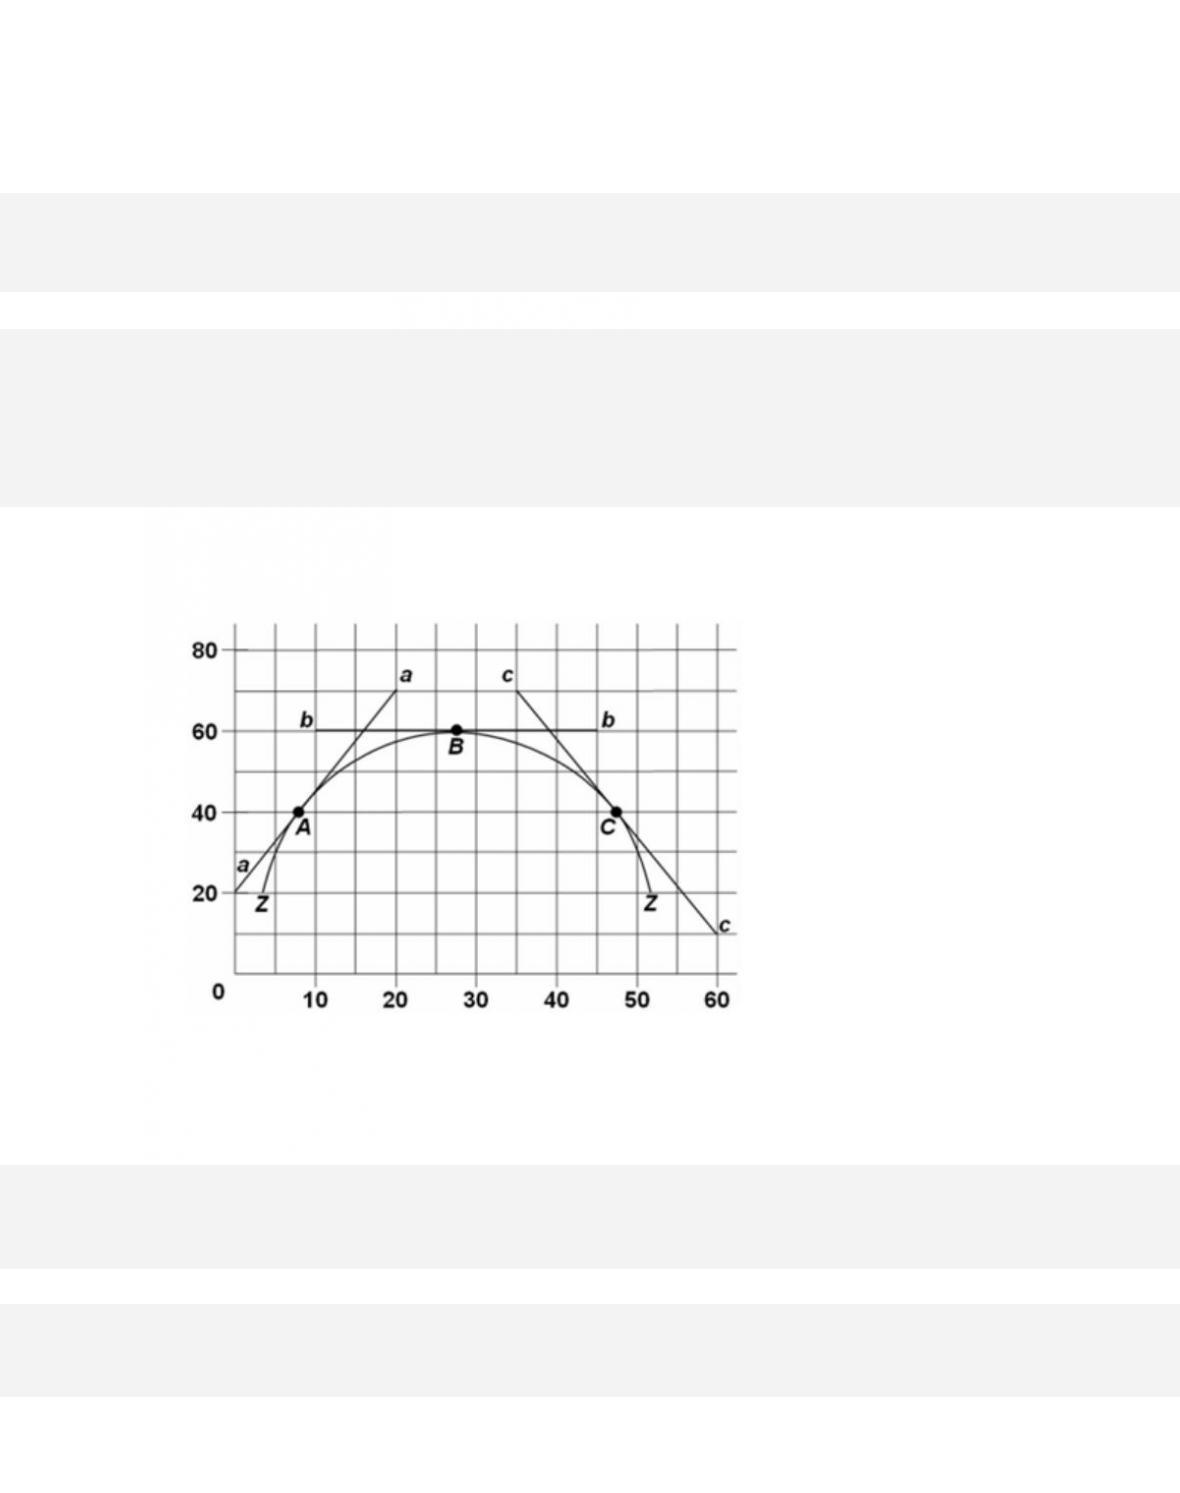
A. +2.
284.
Refer to the diagram. The slope of curve ZZ at point B is:
A. infinity.
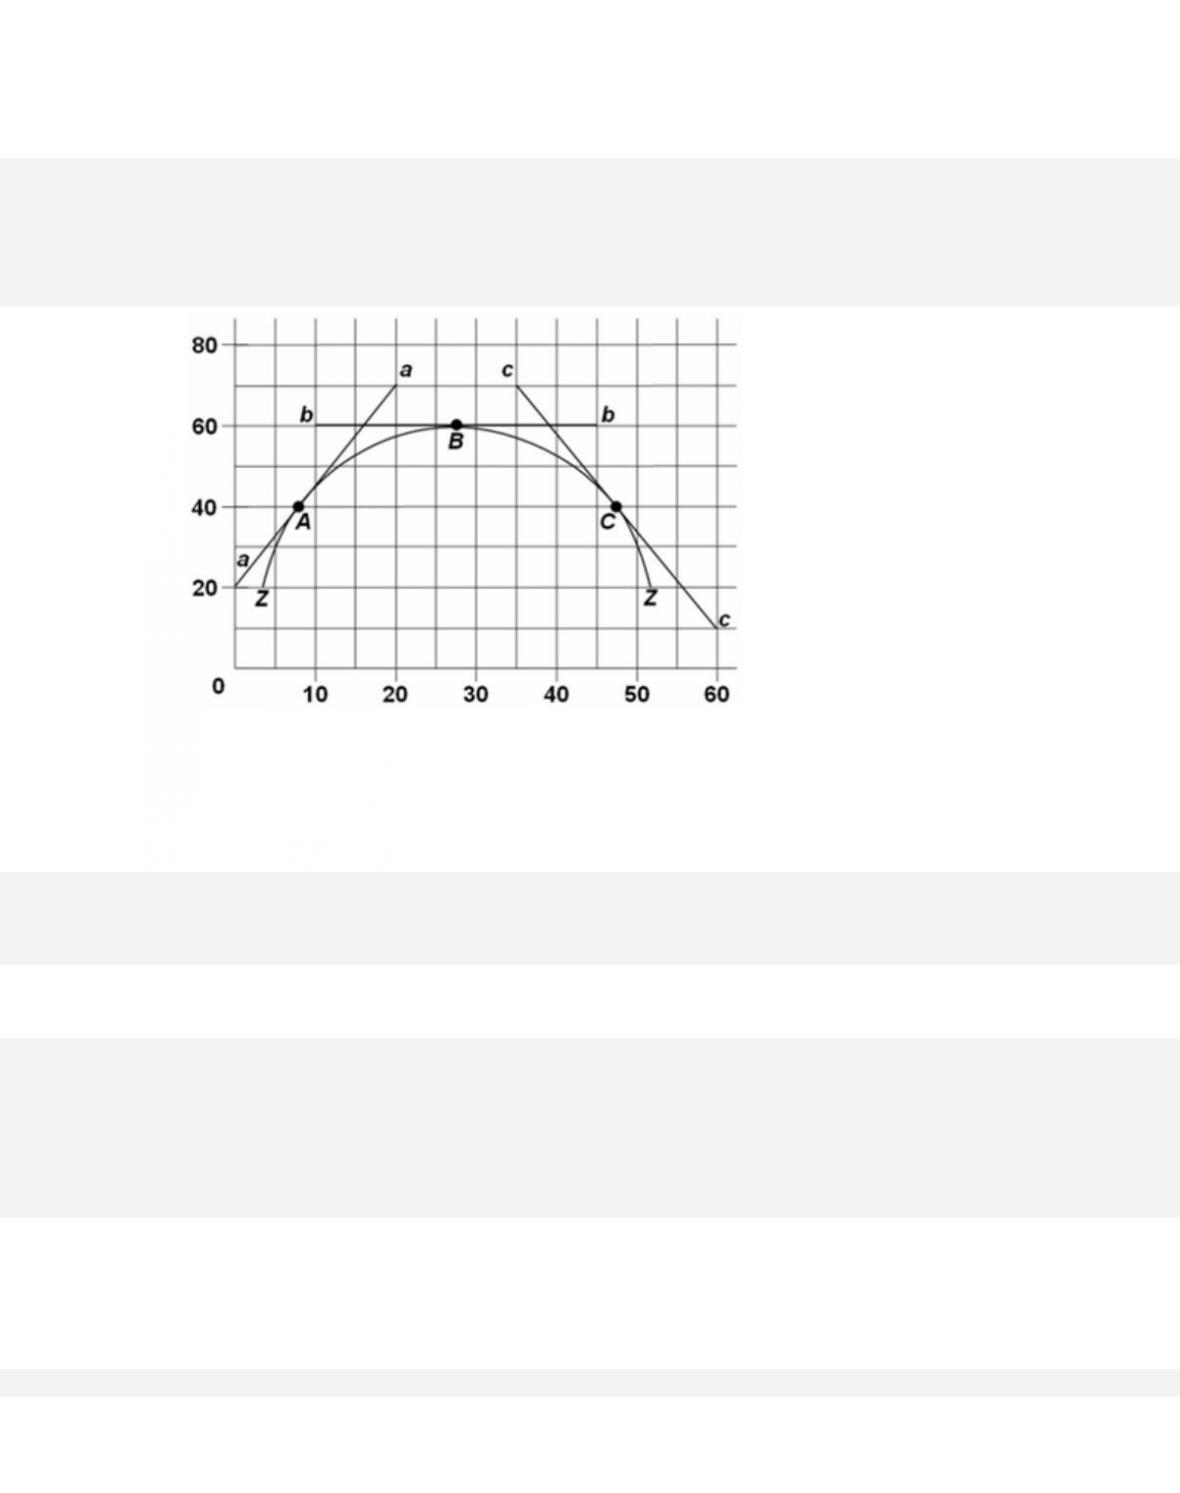
1-156
285.
Refer to the diagram. The slope of curve ZZ at point C is approximately
D. +3.
286.
The slope of a line parallel to the vertical axis is
A.
zero.

287.
The slope of a line parallel to the horizontal axis is
D.
one-half.
288.
Slopes of lines are especially important in economics because
D.
they always relate to resource and output scarcity.

1-158
289.
Economics is a social science that studies how individuals, institutions, and society
may
A.
expand the amount of resources available to them.
290.
The basic truth that underlies the study of economics is the fact that we all face
A.
death.
291.
A recurring theme in economics is that people
A.
have unlimited resources but limited economic wants.

1-159
292.
As a consequence of the problem of scarcity,
A. there is never enough of anything.
293.
What does “there is no such thing as a free lunch” mean in economics?
D.
Products only have value because people are willing to pay for them.
294.
The idea in economics that “there is no free lunch“ means that
A.
businesses would go bankrupt if they offered free lunches.
B.
the thought of a free lunch is often better than the reality of consuming it.

295.
The opportunity cost of doing or getting something is defined as
A.
the difference between the marginal cost and benefit of doing something.
296.
Economic analysis assumes “purposeful behavior,” which means that people will
pursue decisions or actions
D.
without making any logical mistakes.