1-121
234.
An economy will always operate at some point on its production possibilities curve.
235.
In drawing a particular budget line, money income and the prices of the two products
are fixed.
236.
The lower the consumer‘s income, the higher his or her budget line.
1-122
Multiple Choice Questions
237.
If we say that two variables are directly related, this means that
A.
the relationship between the two is purely random.
238.
If we say that two variables are inversely related, this means that
A. the two graph as an upsloping line.
239.
Economists
A.
always put the independent variable on the horizontal axis and the dependent variable on
the vertical axis.
B.
always put the dependent variable on the horizontal axis and the independent variable on
the vertical axis.
240.
Which of the following statements is correct?
A. The value of the independent variable is determined by the value of the dependent
variable.
241.
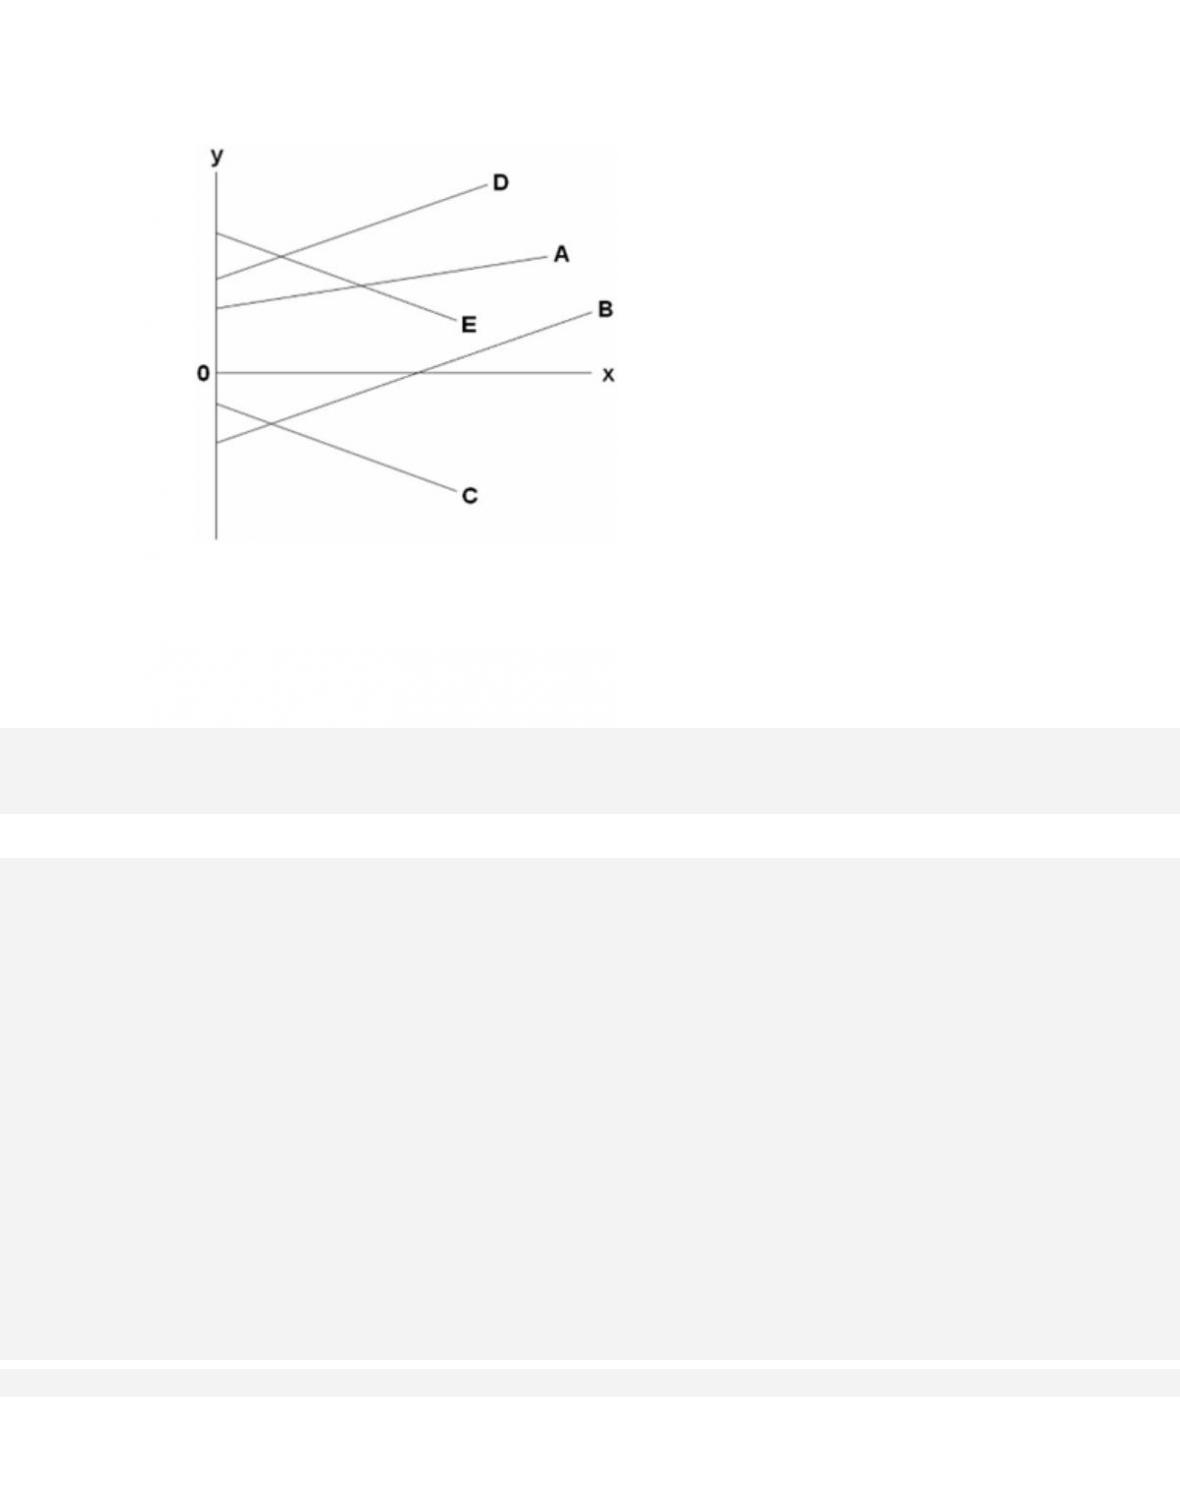
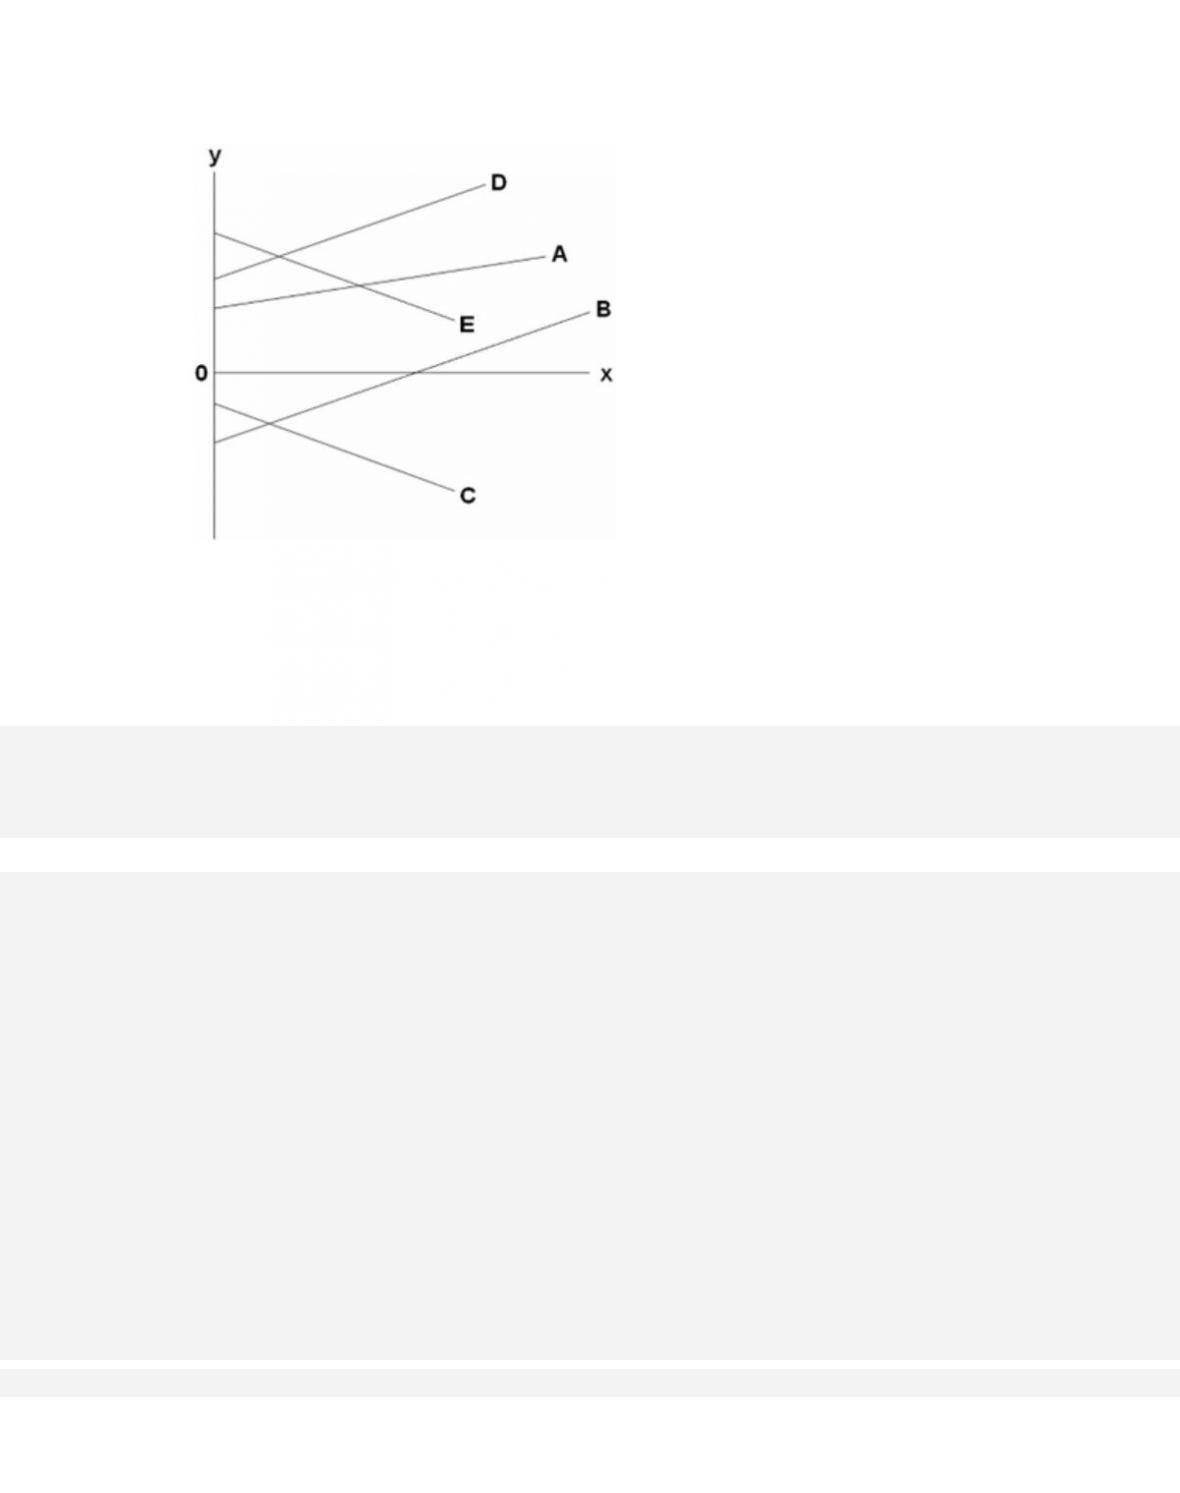
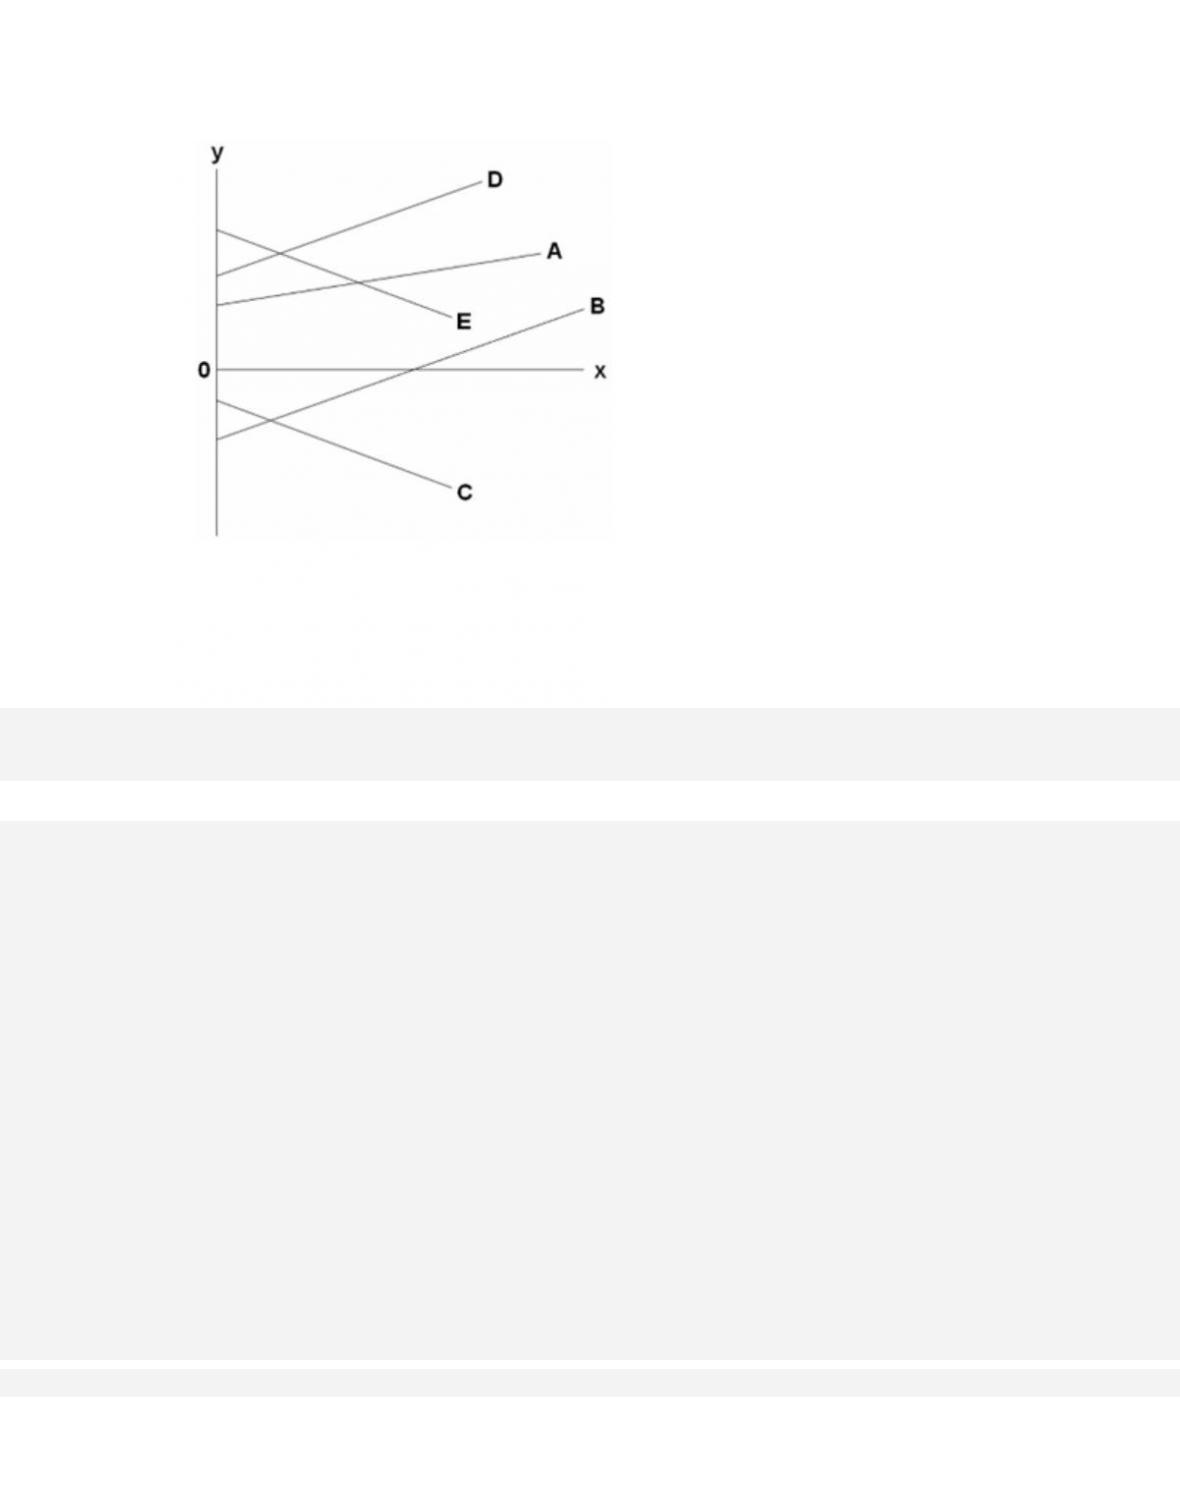
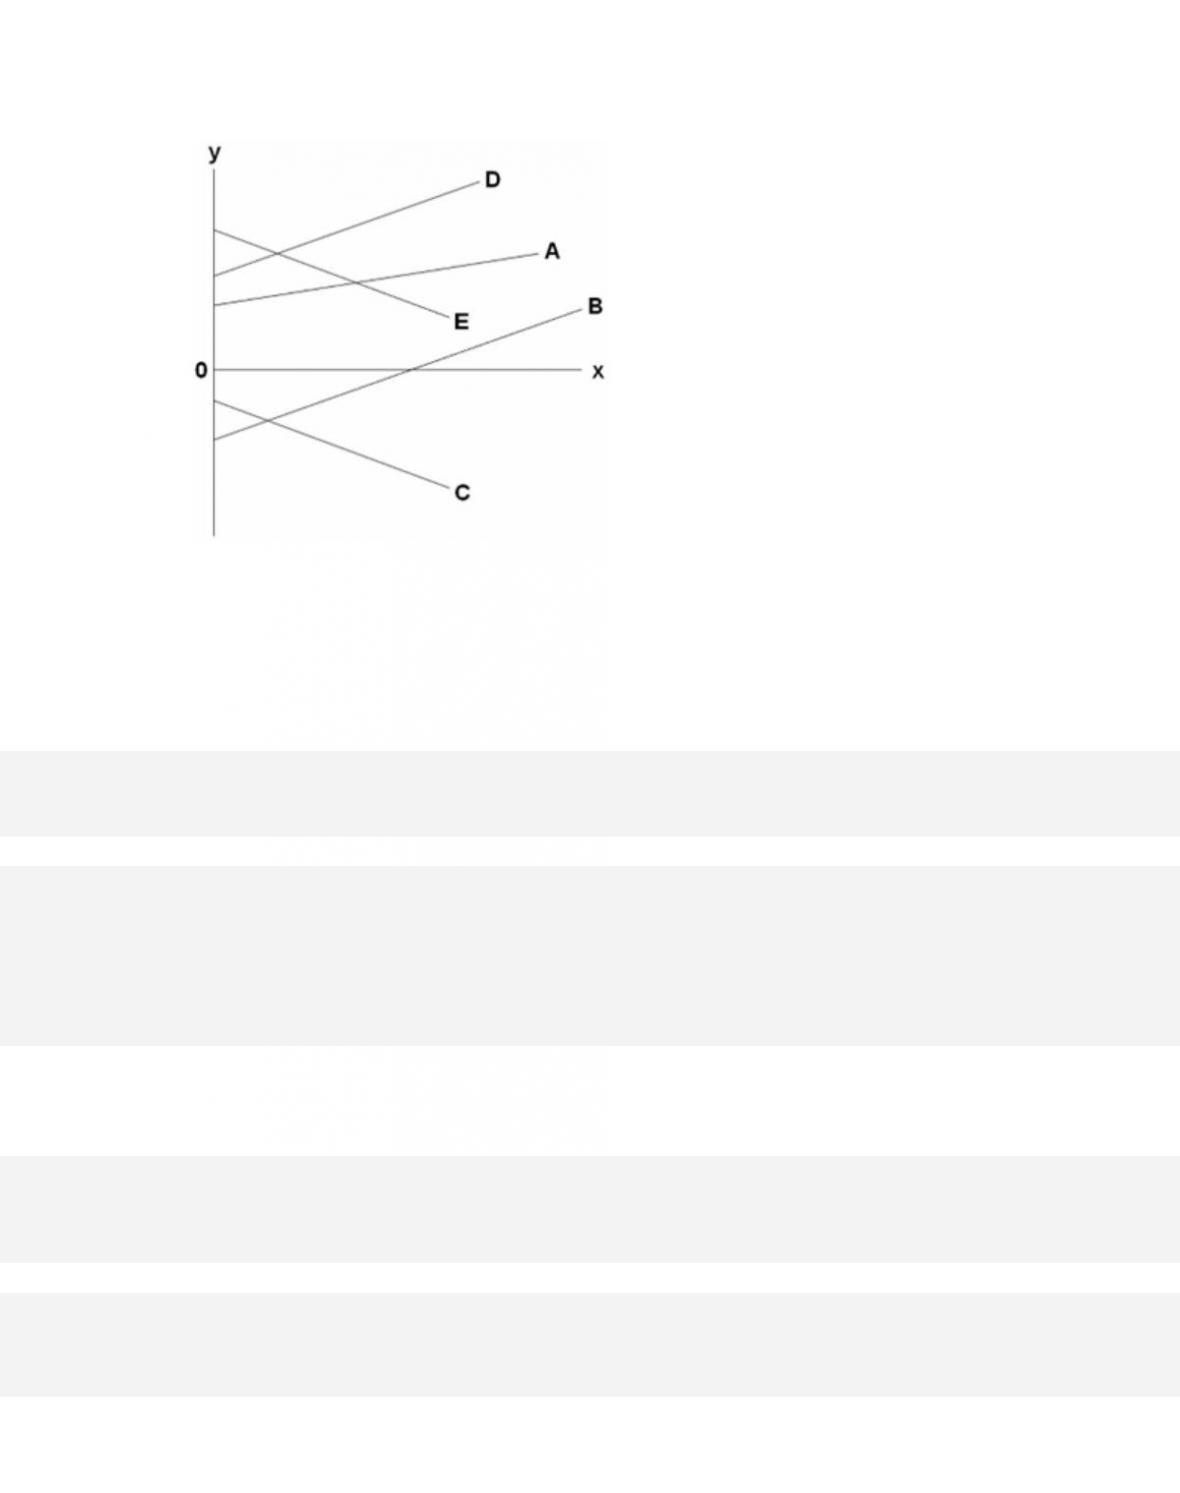
Refer to the diagram. Which line(s) show(s) a positive relationship between x and y?
A.
A only
242.
Refer to the diagram. Which line(s) show(s) a negative relationship between x and y?
243.
Refer to the diagram. Which line(s) show(s) a positive vertical intercept?
A.
A and D only
B.
B and C only
244.
Refer to the diagram. Which line(s) show(s) a negative vertical intercept?
A.
C only
245.
If two variables are inversely related, then as the value of one variable
A.
increases, the value of the other may either increase or decrease.
246.
If a positive relationship exists between x and y,
A.
an increase in x will cause y to decrease.
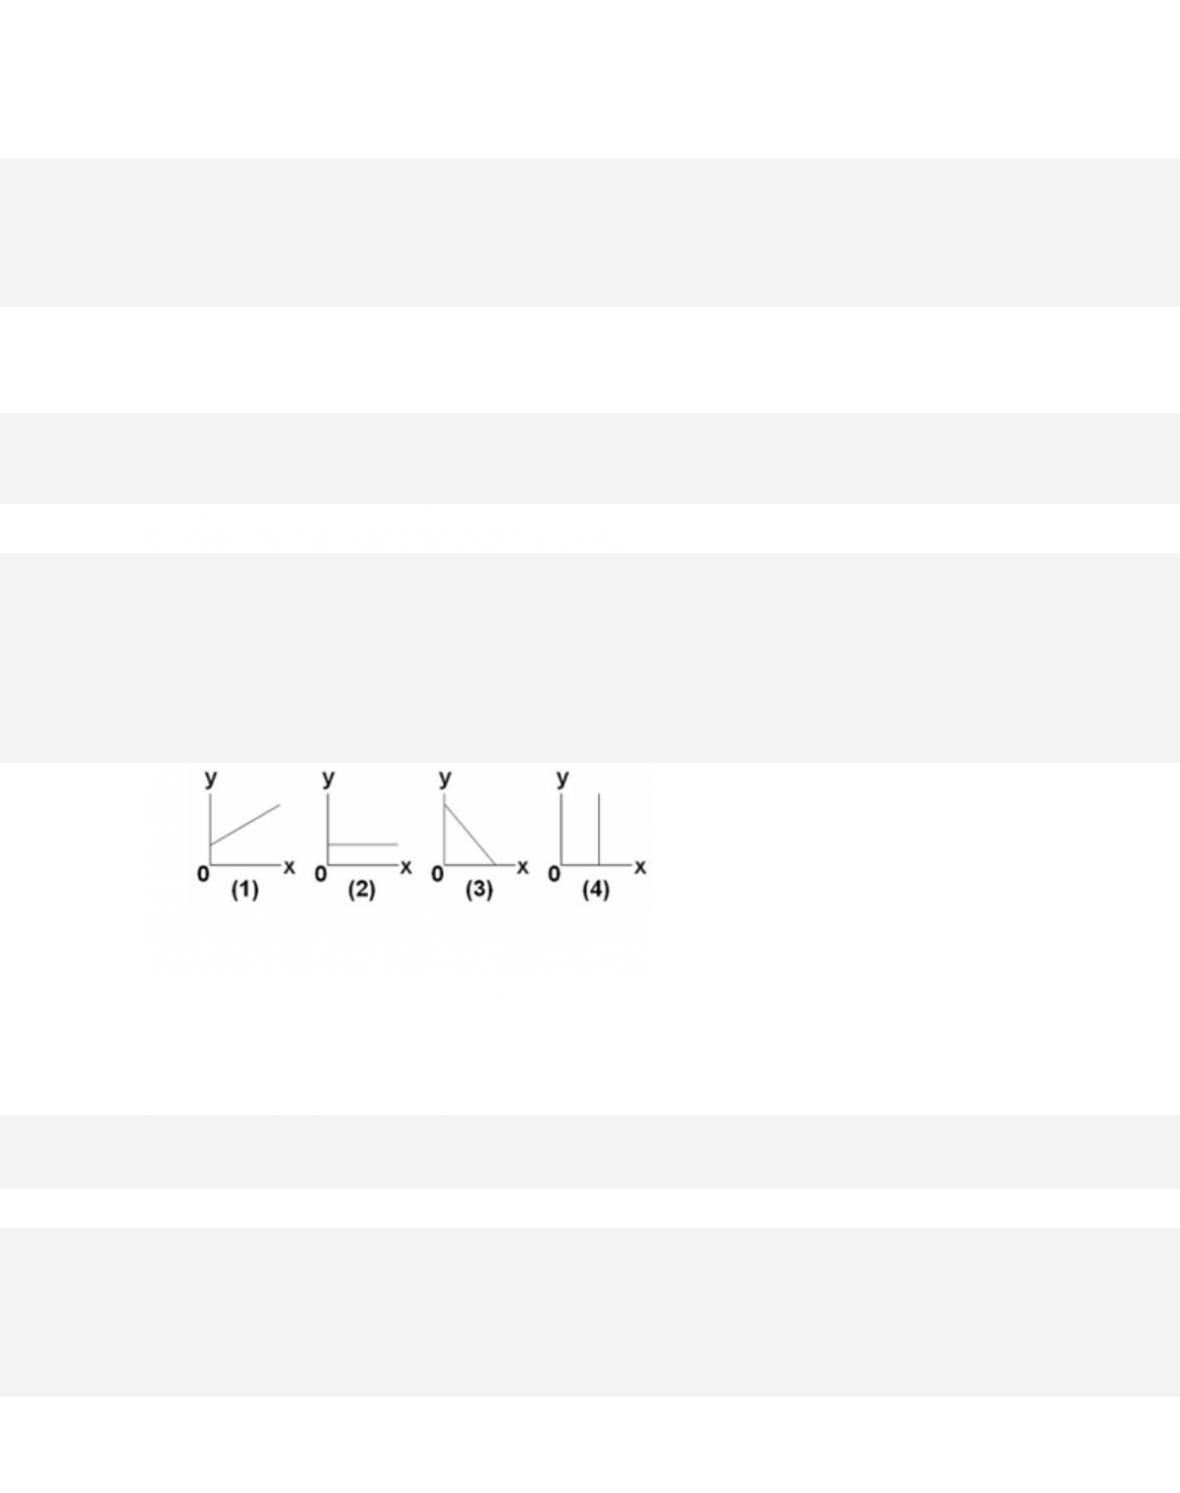
247.
Answer on the basis of the relationships shown in the four figures. The amount of y is
directly related to the amount of x in
A.
both 1 and 4.
B.
both 1 and 2.
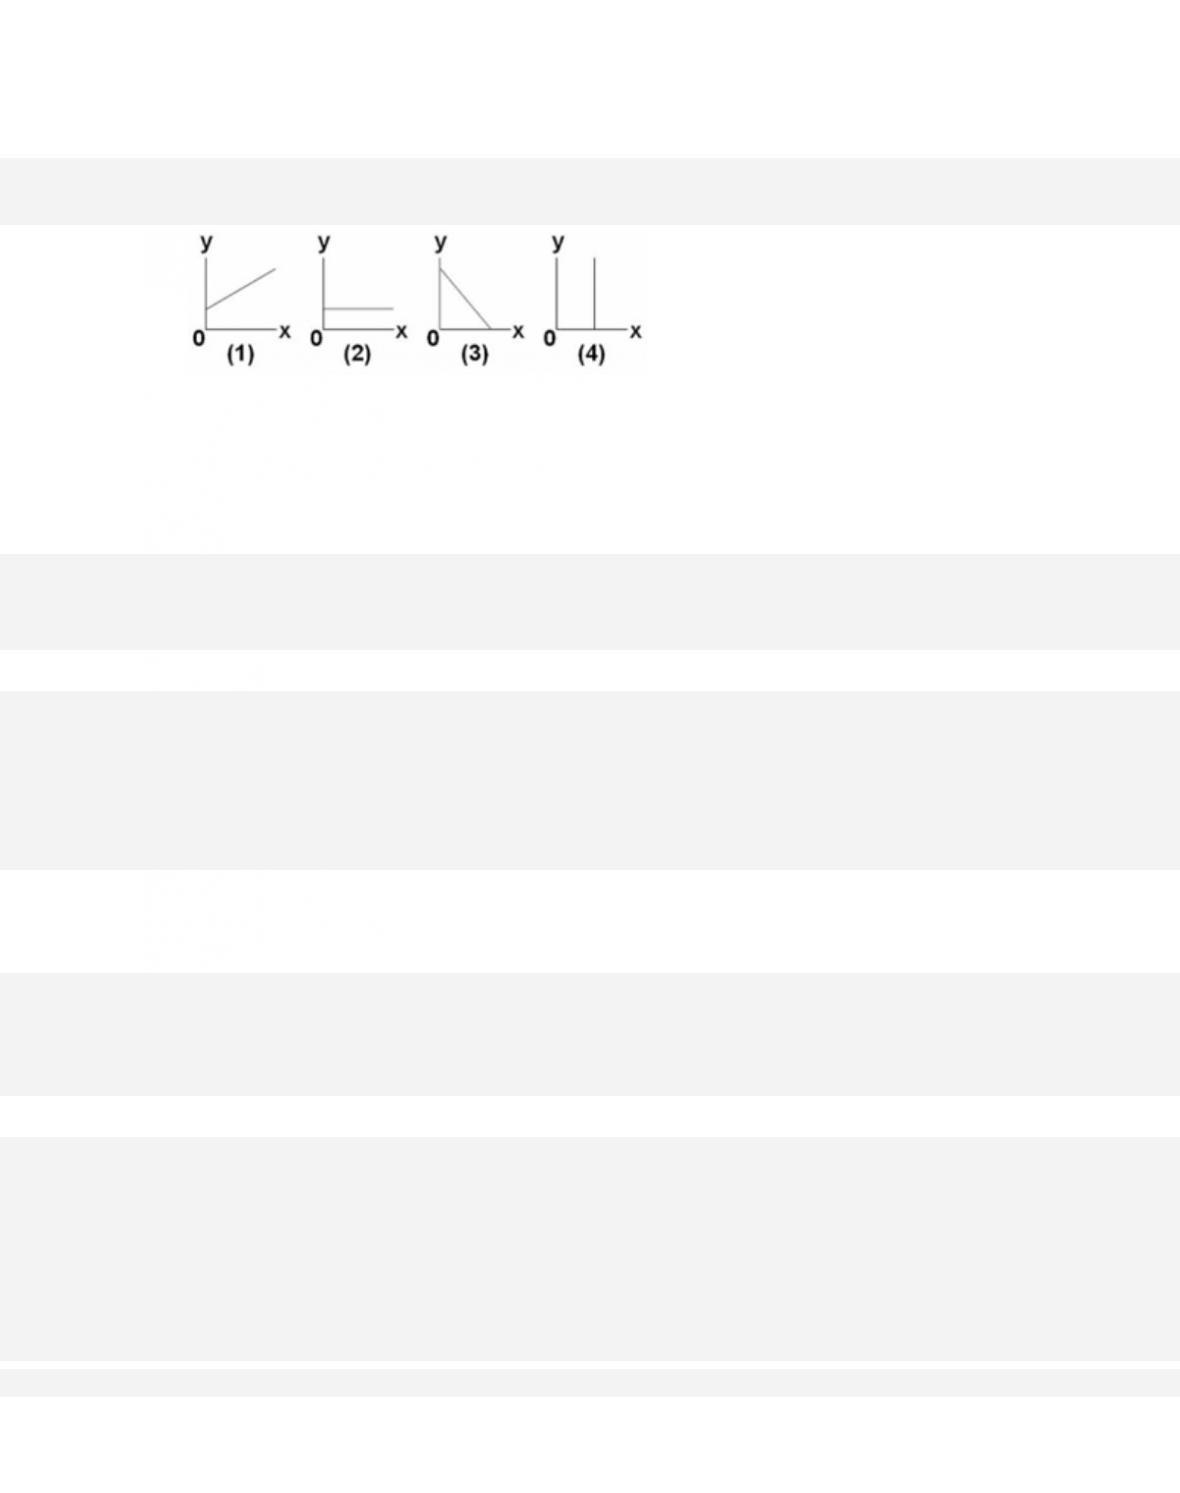
248.
Answer on the basis of the relationships shown in the four figures. The amount of y is
inversely related to the amount of x in
A.
2 only.
249. If price (P) and quantity (Q) are directly related, this means that
1-130
250.
Answer the question on the basis of the following information. Assume that if the
interest rate that businesses must pay to borrow funds were 20 percent, it would be
unprofitable for businesses to invest in new machinery and equipment, so investment
would be zero. But if the interest rate were 16 percent, businesses would find it
profitable
to invest $10 billion. If the interest rate were 12 percent, $20 billion would be invested.
Assume that total investment continues to increase by $10 billion for
each successive 4
percentage point decline in the interest rate.
Refer to the information. Which of the following is an accurate verbal statement of the
described relationship?
A.
There is no regular or dependable relationship between business investment and the
interest rate.
251.
Answer the question on the basis of the following information. Assume that if the
interest rate that businesses must pay to borrow funds were 20 percent, it would be
unprofitable for businesses to invest in new machinery and equipment, so investment
would be zero. But if the interest rate were 16 percent, businesses would find it
profitable
to invest $10 billion. If the interest rate were 12 percent, $20 billion would be invested.
Assume that total investment continues to increase by $10 billion for
each successive 4
percentage point decline in the interest rate.
A)
i
l
B)
i
l
20
$50
24
$10
16
40
20
20
12
30
16
30
8
20
12
40
1-131
4
10
8
50
0
0
4
60
C)
i
l
D)
i
l
20
$0
20
$10
16
10
16
20
12
20
12
30
8
30
8
40
4
40
4
50
0
50
0
60
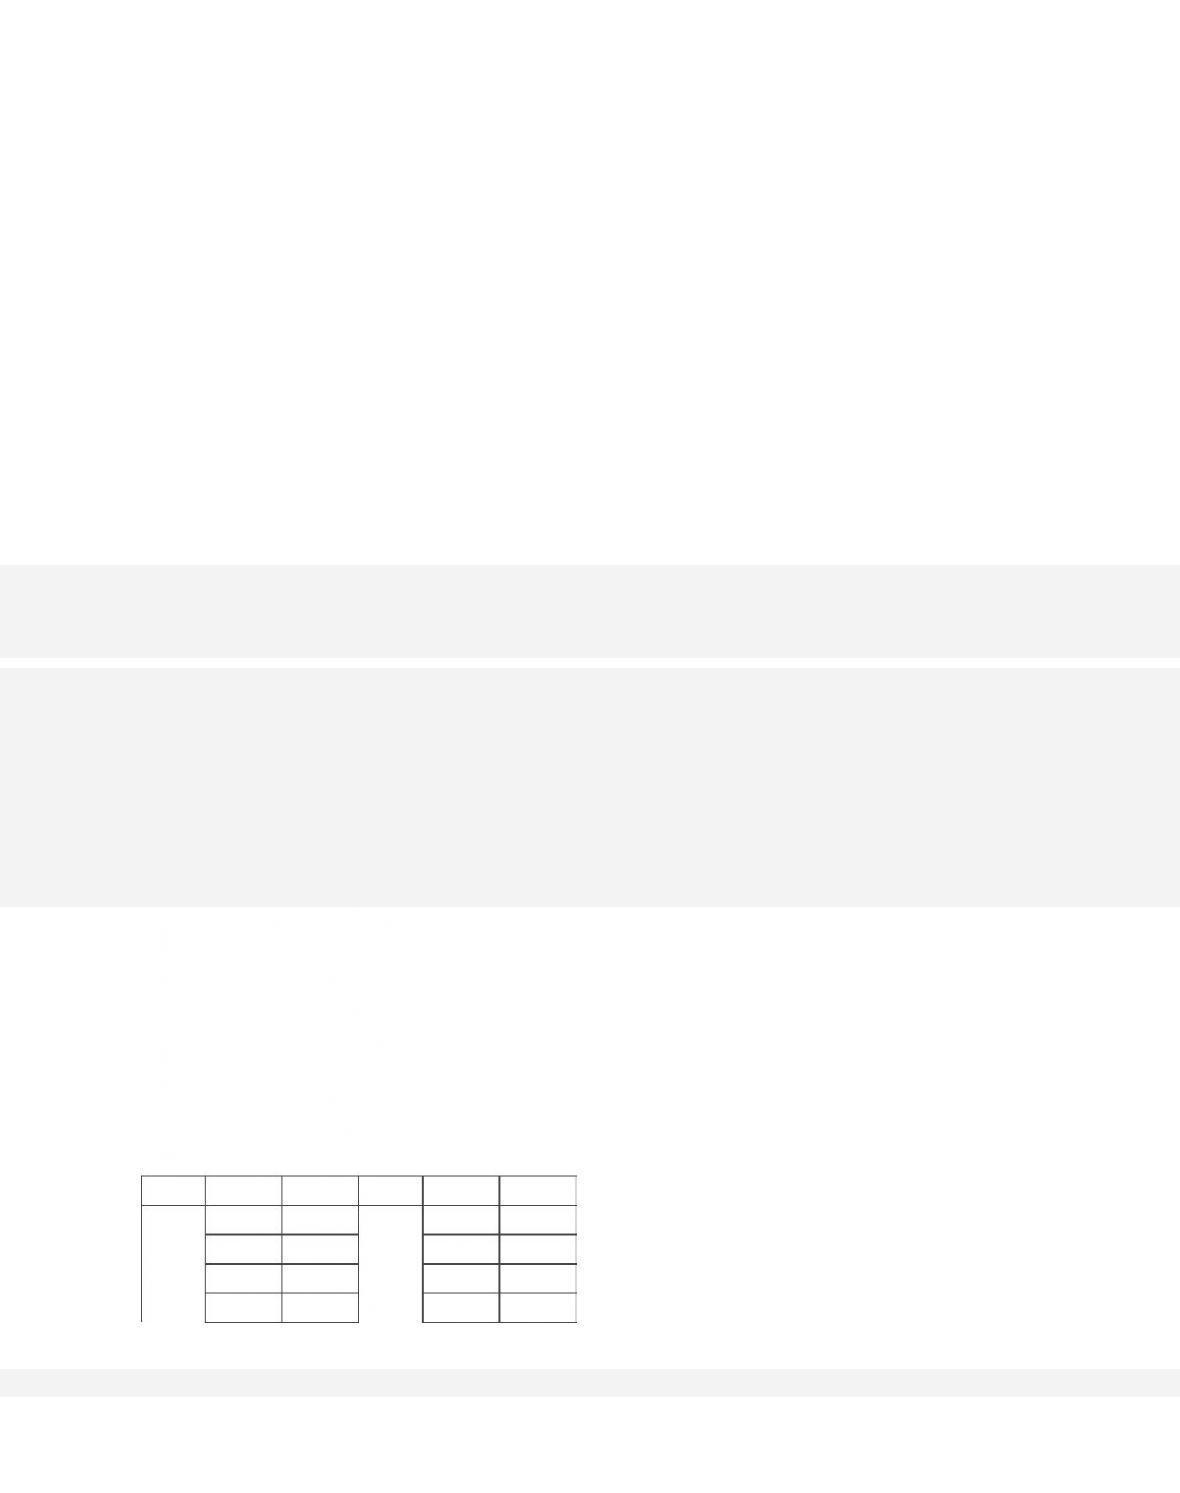
Refer to the information. Using i and I to indicate the interest rate and investment (in
billions of dollars) respectively, which of the following is the correct tabular
presentation of the described relationship?
A.
option A
252.
Answer the question on the basis of the following information. Assume that if the
interest rate that businesses must pay to borrow funds were 20 percent, it would be
unprofitable for businesses to invest in new machinery and equipment, so investment
would be zero. But if the interest rate were 16 percent, businesses would find it
profitable
to invest $10 billion. If the interest rate were 12 percent, $20 billion would be invested.
Assume that total investment continues to increase by $10 billion for
each successive 4
percentage point decline in the interest rate. Refer to the information. Which of the
following correctly expresses the indicated relationship as an
equation?
C. i = 24 – .4I.
D. i = 20 – 10I.
253.
Assume that if the interest rate that businesses must pay to borrow funds were 20 percent,
it would be unprofitable for businesses to invest in new machinery and
equipment, so
investment would be zero. But if the interest rate were 16 percent, businesses would find it
profitable to invest $10 billion. If the interest rate were 12
percent, $20 billion would be
invested. Assume that total investment continues to increase by $10 billion for each
successive 4 percentage point decline in the interest
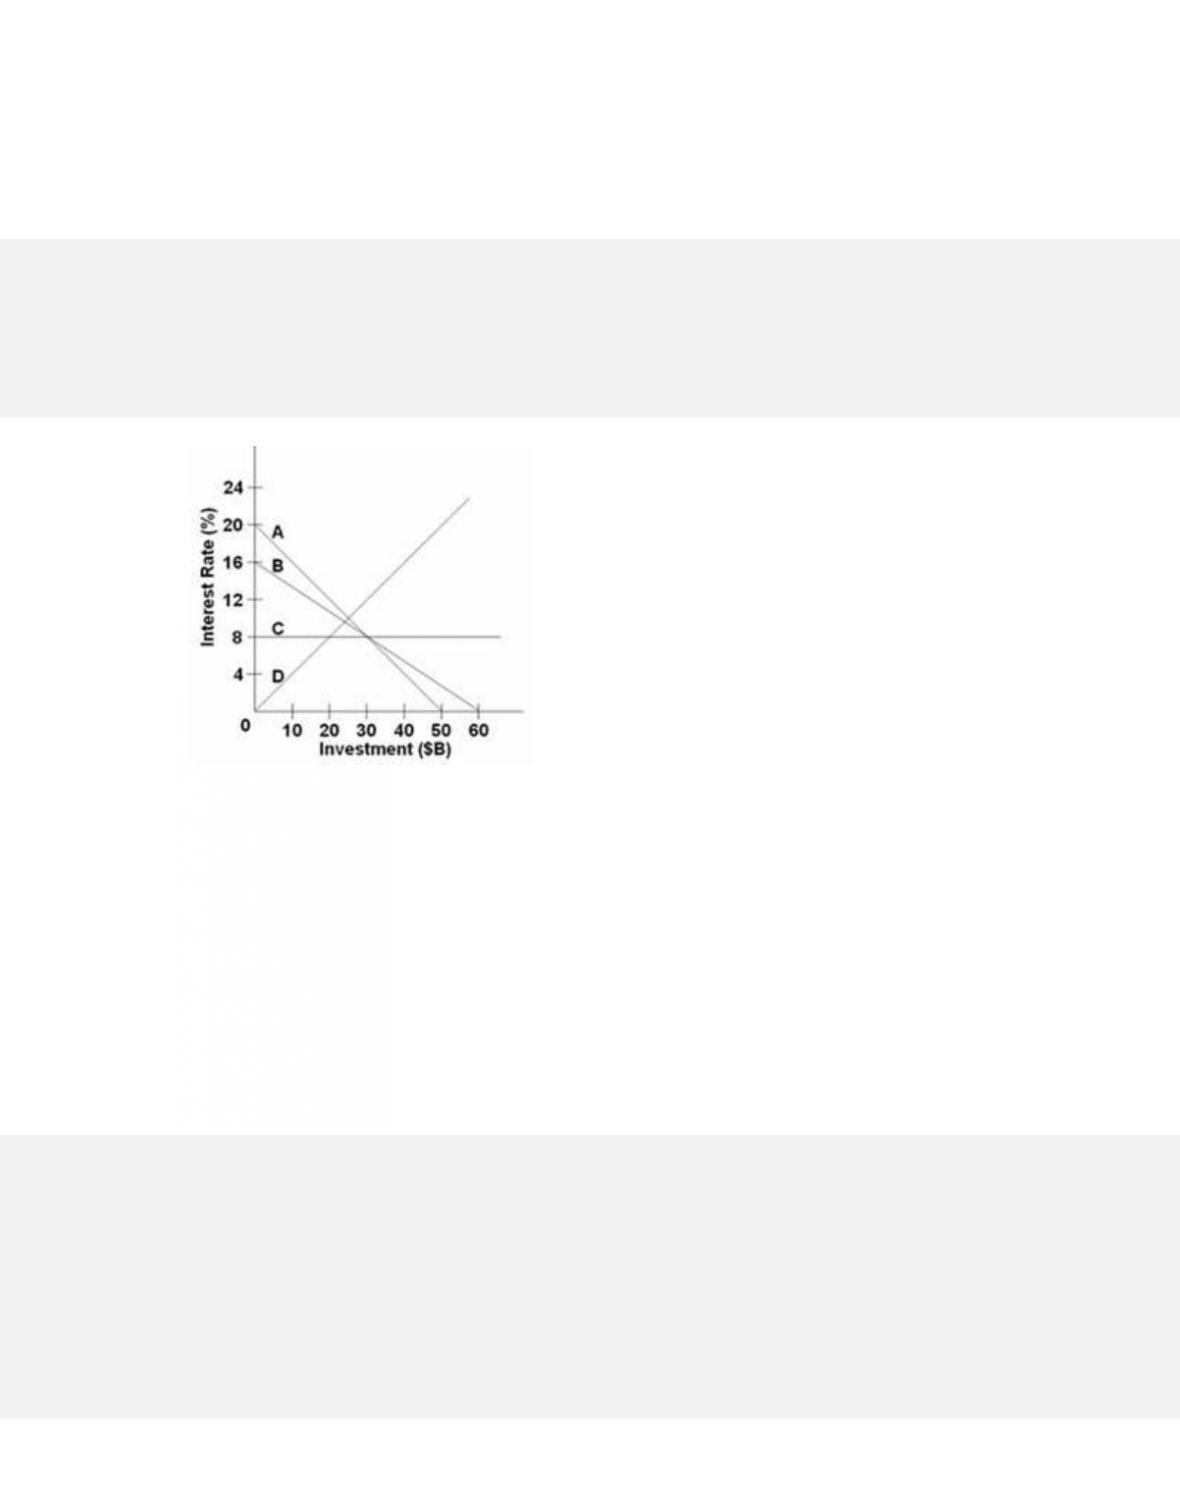
rate. Refer to the graph. Which of the
following is the correct graphical presentation of the indicated relationship?
A.
line D
1-133
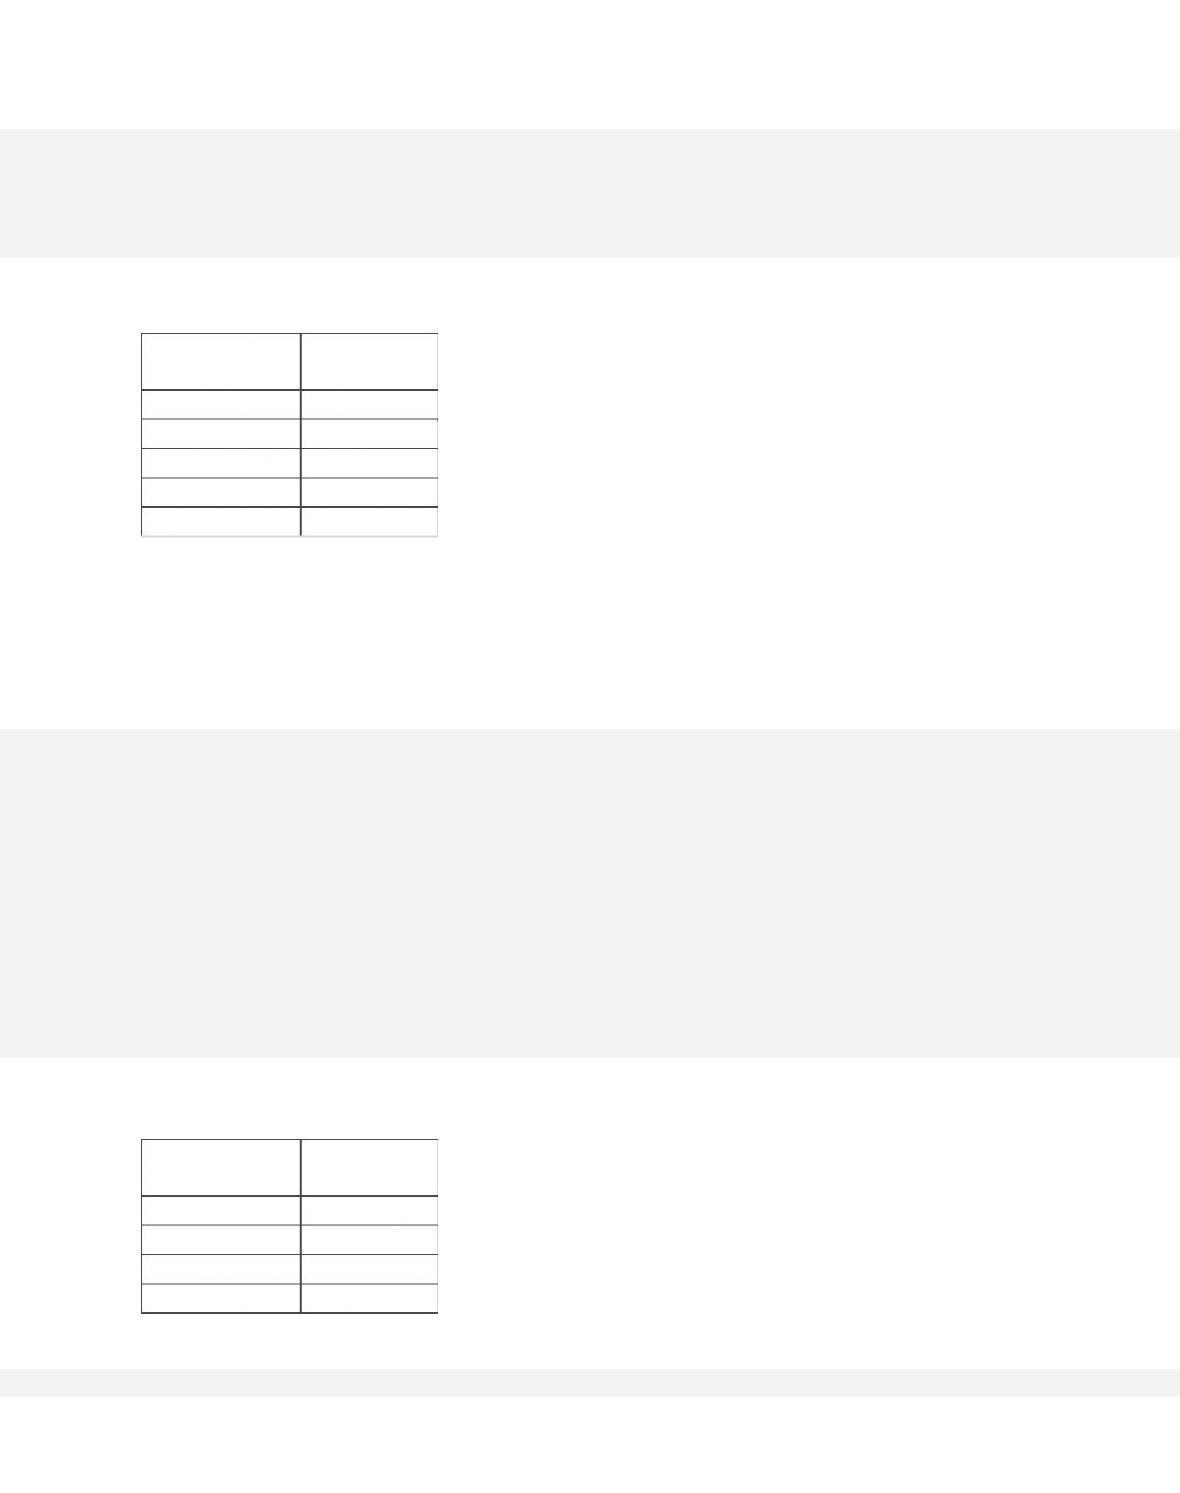
254.
Answer the question on the basis of the following data.
After-Tax
Income
Consumptio
n
$1,000
$900
2,000
1,800
3,000
2,700
4,000
3,600
5,000
4,500
The data suggest that
A. consumption varies inversely with after-tax income.
255.
Answer the question on the basis of the following data.
After-Tax
Income
Consumptio
n
$1,000
$900
2,000
1,800
3,000
2,700
4,000
3,600
1-134
5,000
4,500
The data indicate that
A. consumers spend 80 percent of their after–tax incomes.
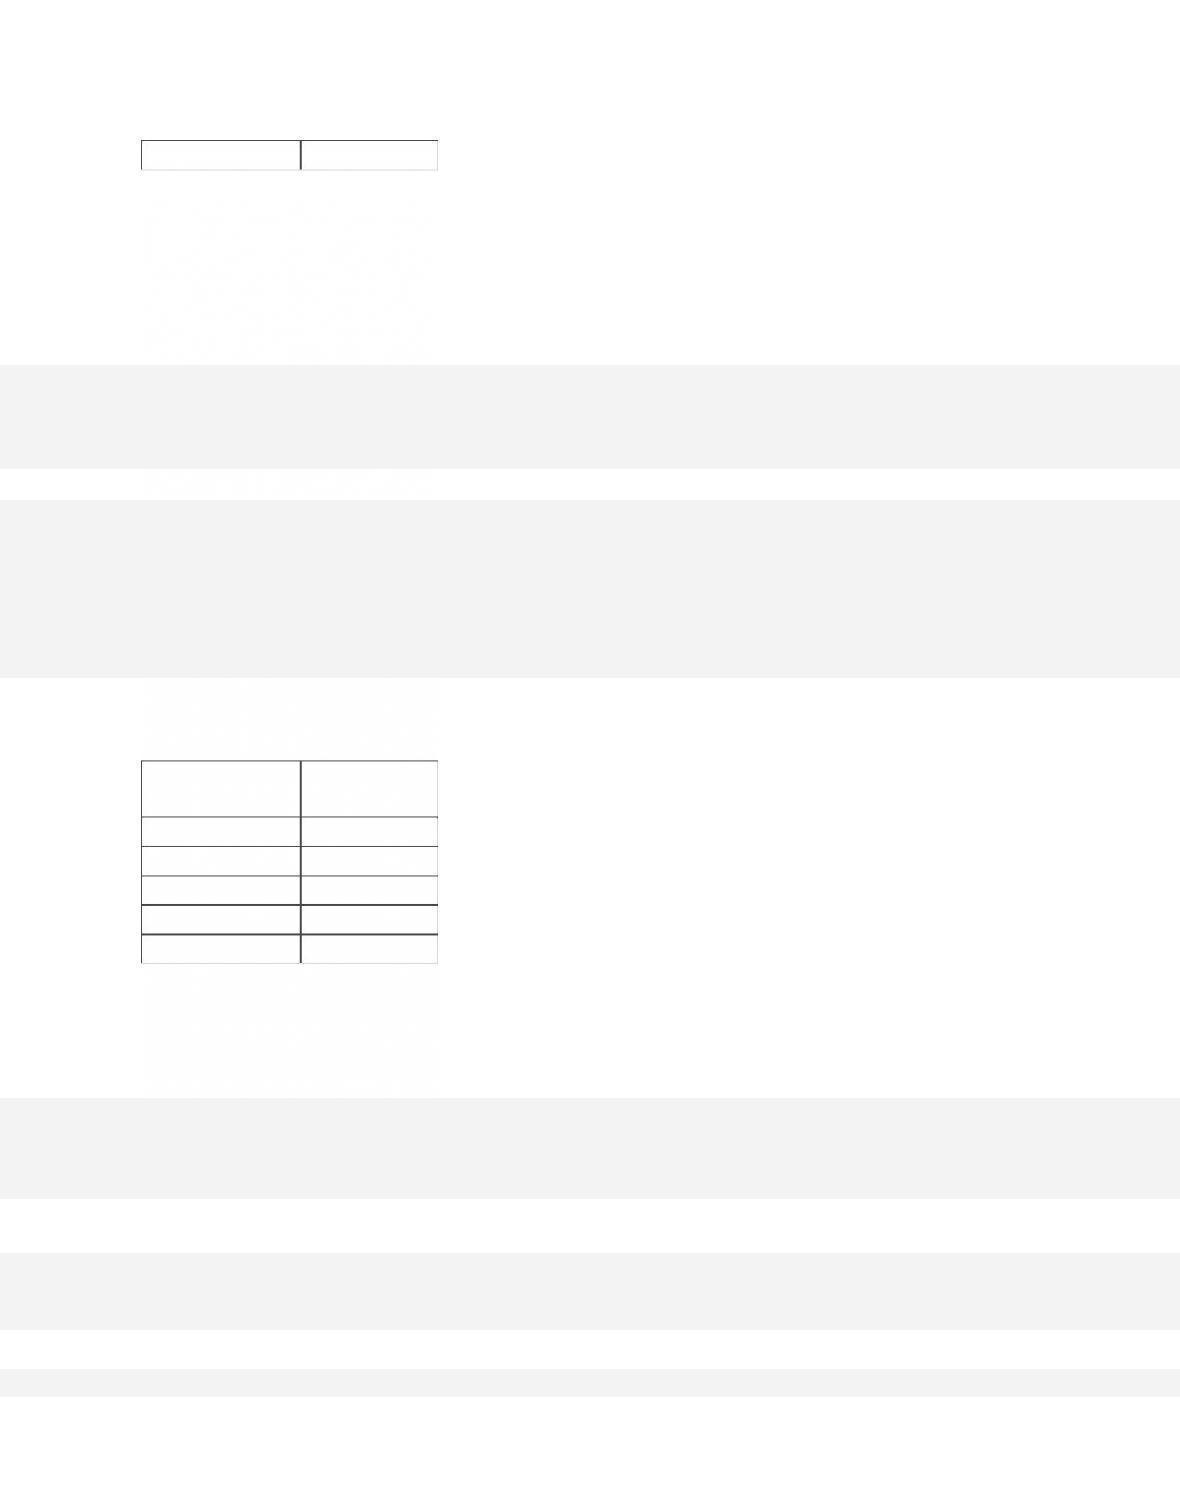
256.
Answer the question on the basis of the following data.
After-Tax
Income
Consumptio
n
$1,000
$900
2,000
1,800
3,000
2,700
4,000
3,600
5,000
4,500
The data suggest that
D.
after-tax income should be lowered to increase consumption.
1-135
257. The slope of a straight line can be determined by
A. comparing the absolute horizontal change to the absolute vertical change between two
points on the line.
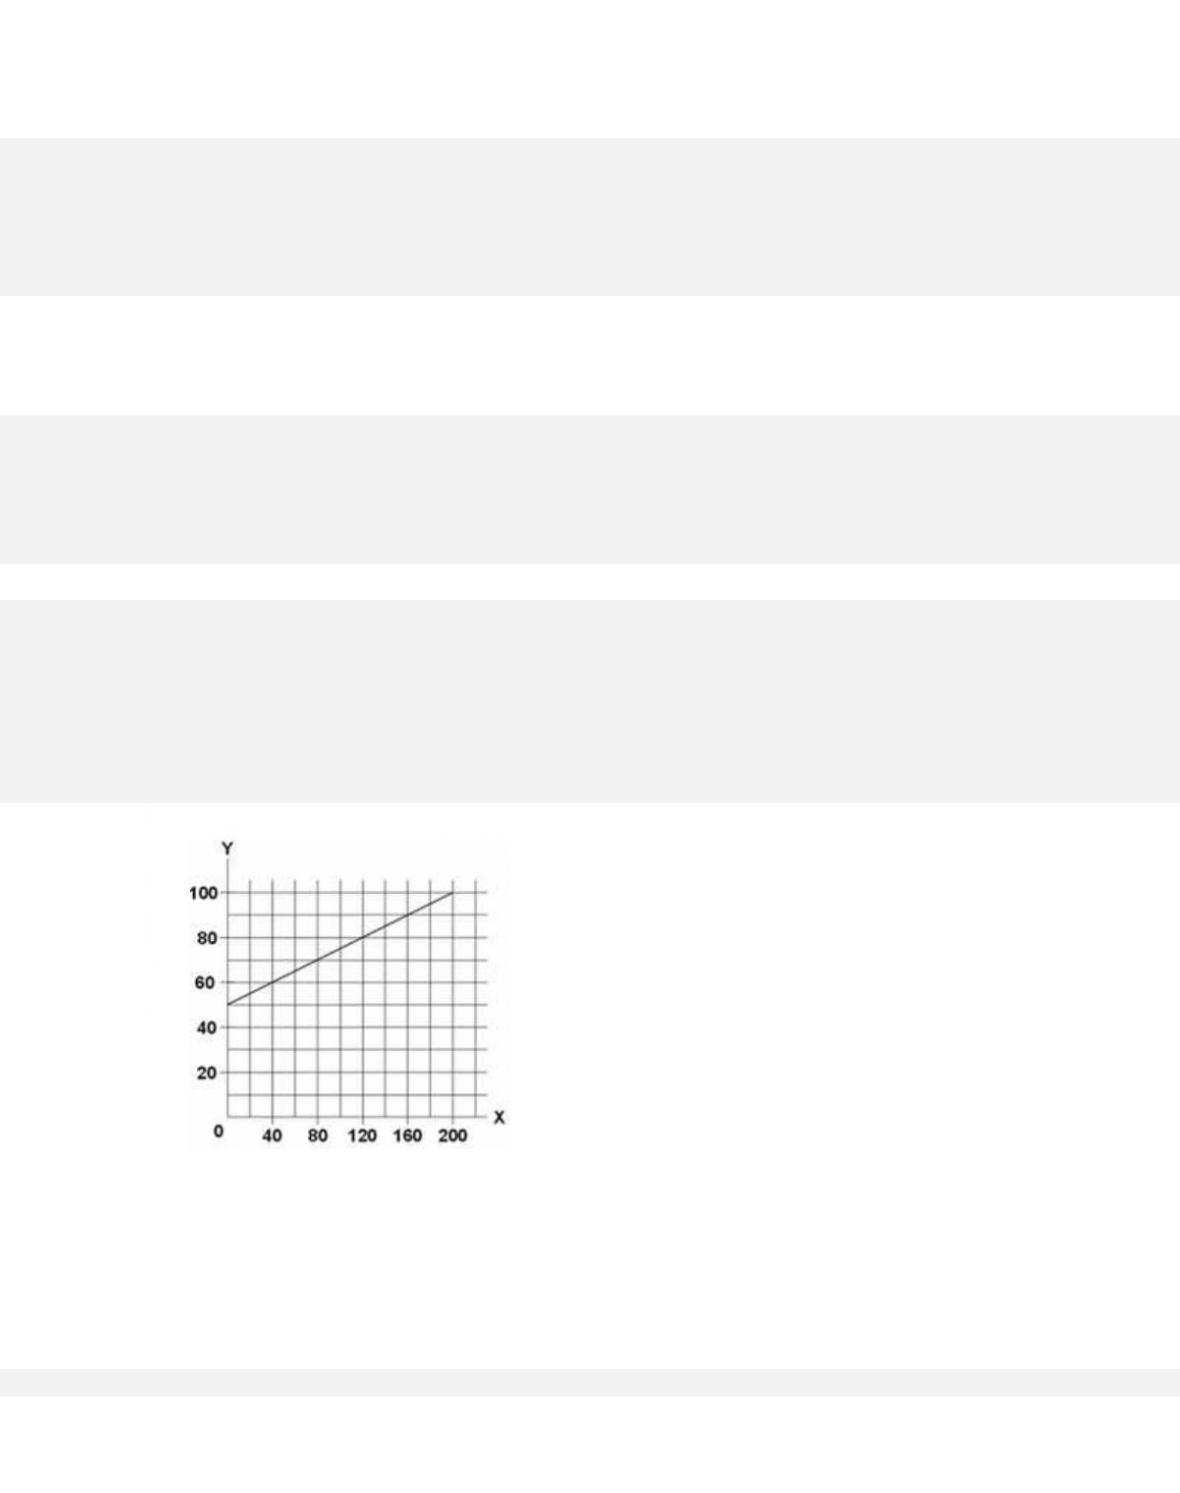
258.
Refer to the diagram. The variables X and Y are
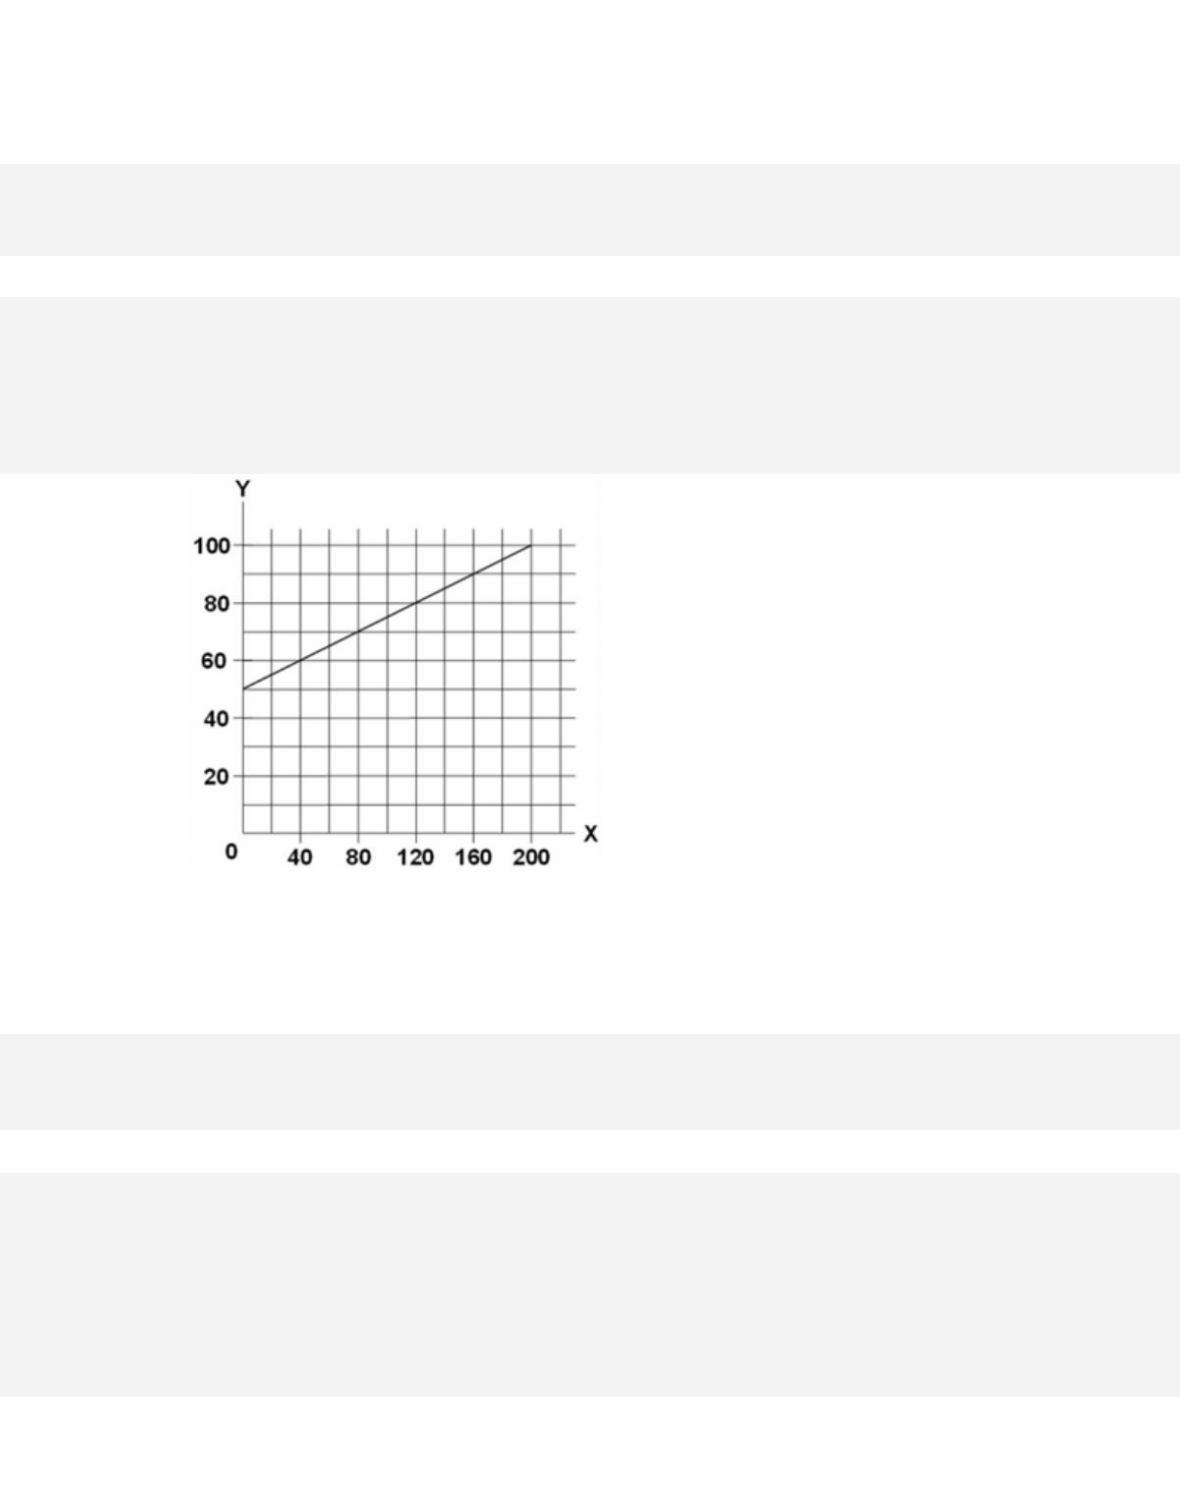
A. inversely related.
259.
Refer to the diagram. The vertical intercept
A. is 40.
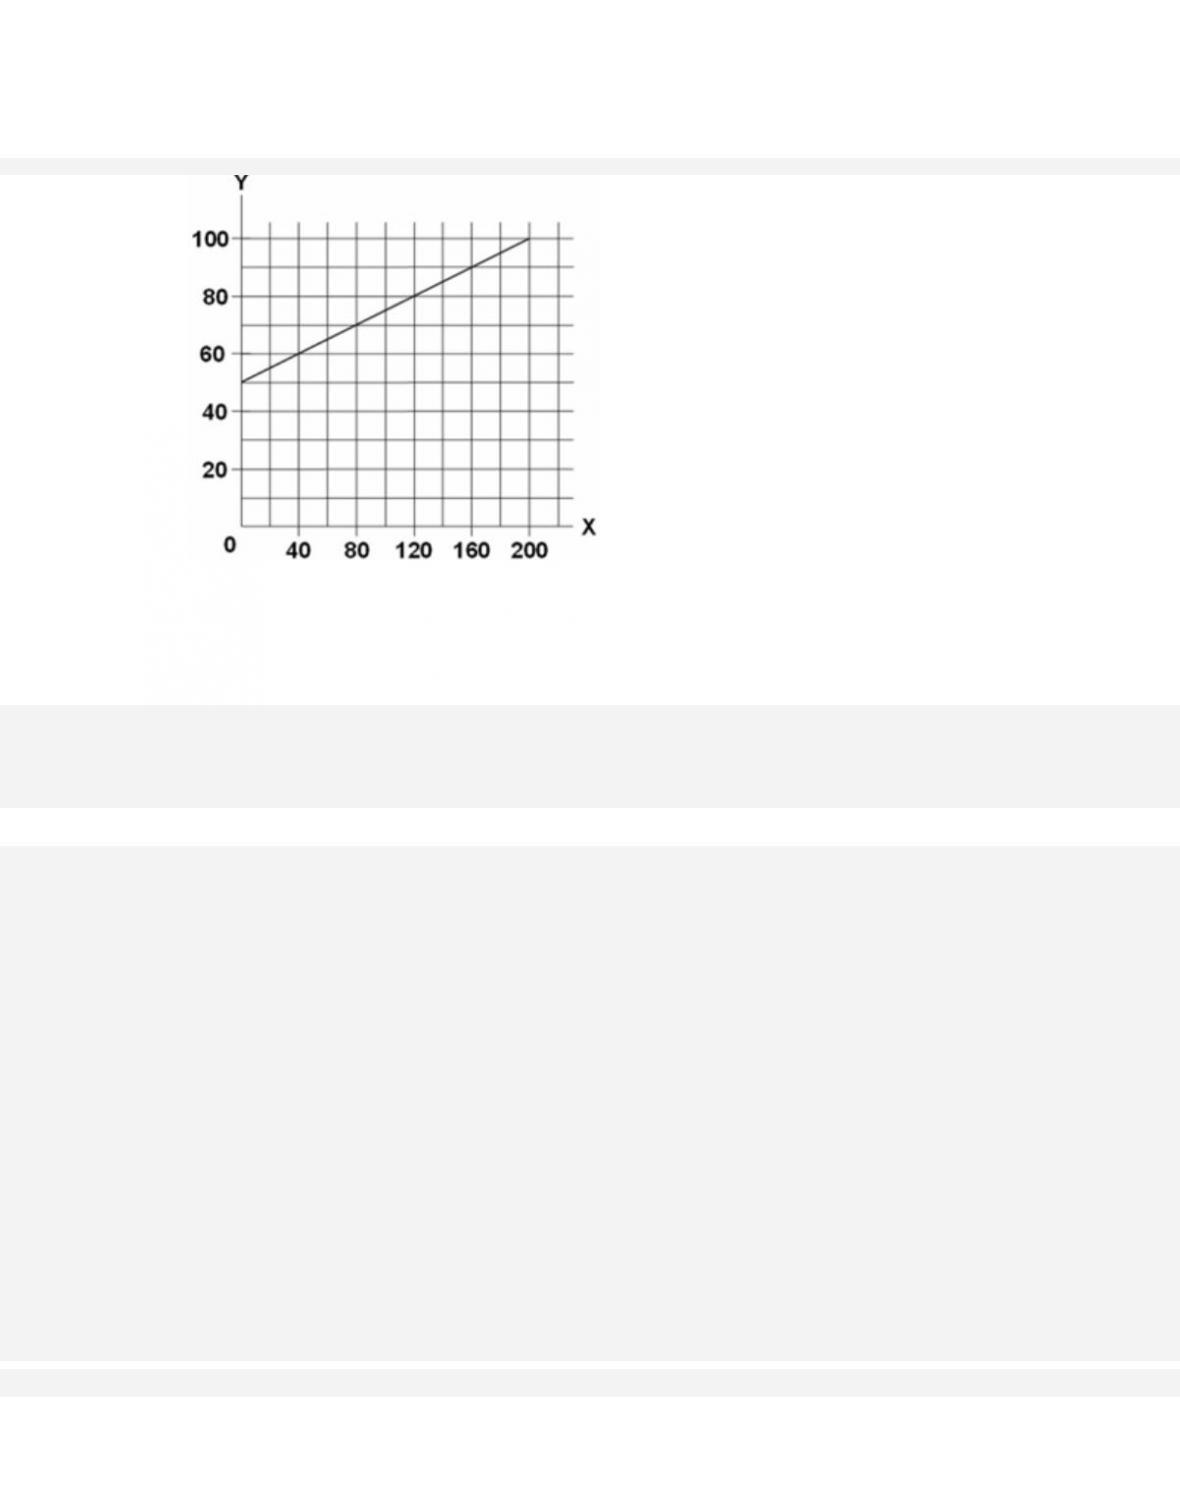
260.
Refer to the diagram. The slope of the line
A. is –¼.
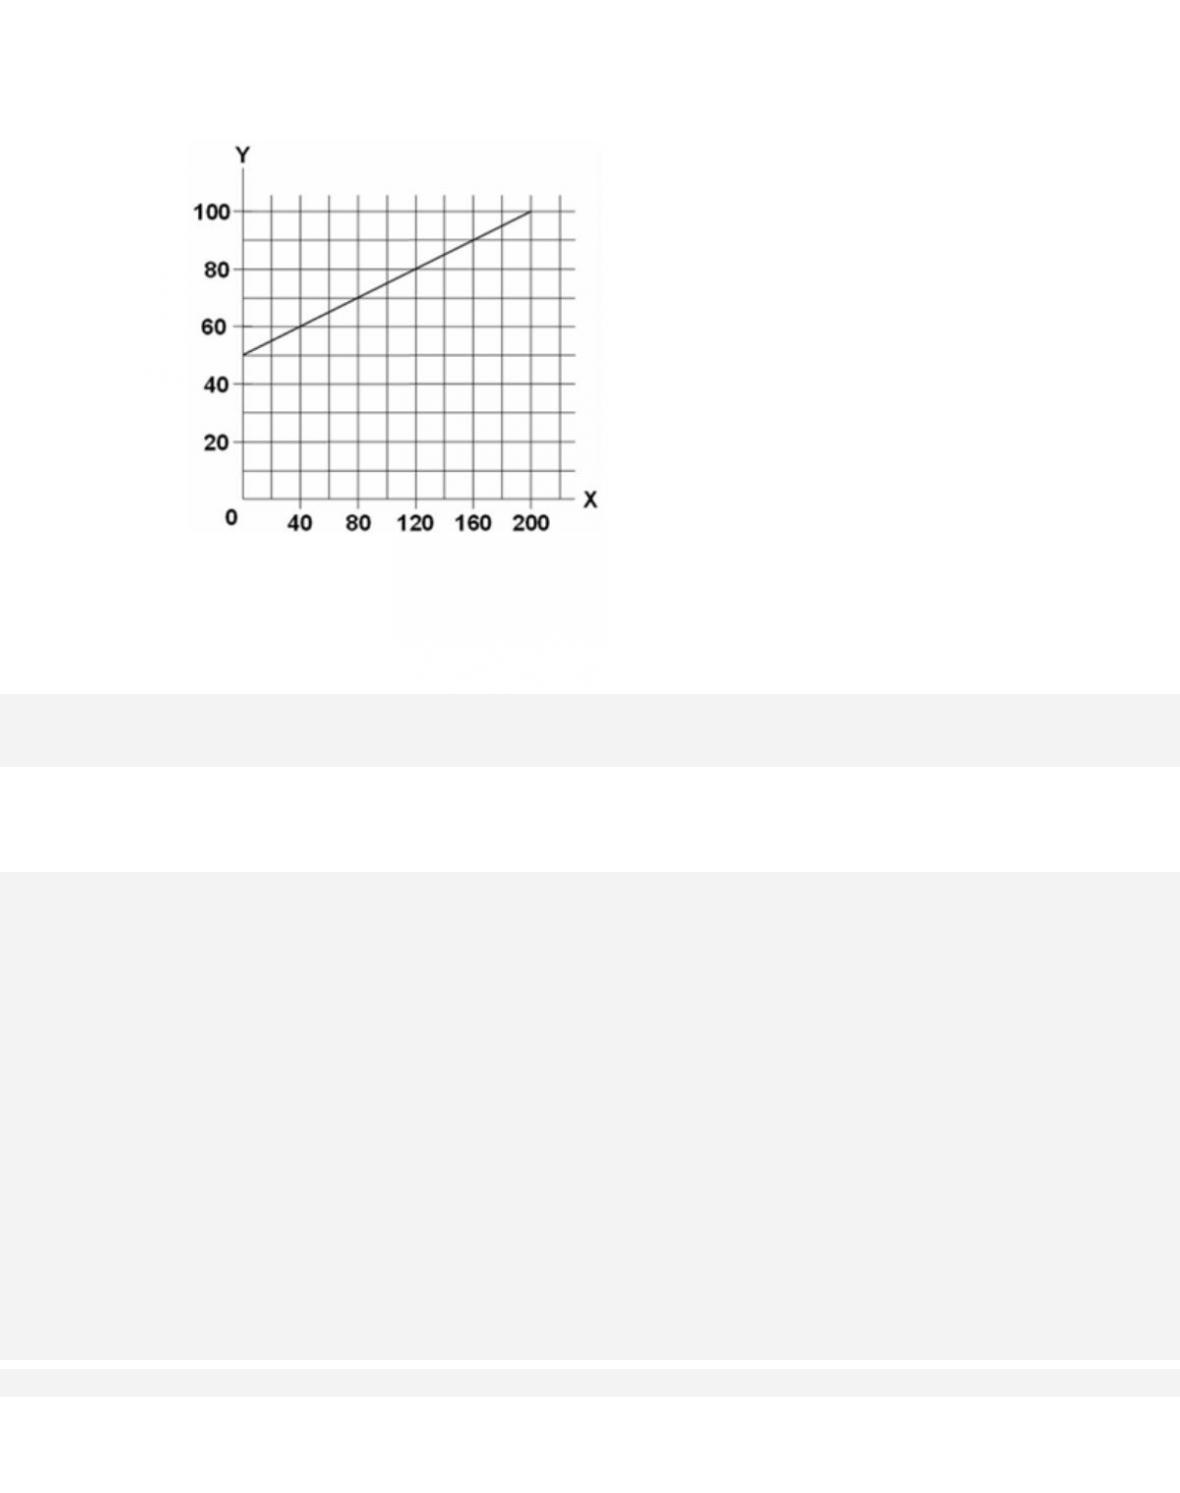
261.
Refer to the diagram. The equation that shows the relationship between Y and X is
C.
Y = .4X.
D. Y = ¼X – 50.
1-139
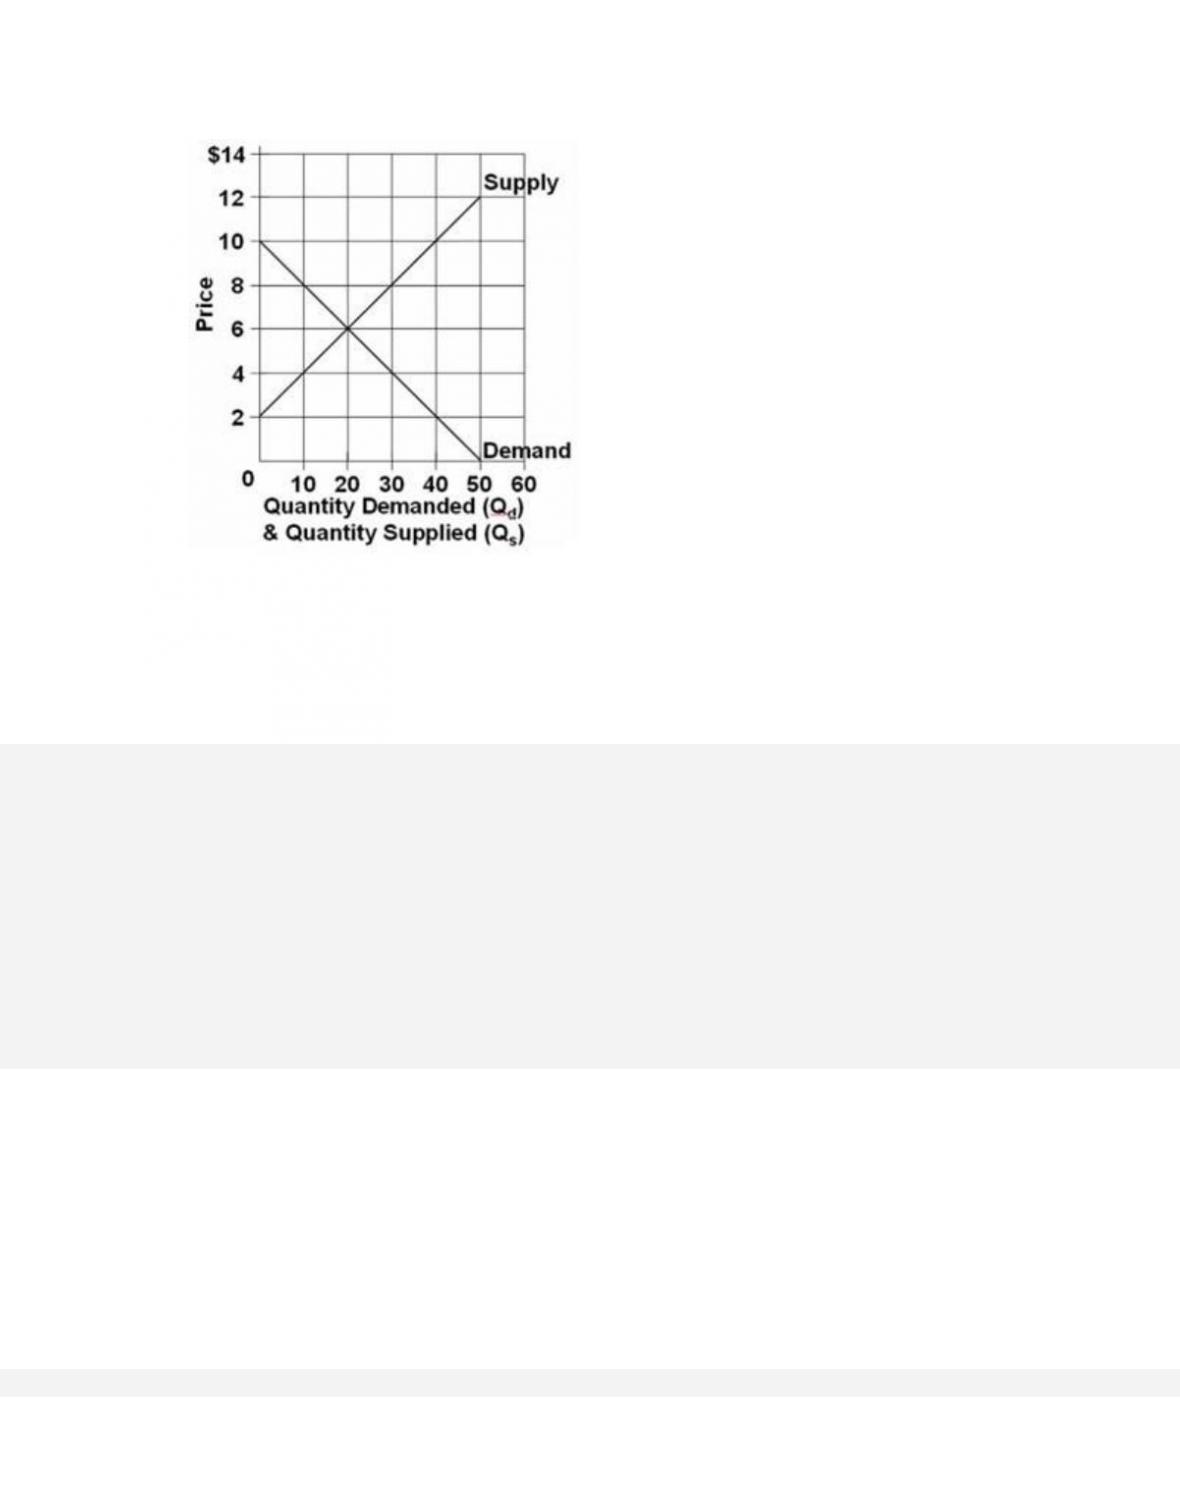
262.
Refer to the graph. Which of the following statements is correct?
A.
Quantity demanded and quantity supplied are independent of price.
1-140
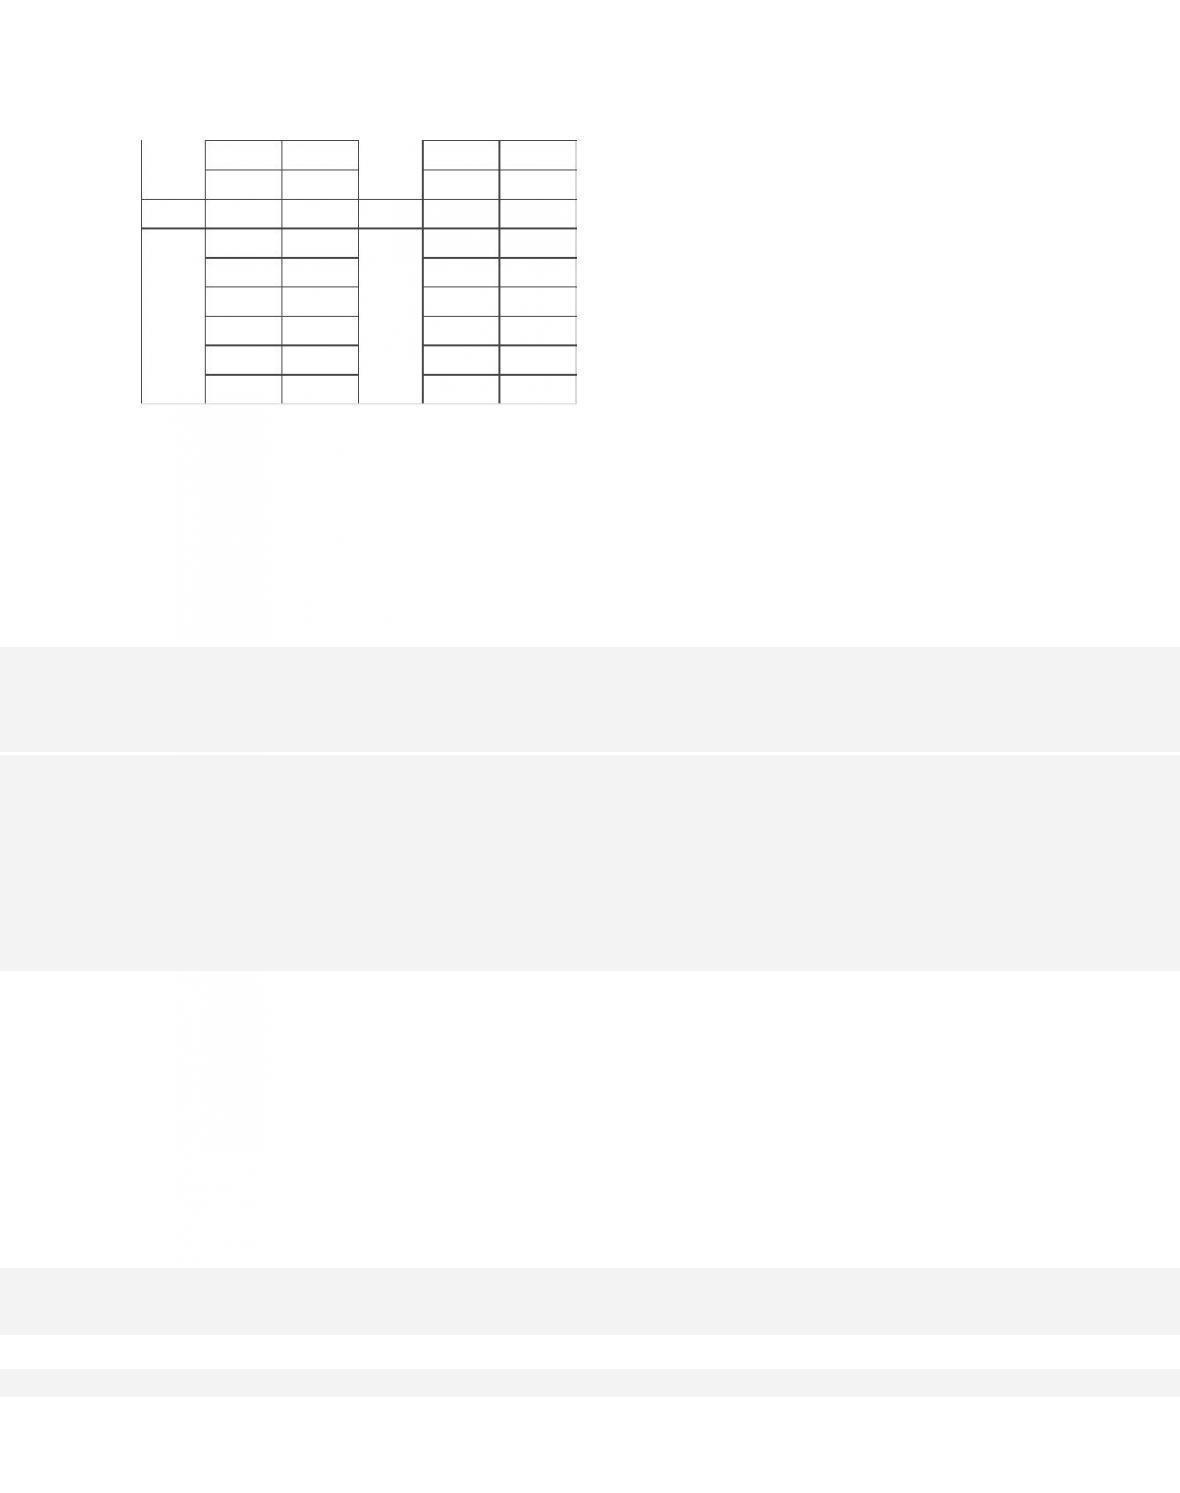
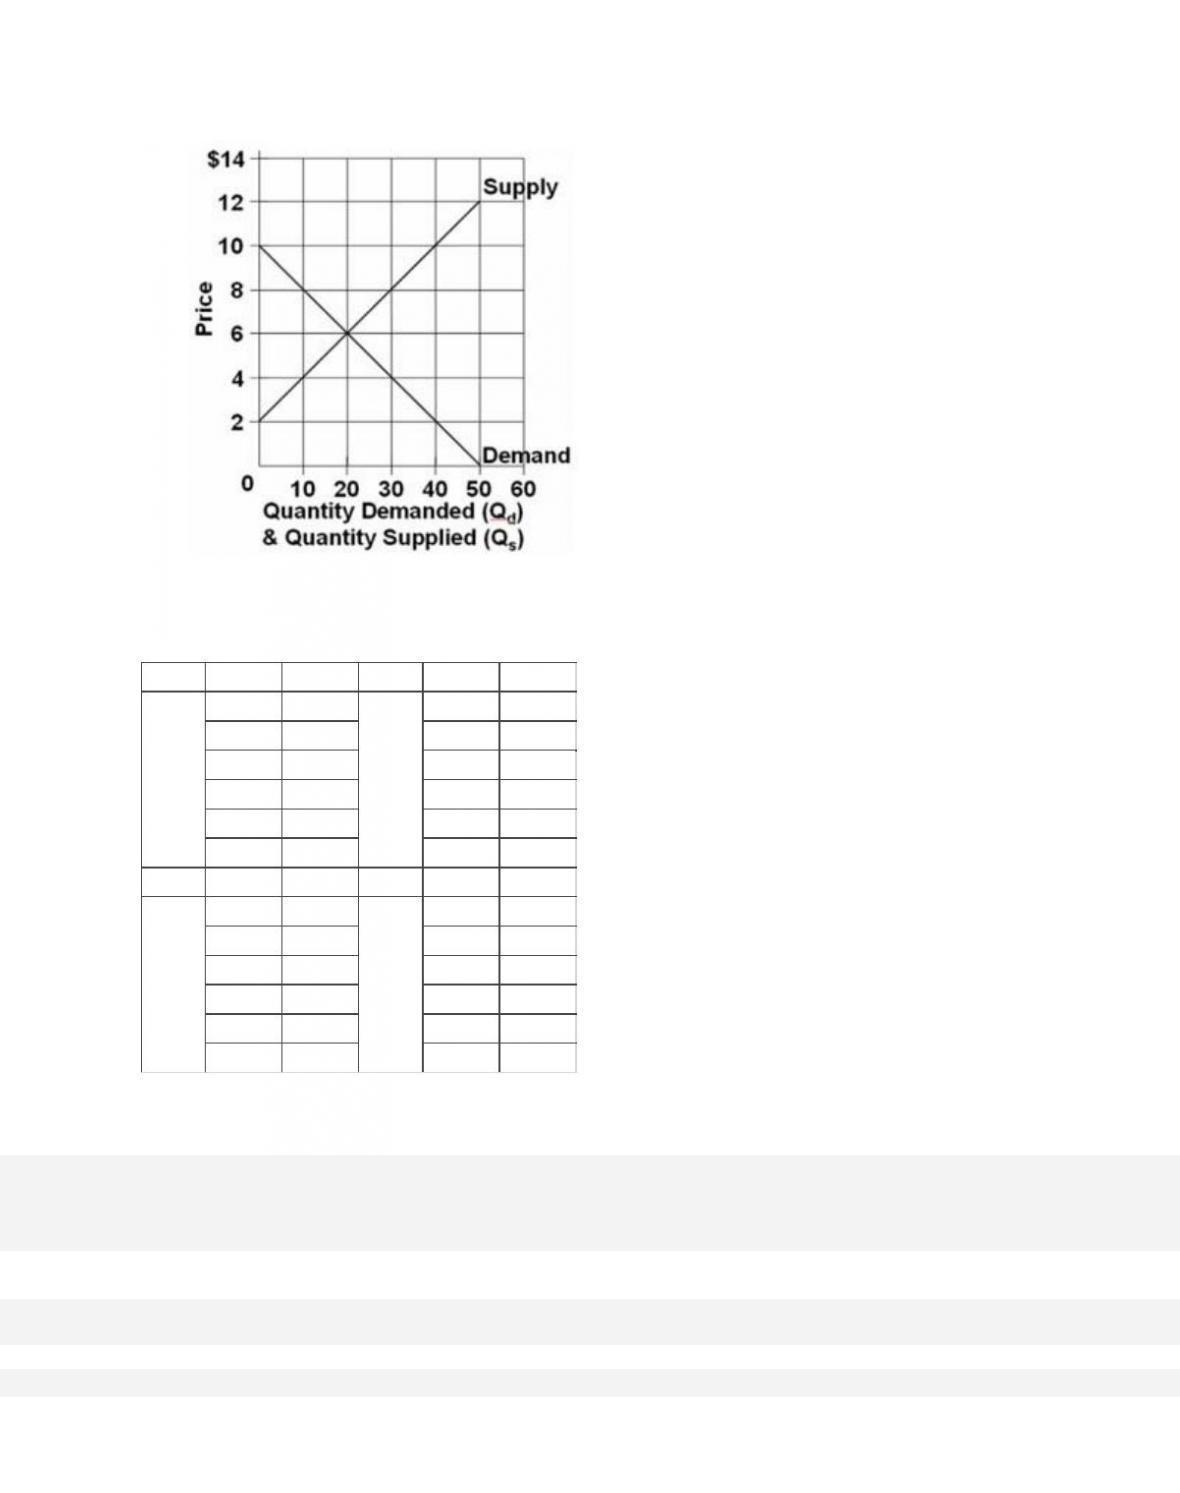
263.
Refer to the graph. Which of the following schedules correctly reflects “demand”?
A)
P
Qd
B)
P
Qd
$12
0
$14
0
10
0
12
0
8
10
10
20
6
20
8
40
4
30
6
60
2
40
4
80
C)
P
Qd
D)
P
Qd
$14
60
$12
0
12
50
10
10
10
40
8
20
8
30
6
30
6
20
4
40
4
10
2
50
D.
option D