126.
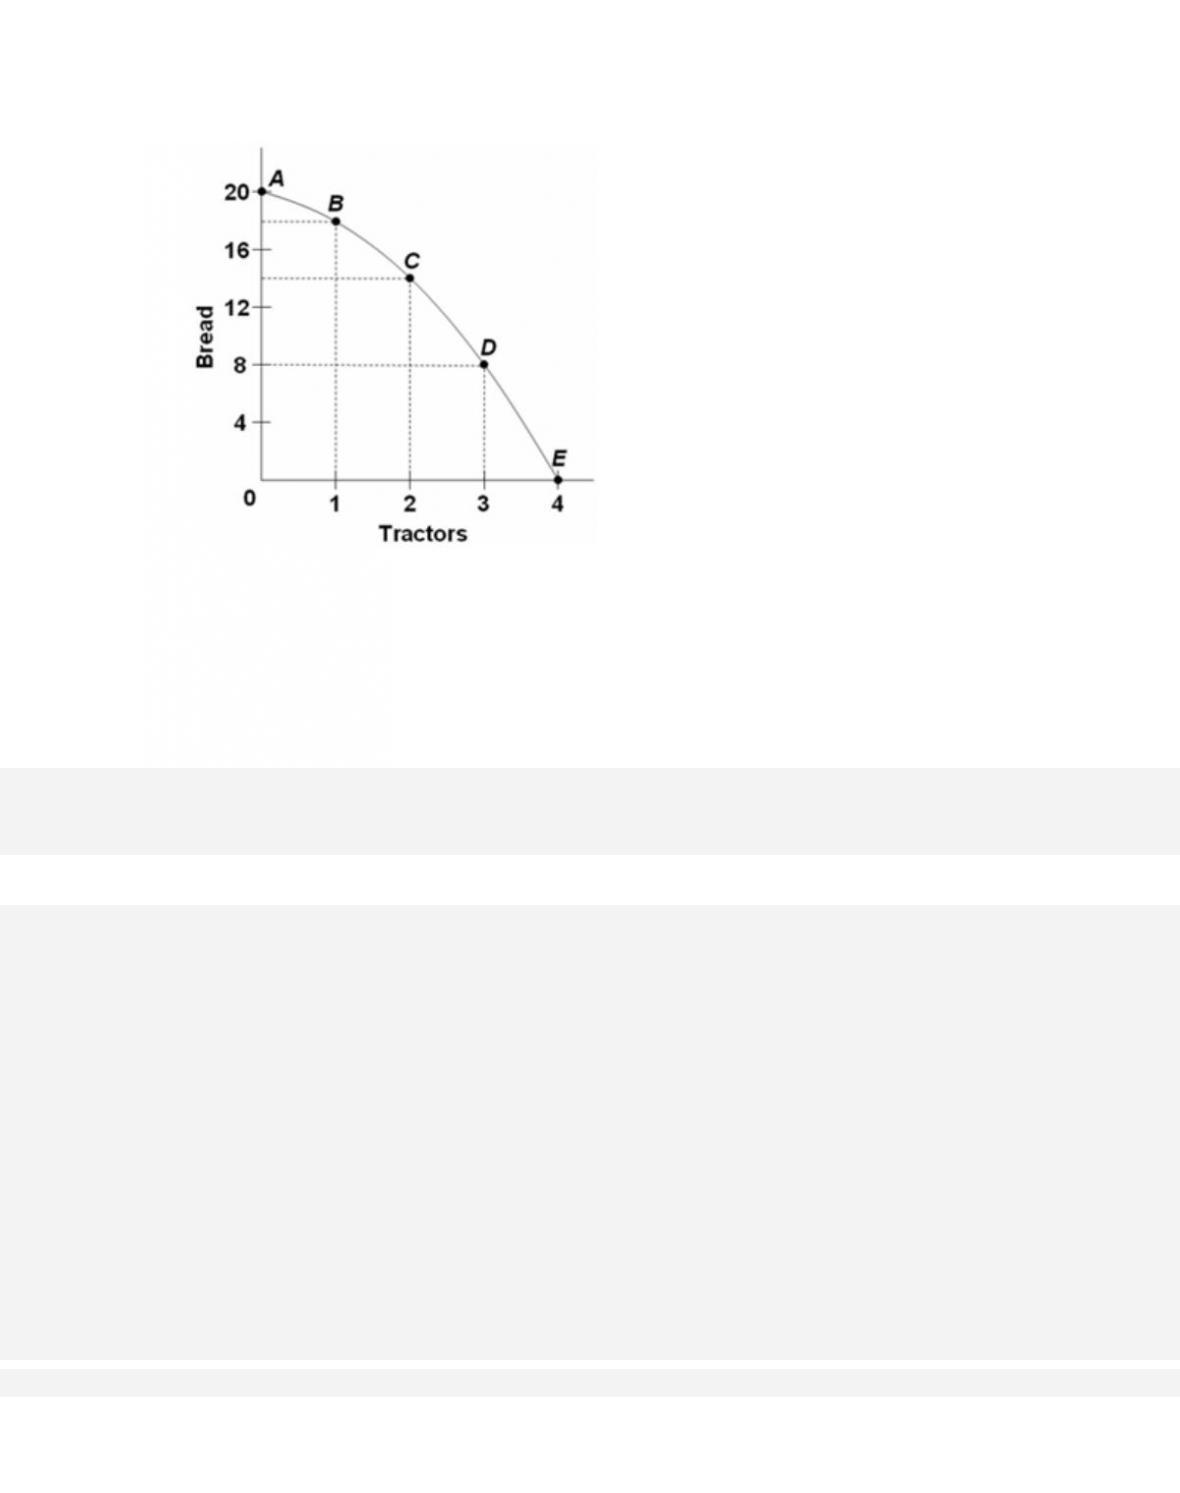
Refer to the diagram. Starting at point E, the production of successive units of bread will
cost
A.
a constant 8 units of tractors.
127.
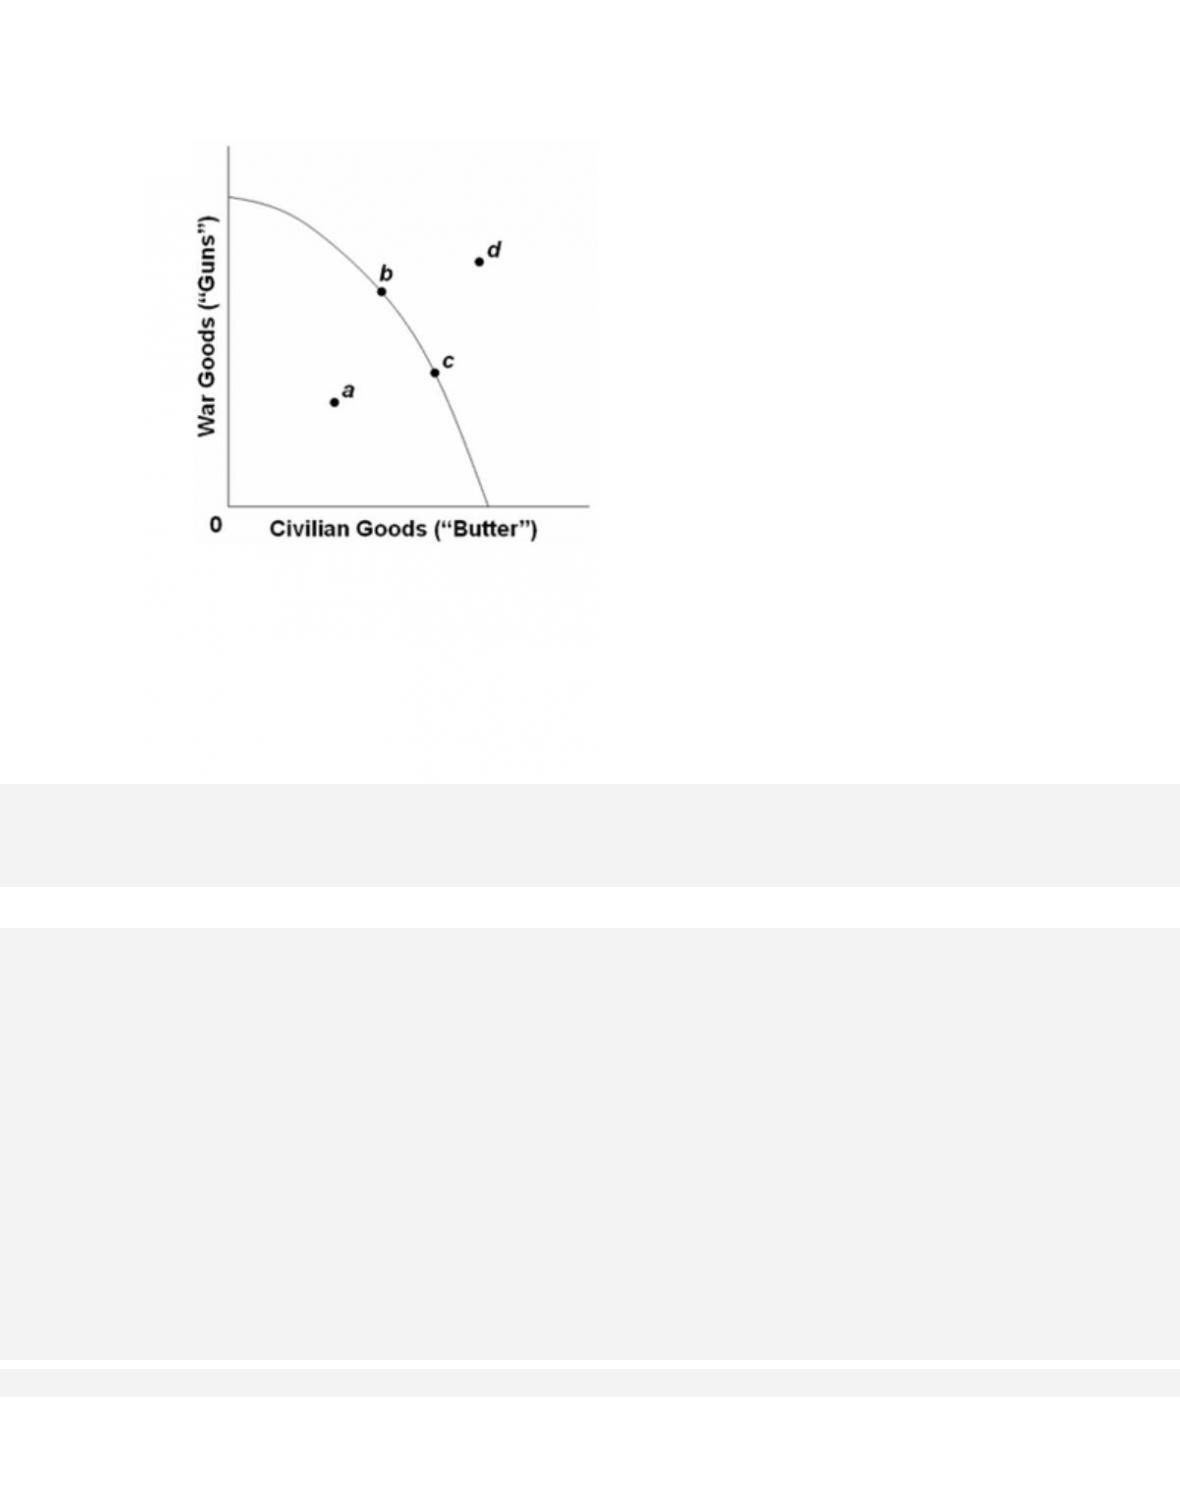
Refer to the production possibilities curve. At the onset of the Second World War, the
United States had large amounts of idle human and property resources. Its
economic
adjustment from peacetime to wartime can best be described by the movement from point
1-63
128.
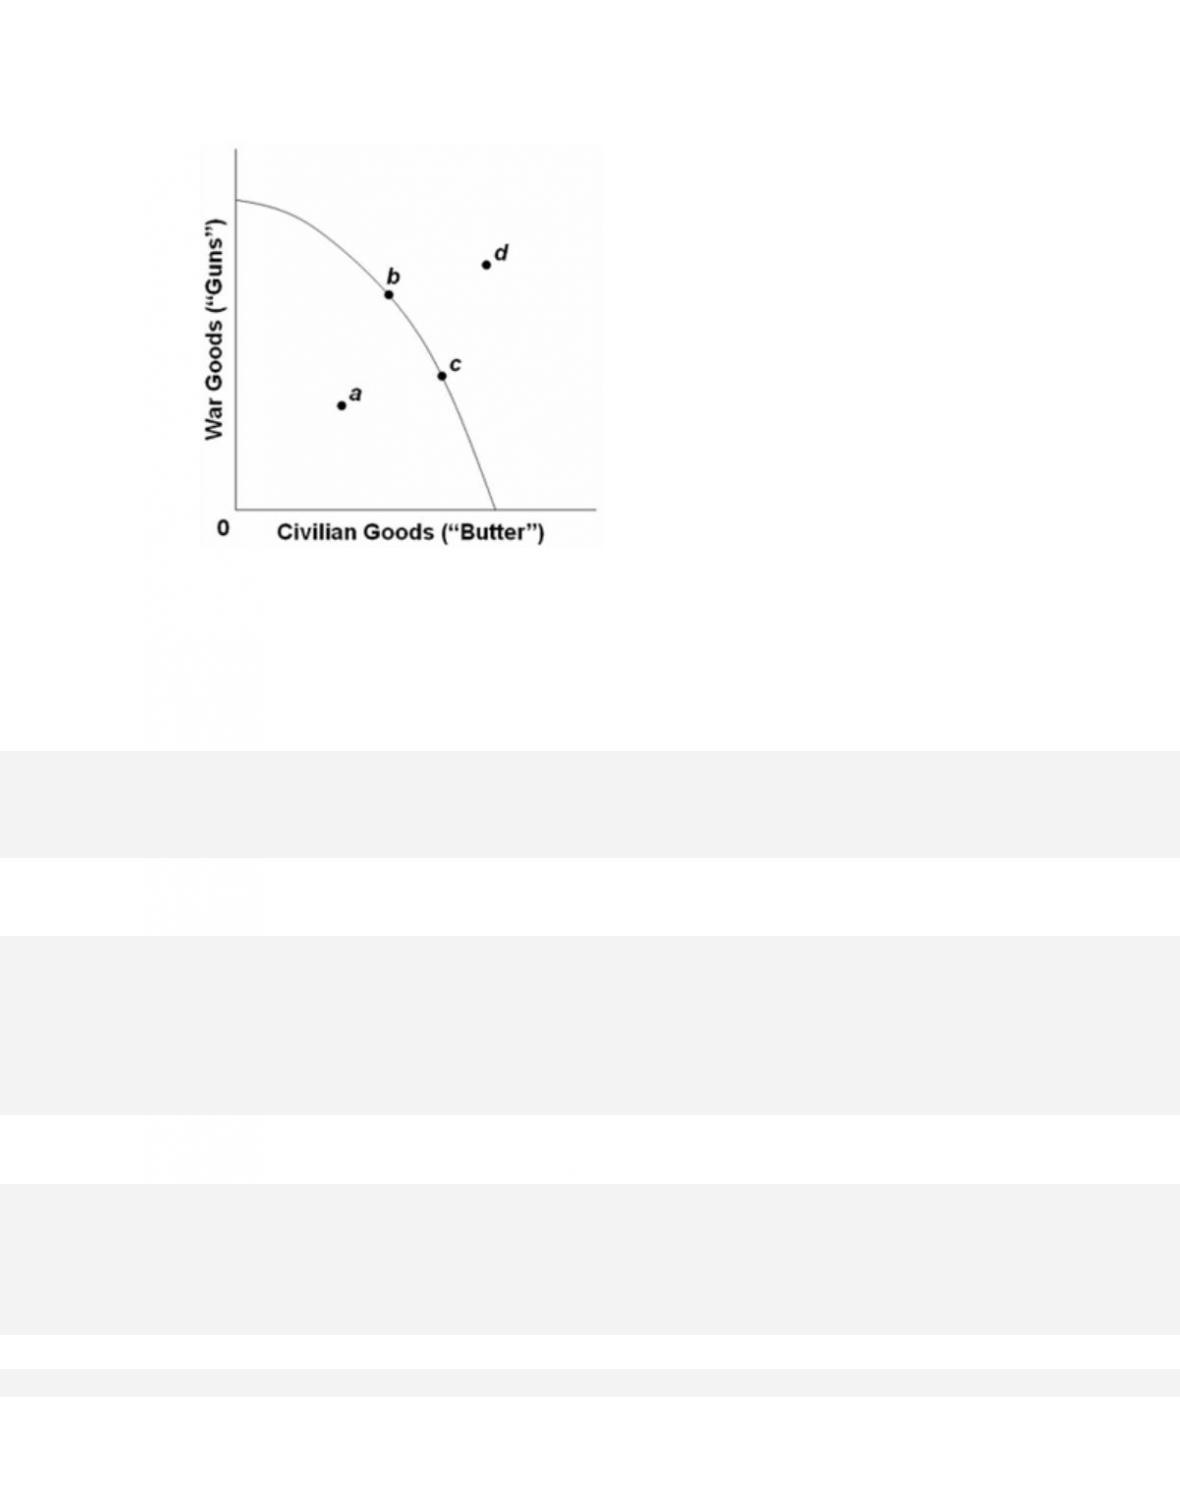
Refer to the production possibilities curve. At the onset of the Second World War, the
Soviet Union was already at full employment. Its economic adjustment from
peacetime to
wartime can best be described by the movement from point
D.
c to point d.
129.
The production possibilities curve shows

unemployed.
D.
the ideal, but unattainable, combinations of two goods that would maximize consumer
satisfaction.
130.
The negative slope of the production possibilities curve is a graphical way of
indicating that
D.
consumers buy more when prices are low than when prices are high.
131.
If an economy is operating on its production possibilities curve for consumer goods and
capital goods, this means that
A.
it is impossible to produce more consumer goods.

132.
The construction of a production possibilities curve assumes
D.
there is no inflation in the economy.
133.
A typical concave (bowed out from the origin) production possibilities curve implies
A. that economic resources are unlimited.
134.
The production possibilities curve tells us
A.
the specific combination of two products that is most desired by society.

1-66
135.
The production possibilities curve has
D.
a negative slope that is constant as we move along it from left to right.
136.
Answer the question on the basis of the following production possibilities tables for
two countries, North Cantina and South Cantina.
North Cantina Production Possibilities
A
B
C
D
E
F
Capital Goods
5
4
3
2
1
0
Consumer
Goods
0
10
18
24
28
30
South Cantina Production Possibilities
A
B
C
D
E
F
Capital Goods
5
4
3
2
1
0
Consumer
Goods
0
8
15
21
25
27
Refer to the tables. If South Cantina is producing at production alternative D, the opportunity
cost of the third unit of capital goods will be

1-67
A.
3 units of consumer goods.
137.
Answer the question on the basis of the following production possibilities tables for
two countries, North Cantina and South Cantina.
North Cantina Production Possibilities
A
B
C
D
E
F
Capital Goods
5
4
3
2
1
0
Consumer
Goods
0
10
18
24
28
30
South Cantina Production Possibilities
A
B
C
D
E
F
Capital Goods
5
4
3
2
1
0
Consumer
Goods
0
8
15
21
25
27
Refer to the tables. If North Cantina is producing at production alternative B, the opportunity
cost of the eleventh unit of consumer goods will be
A.
10 units of capital goods.

1-68
138.
Answer the question on the basis of the following production possibilities tables for
two countries, North Cantina and South Cantina.
North Cantina Production Possibilities
A
B
C
D
E
F
Capital Goods
5
4
3
2
1
0
Consumer
Goods
0
10
18
24
28
30
South Cantina Production Possibilities
A
B
C
D
E
F
Capital Goods
5
4
3
2
1
0
Consumer
Goods
0
8
15
21
25
27
Refer to the tables. Suppose that North Cantina is producing 2 units of capital goods
and 17 units of consumer goods, while South Cantina is producing 2 units of
capital
goods and 21 units of consumer goods. We can conclude that
D.
both South Cantina and North Cantina are fully and efficiently using their resources.
139.
Answer the question on the basis of the following production possibilities tables for
two countries, North Cantina and South Cantina.

1-69
North Cantina Production Possibilities
A
B
C
D
E
F
Capital Goods
5
4
3
2
1
0
Consumer
Goods
0
10
18
24
28
30
South Cantina Production Possibilities
A
B
C
D
E
F
Capital Goods
5
4
3
2
1
0
Consumer
Goods
0
8
15
21
25
27
Refer to the tables. Suppose that resources in North Cantina and South Cantina are identical
in quantity and quality. We can conclude that
A.
South Cantina has better technology than North Cantina in producing both capital and
consumer goods.
140.
Answer the question on the basis of the following production possibilities tables for
two countries, North Cantina and South Cantina.
North Cantina Production Possibilities
A
B
C
D
E
F
Capital Goods
5
4
3
2
1
0
Consumer
0
10
18
24
28
30

Goods
South Cantina Production Possibilities
A
B
C
D
E
F
Capital Goods
5
4
3
2
1
0
Consumer
Goods
0
8
15
21
25
27
Refer to the tables. The opportunity cost of the fifth unit of capital goods
D.
cannot be determined from the information provided.
141. If an economy is operating inside its production possibilities curve for consumer goods
and capital goods, it
A.
can only produce more consumer goods by producing fewer capital goods.
1-71
142.
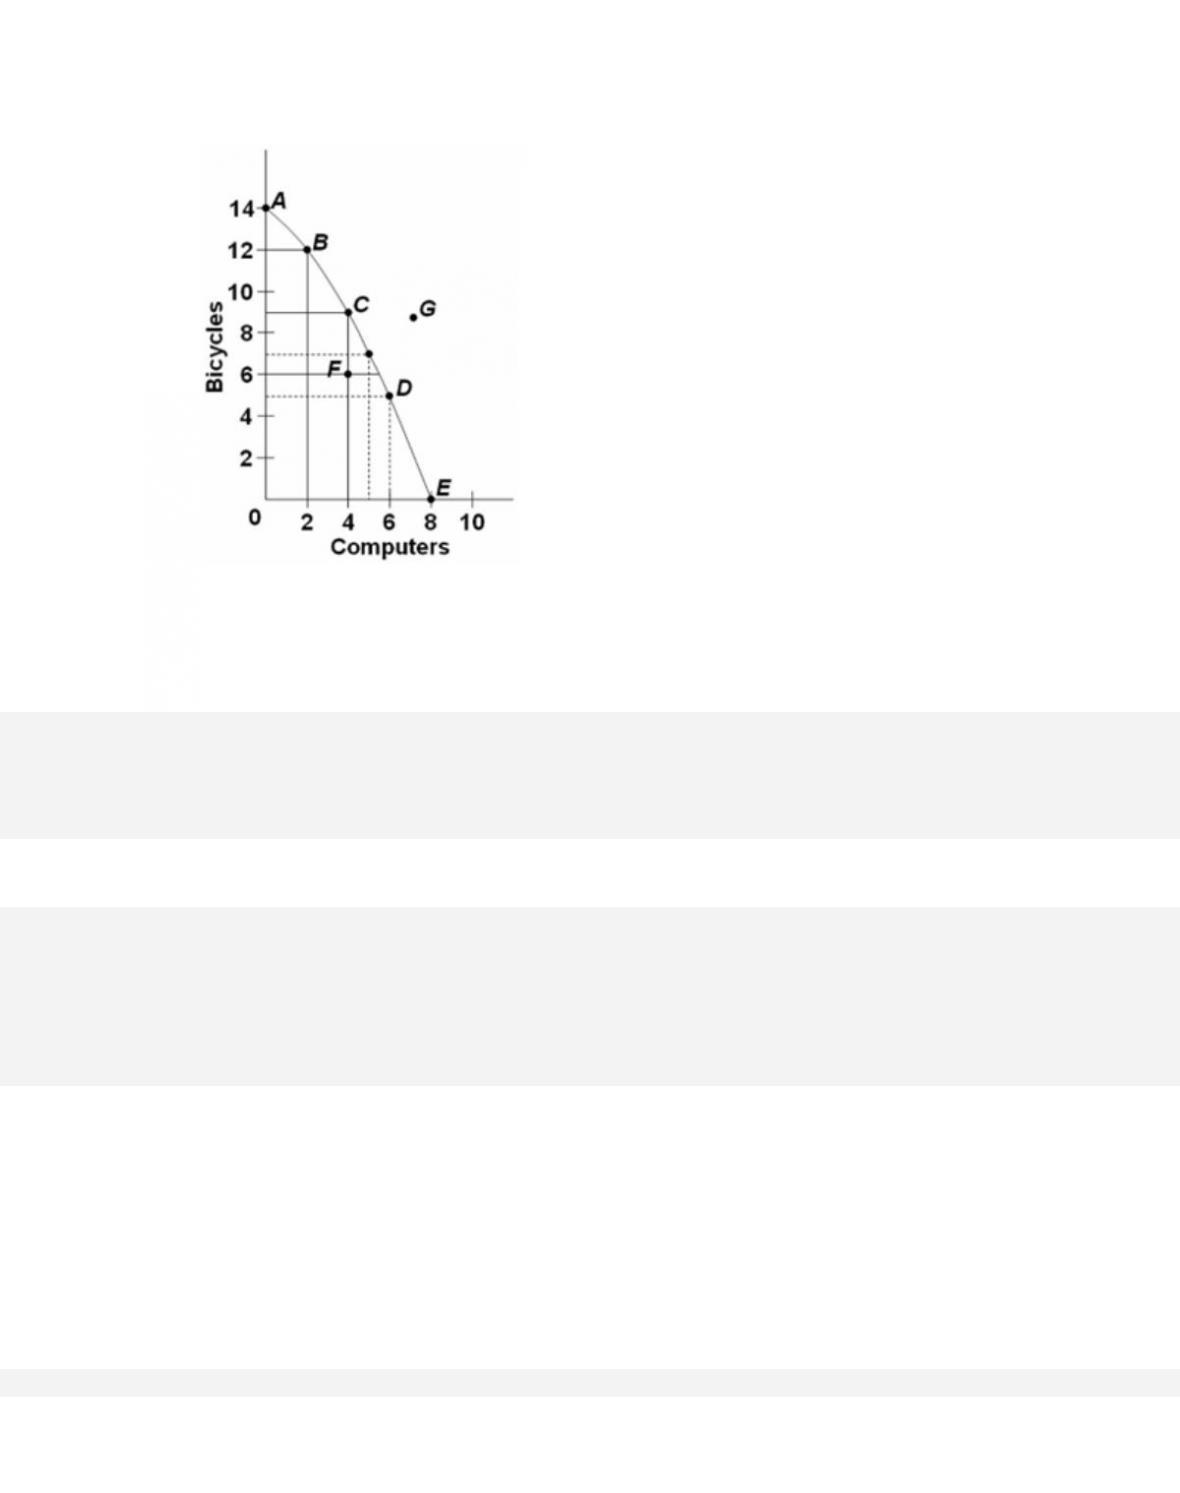
Refer to the diagram. Points A, B, C, D, and E show
D.
that society‘s demand for bicycles is greater than its demand for computers.
143.
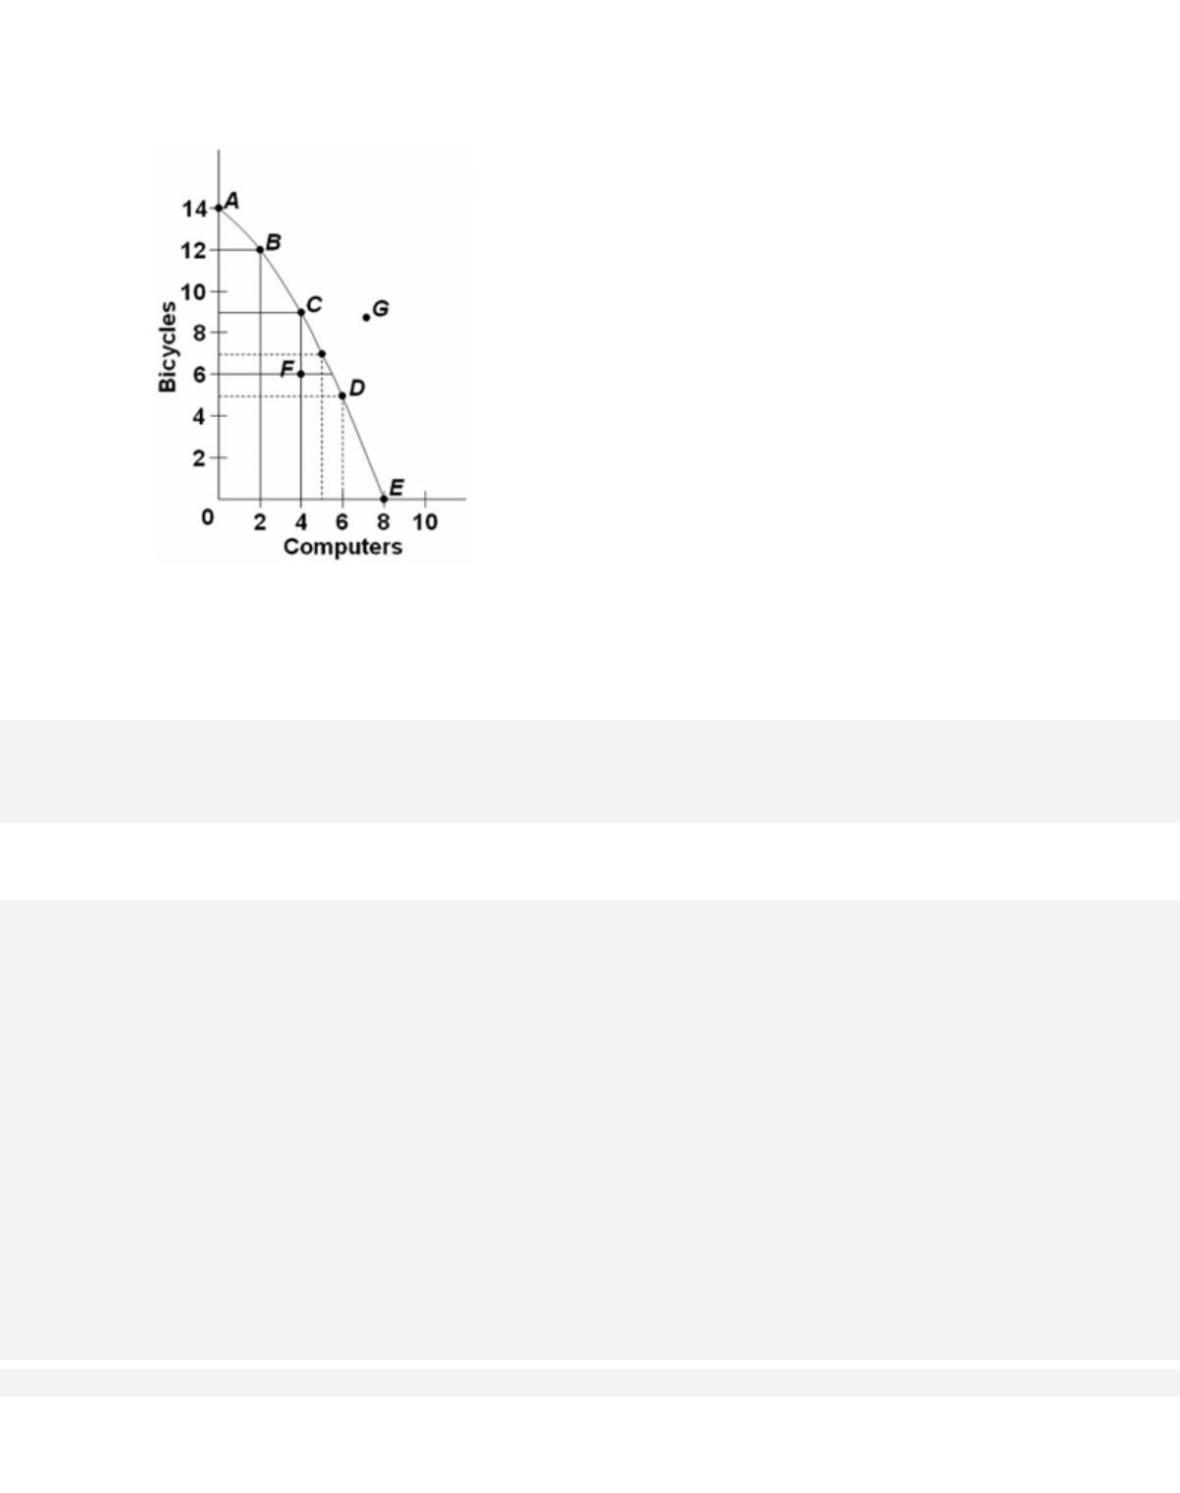
Refer to the diagram. If society is currently producing 9 units of bicycles and 4 units of
computers and it now decides to increase computer output to 6, the cost
D.
of doing so cannot be determined from the information given.
1-73
144.
Refer to the diagram. The combination of computers and bicycles shown by point G is
D.
irrelevant because it is inconsistent with consumer preferences.
1-74
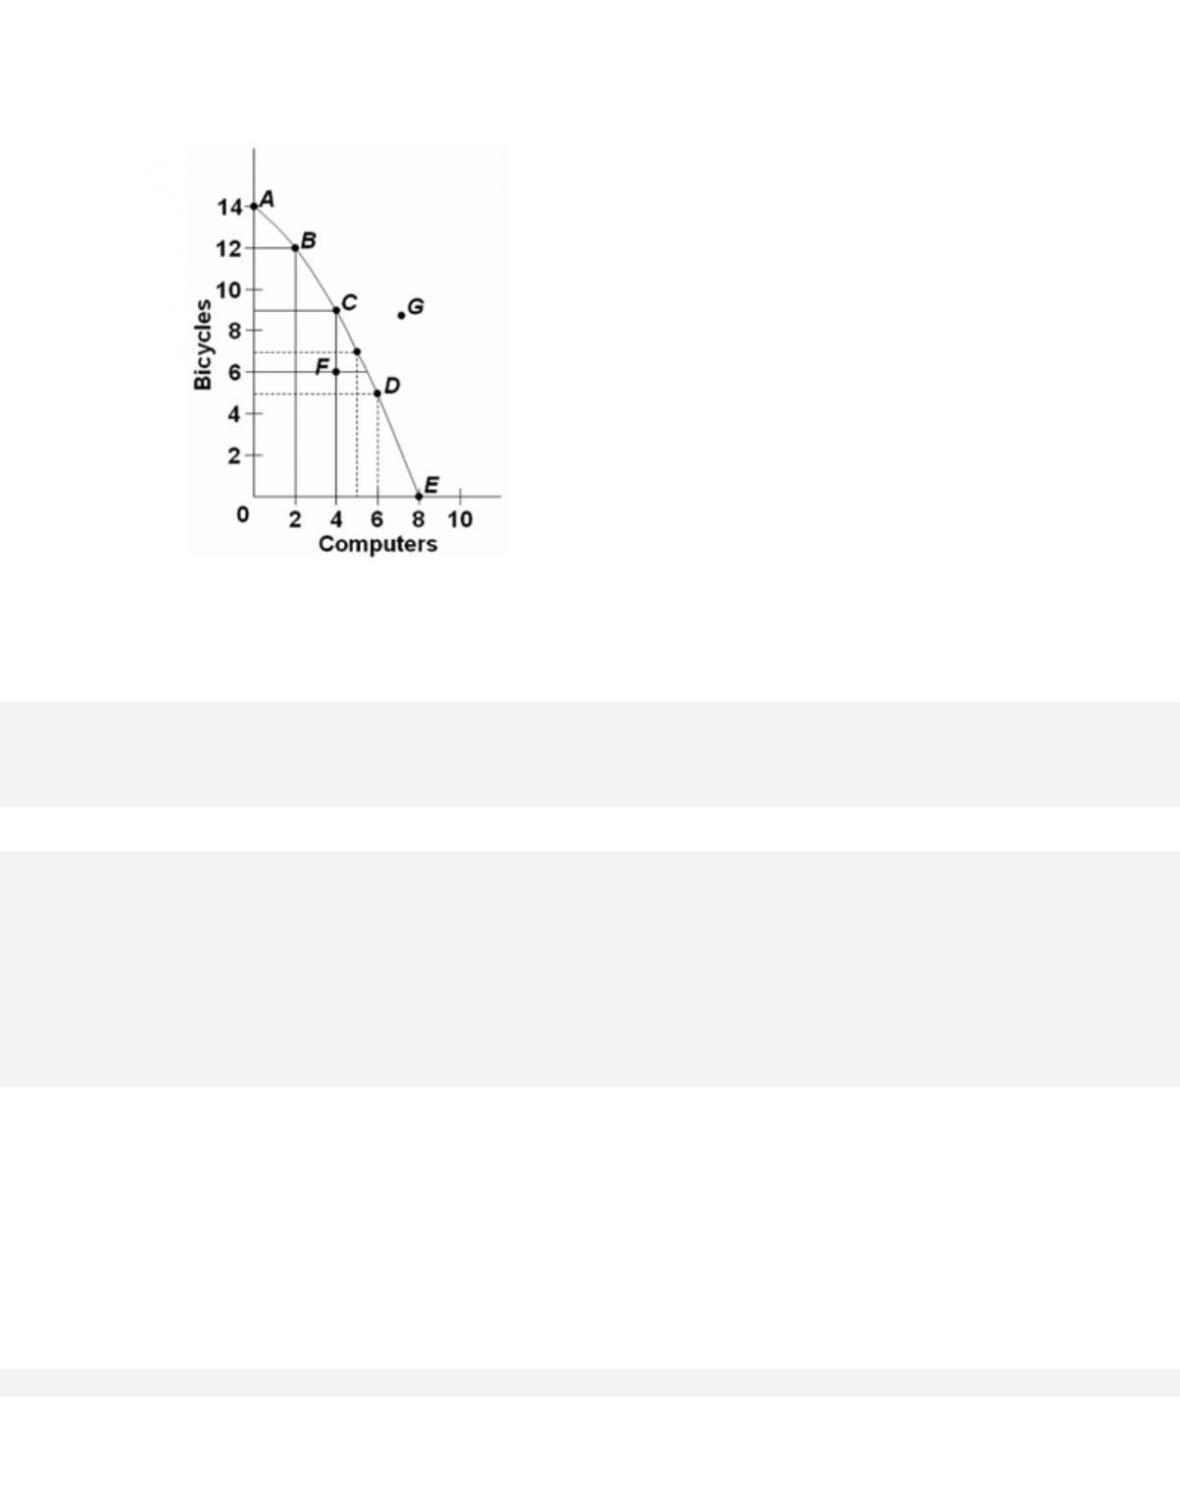
145.
Refer to the diagram. If society is currently producing the combination of bicycles and
computers shown by point D, the production of 2 more units of bicycles
D.
will cause some resources to become unemployed.
146.
Refer to the diagram. The combination of computers and bicycles shown by point F
A. is unattainable given currently available resources and technology.
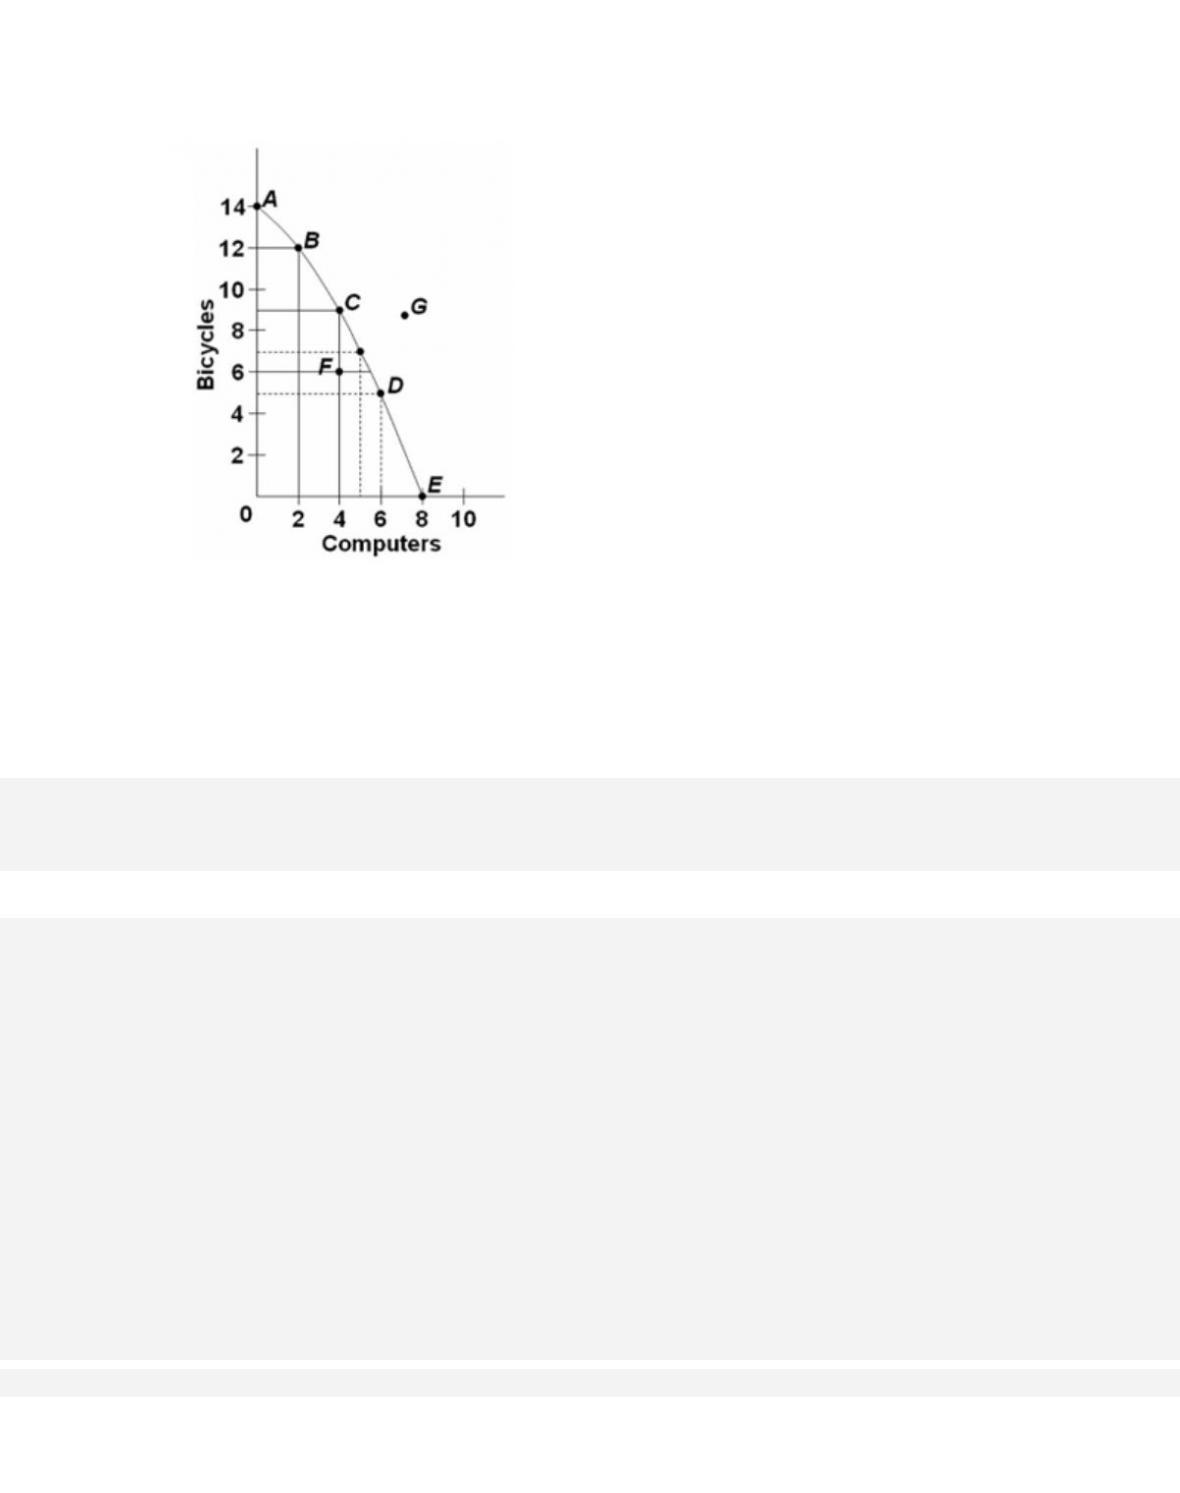
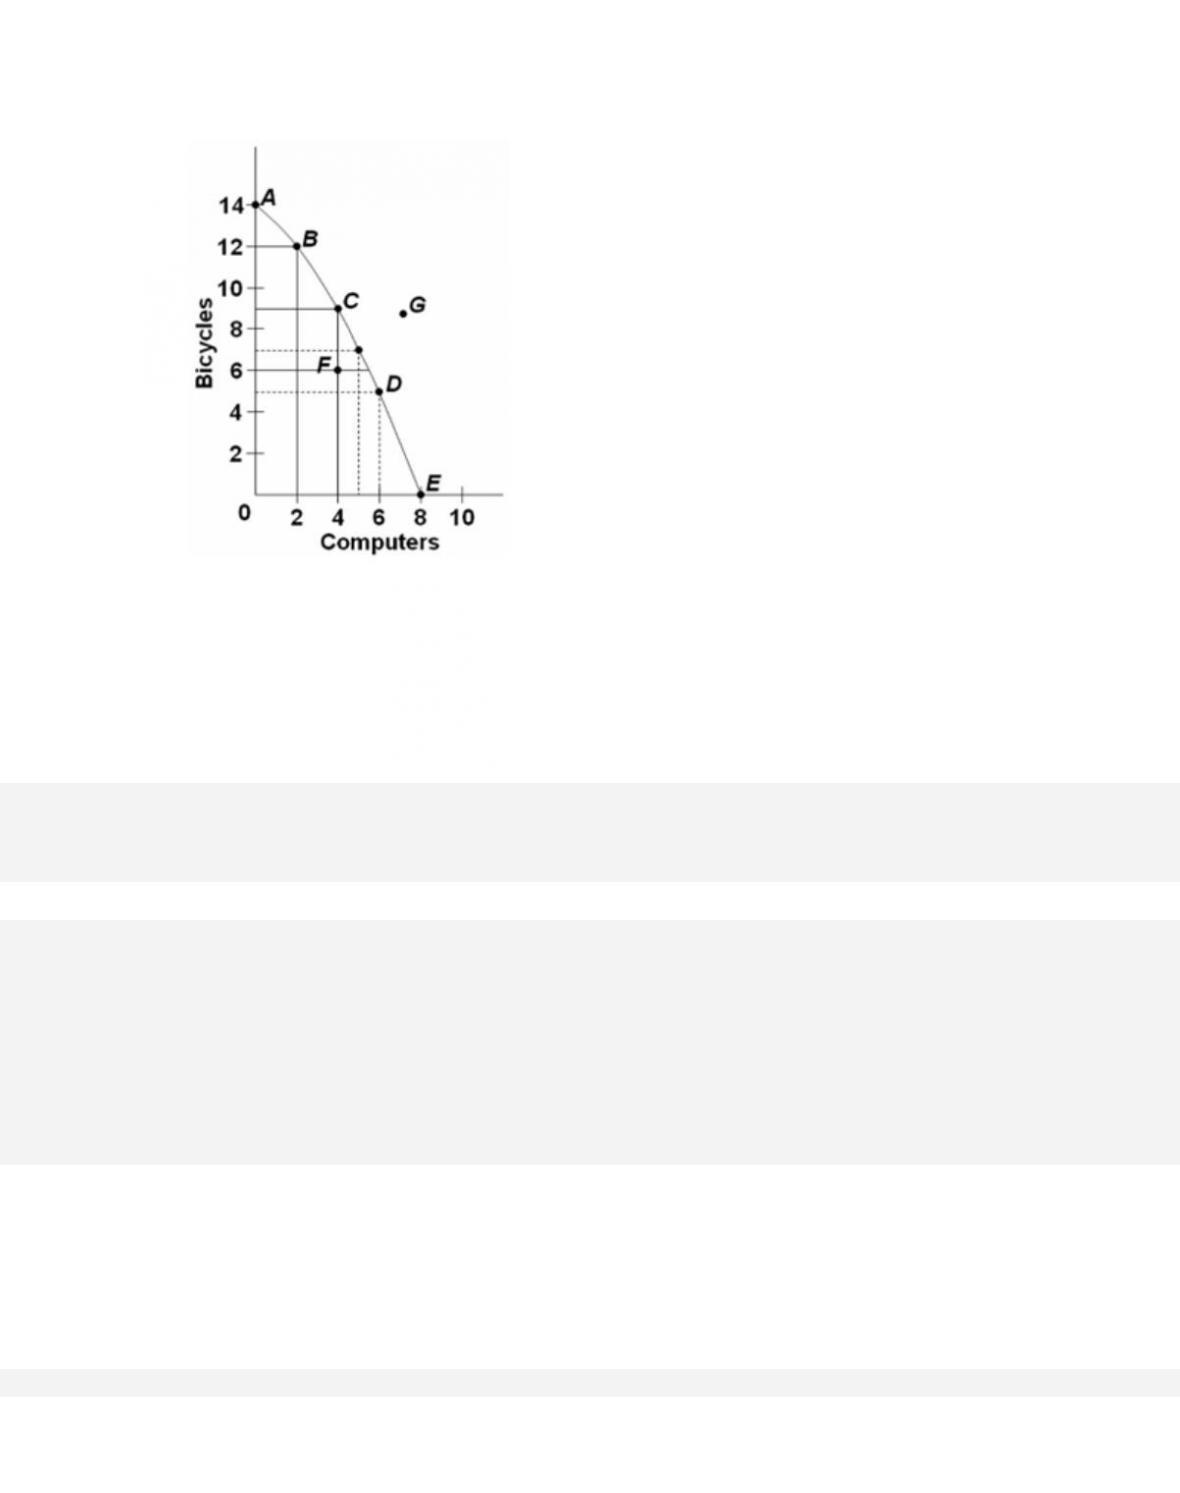
147.
Refer to the diagram. The movement down the production possibilities curve from point A to
point E suggests that the production of
A.
computers, but not bicycles, is subject to increasing opportunity costs.
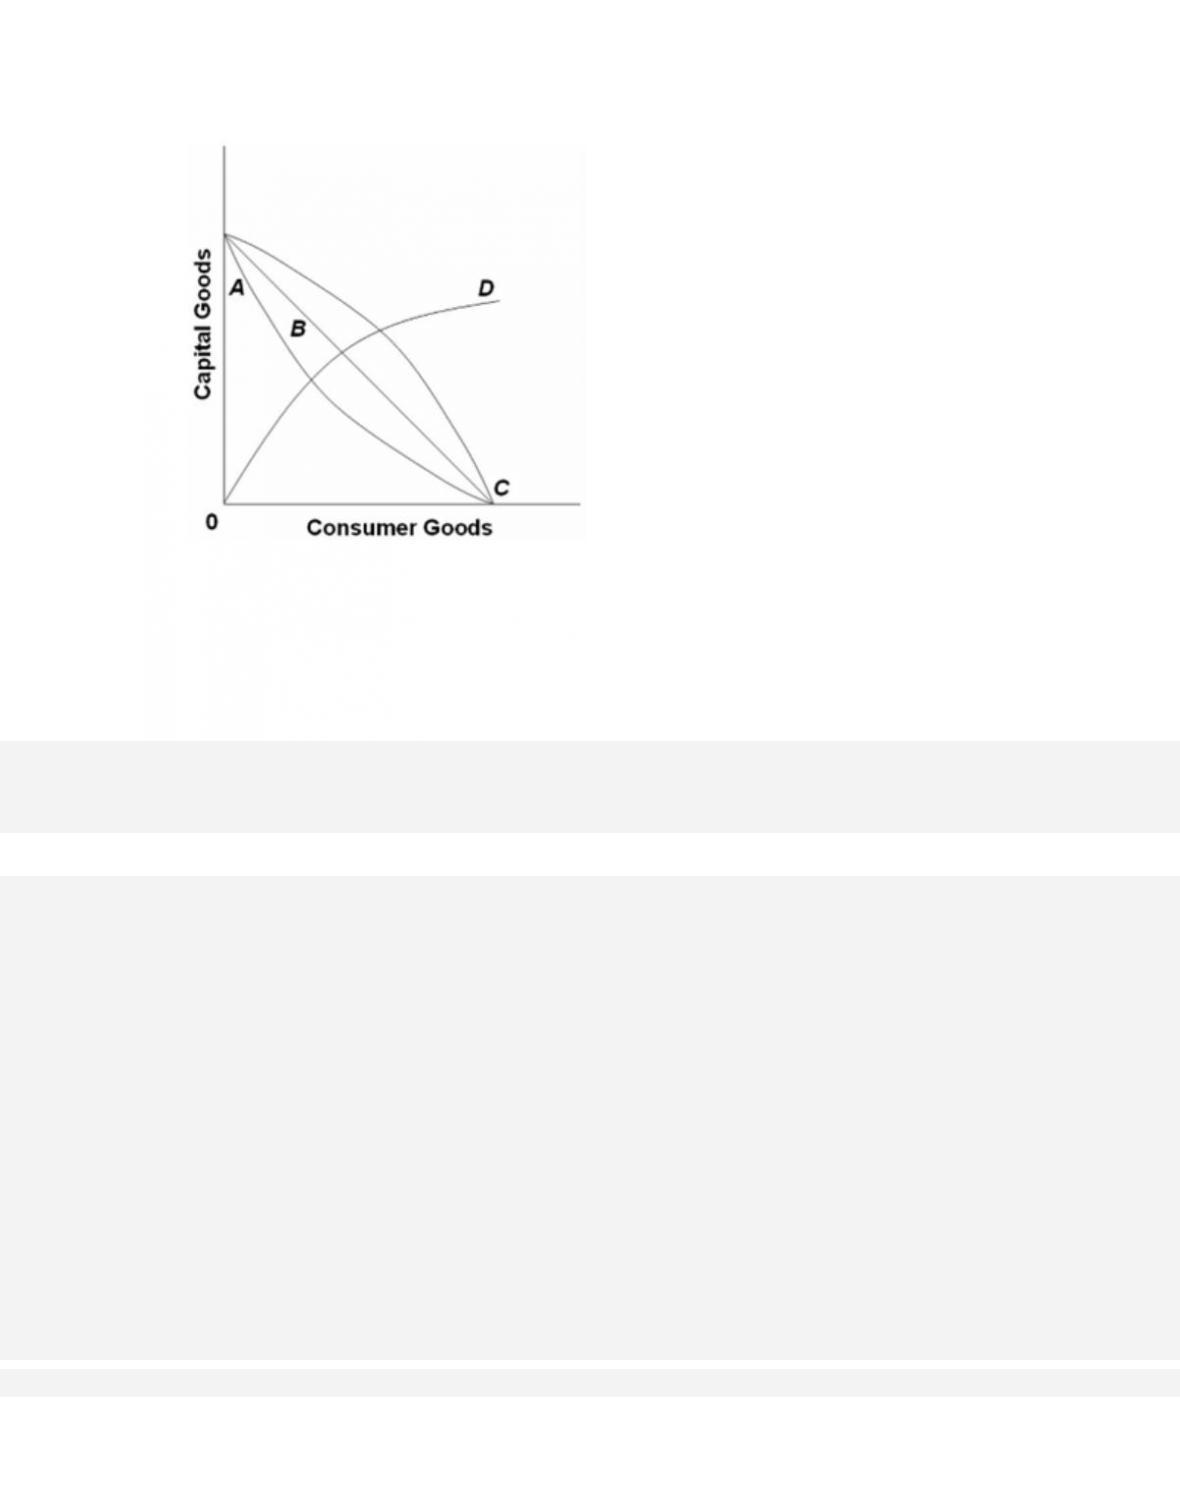
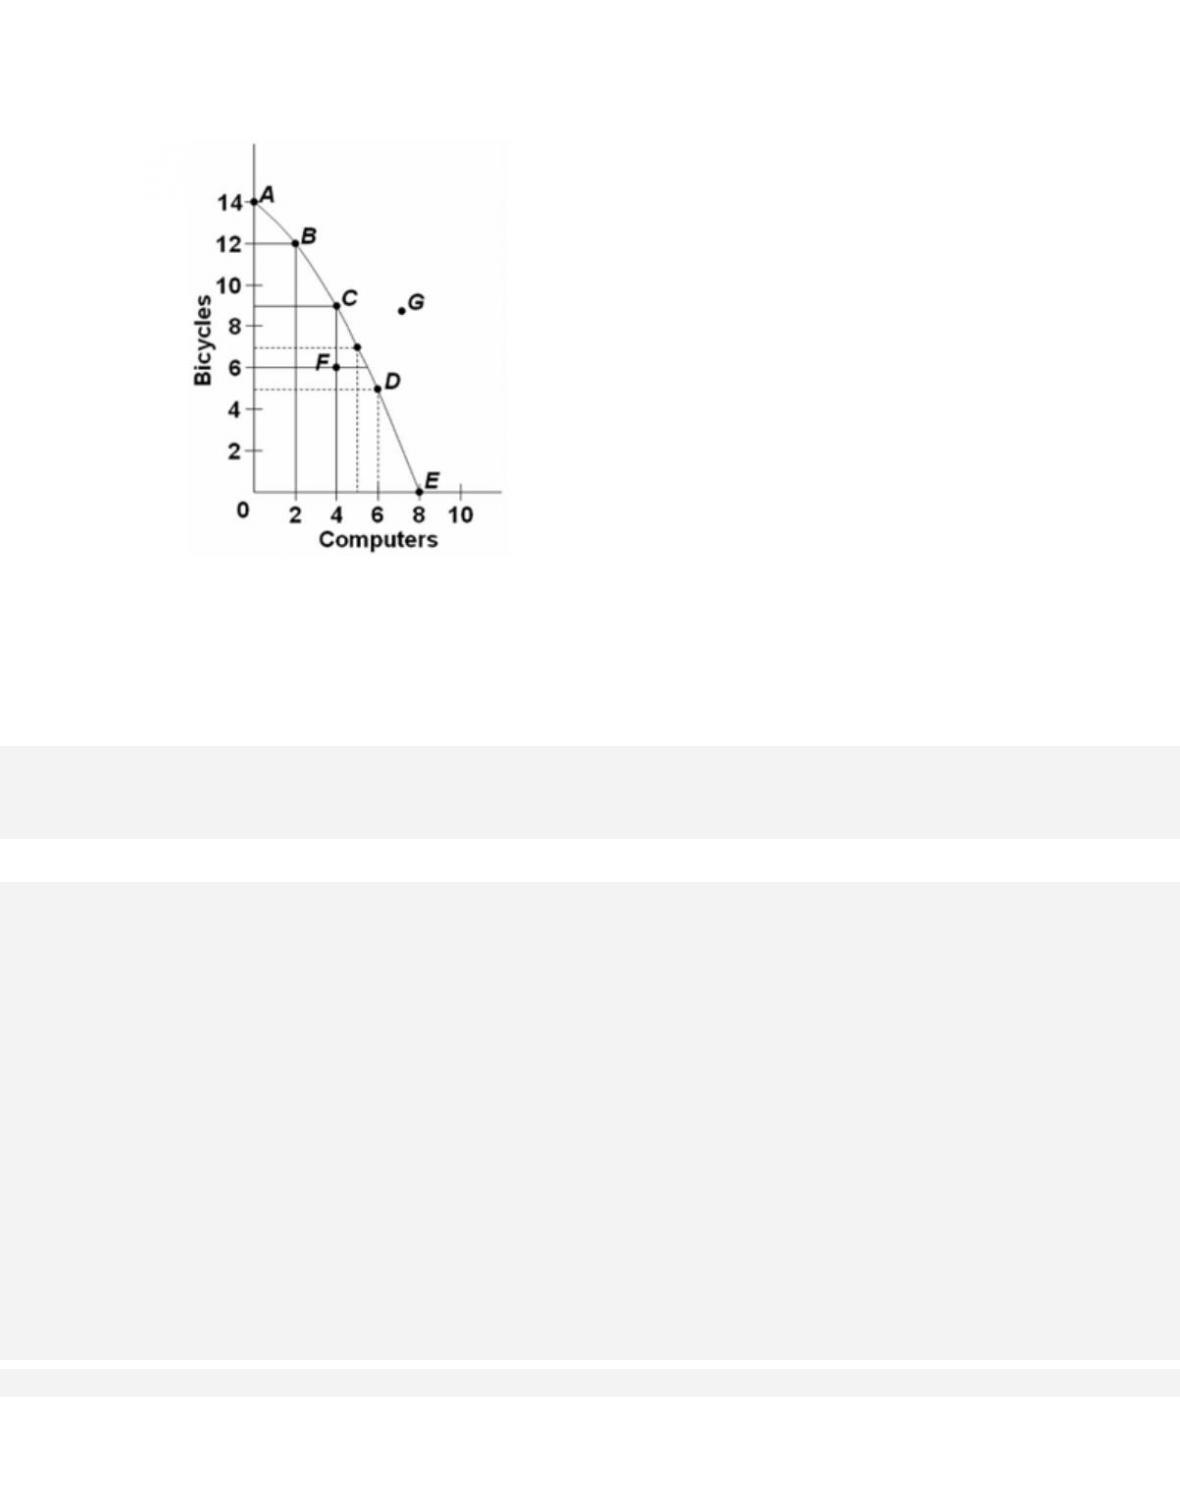
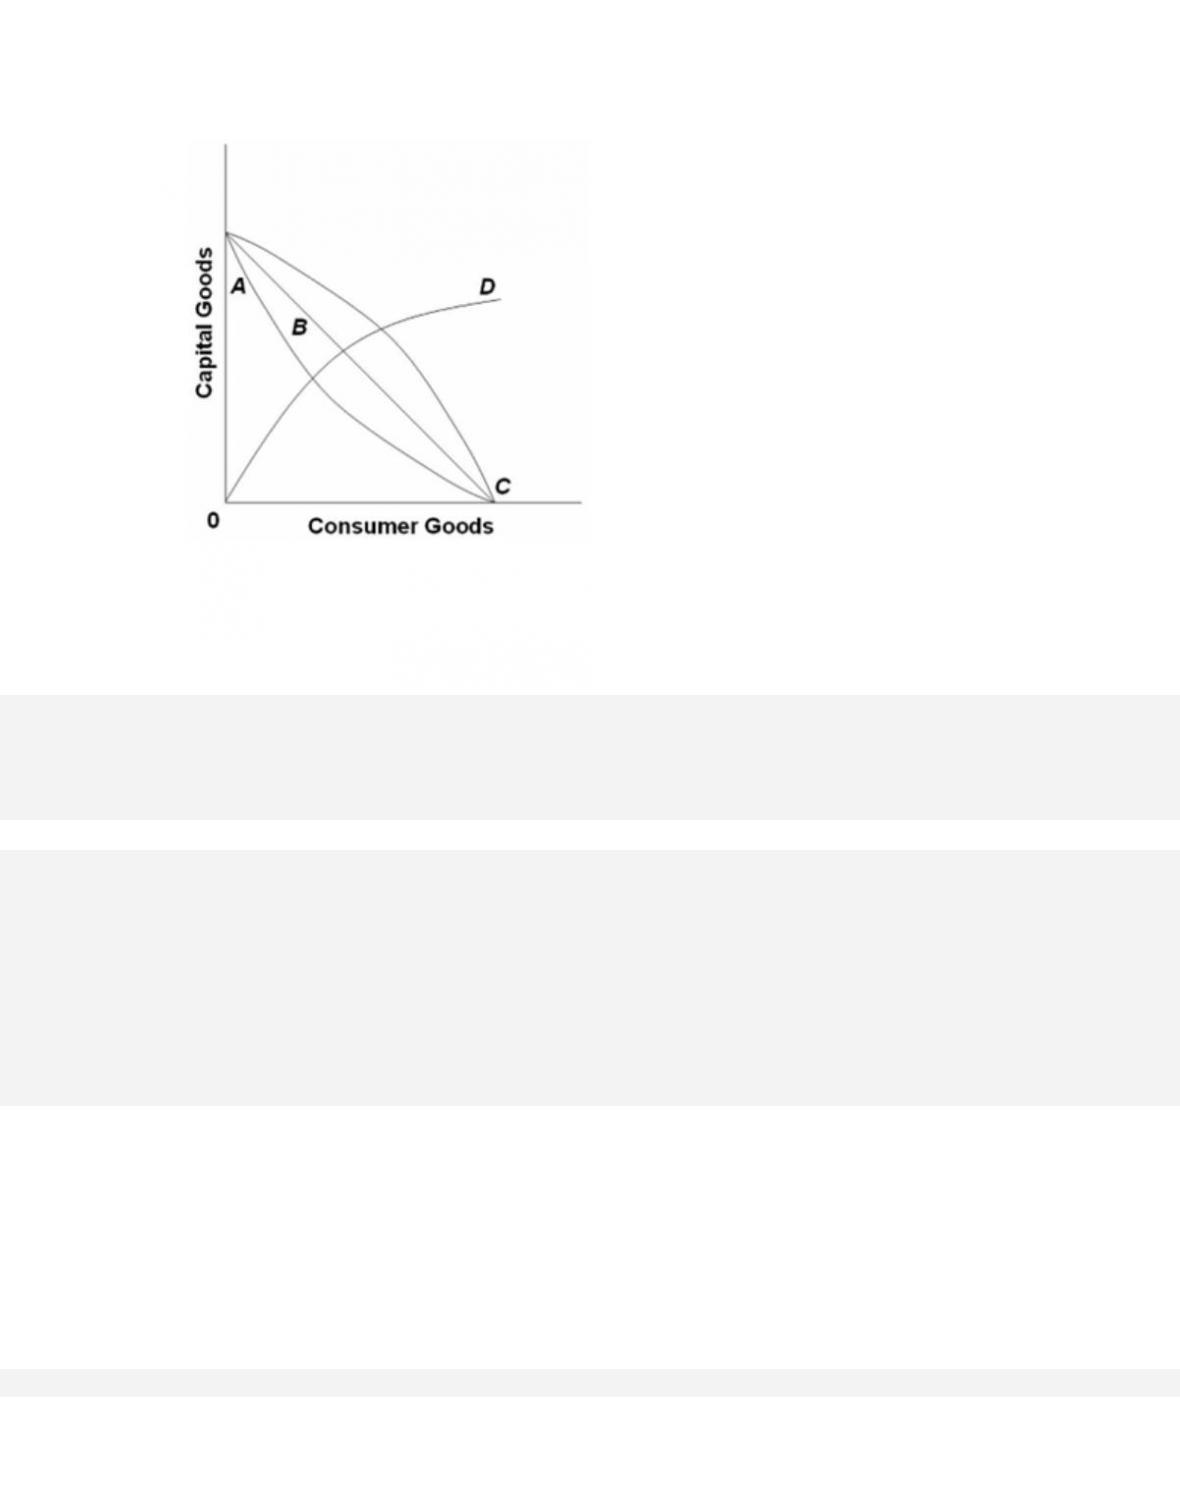
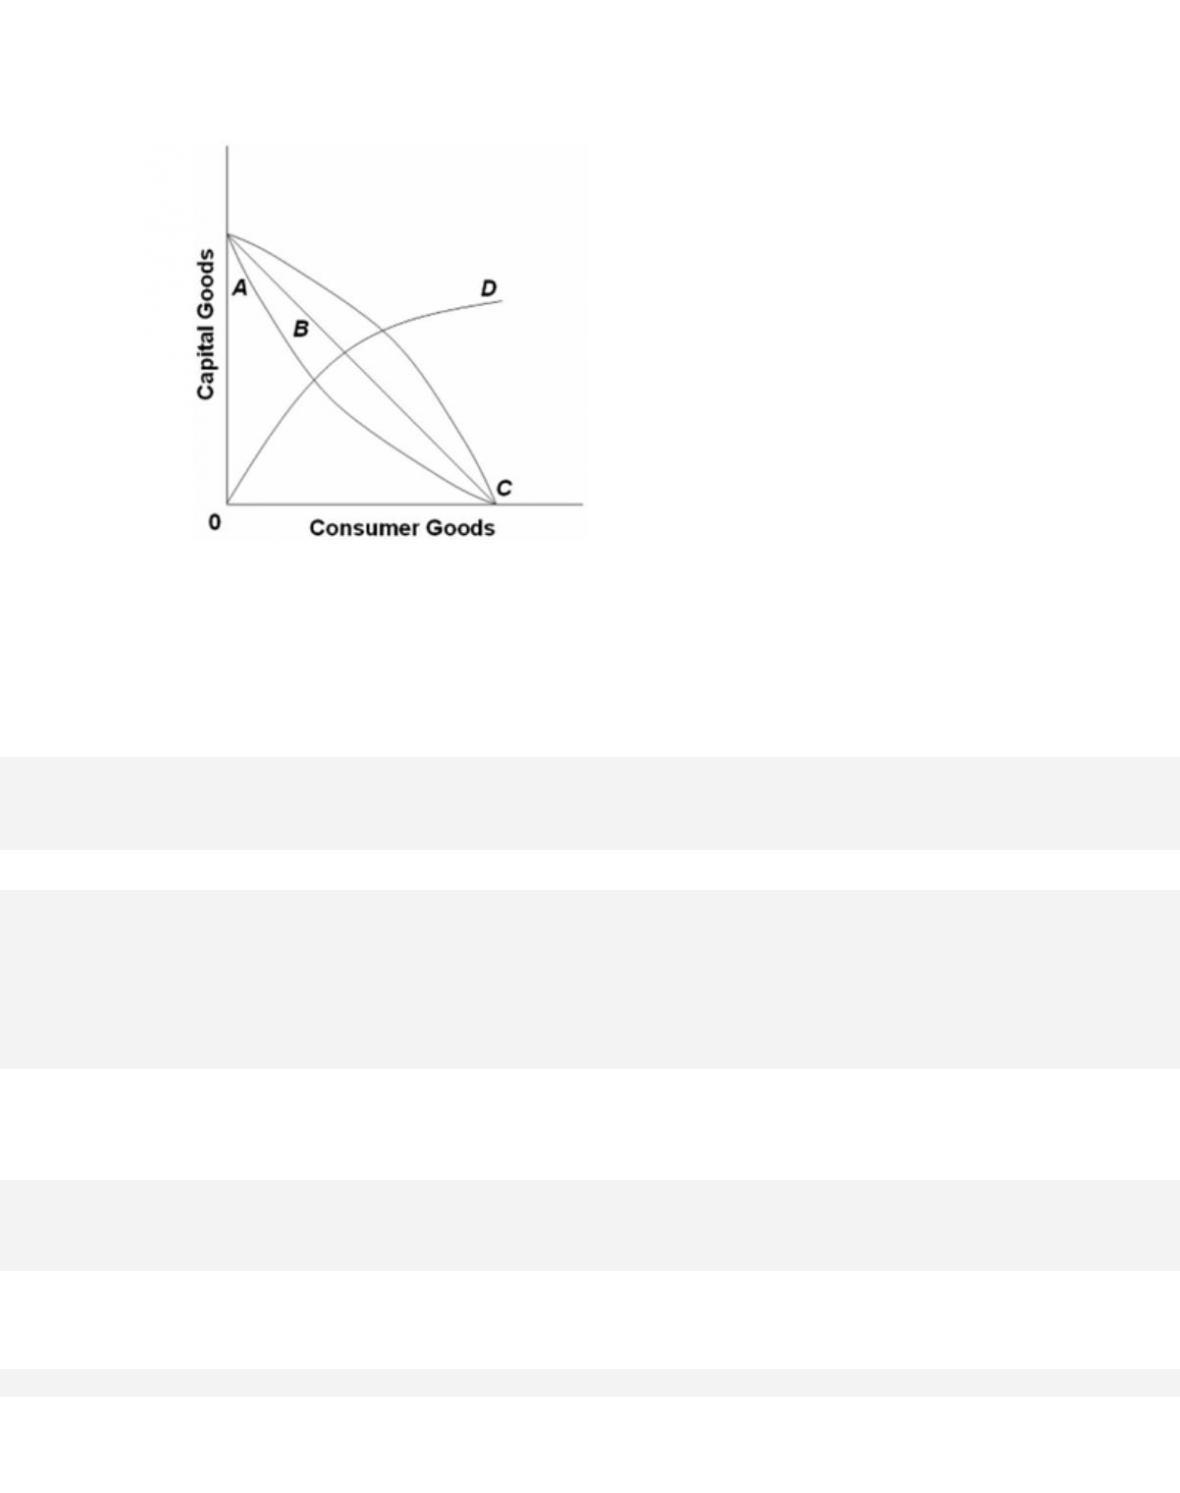
148.
Refer to the diagram. As it relates to production possibilities analysis, the law of increasing
opportunity cost is reflected in curve
A.
A.
1-78
149.
Refer to the diagram. Curve B is a
D.
technology frontier curve.
1-79
150.
Refer to the diagram. All other things equal, curve C
A.
reflects increasing opportunity costs because the slope of the curve becomes less steep as
one moves down along the curve.
151.
The fact that the slope of the production possibilities curve becomes steeper as we
move down along the curve indicates that
D.
resources are perfectly substitutable between alternative uses.

152.
The law of increasing opportunity costs states that
D.
if the prices of all the resources used to produce goods increase, the cost of producing
any particular good will increase at the same rate.
153.
The concept of opportunity cost
D.
suggests that insatiable wants can be fulfilled.