
that
A.
X is inversely related to Y.
472.
In a graph with “crop yield” on the vertical axis and “rainfall” on the horizontal axis,
the vertical intercept refers to the
A.
steepness or flatness of the graph.
473.
Which of the following
indicates an inverse relationship
between x and y?
A. y = -3 + 5x
474.
Which of the following suggests a direct relationship between x and y?
D.
a change in y = 6 coupled with a change in x =
475.
Variables X and Y in the above table are
D.
independently related.
X
Y
Z
60
120
15
50
100
15
40
80
15
1-242
476.
Variables X and Z in the provided table are
A.
positively related.
477.
X
Y
Z
60
120
15
50
100
15
40
80
15
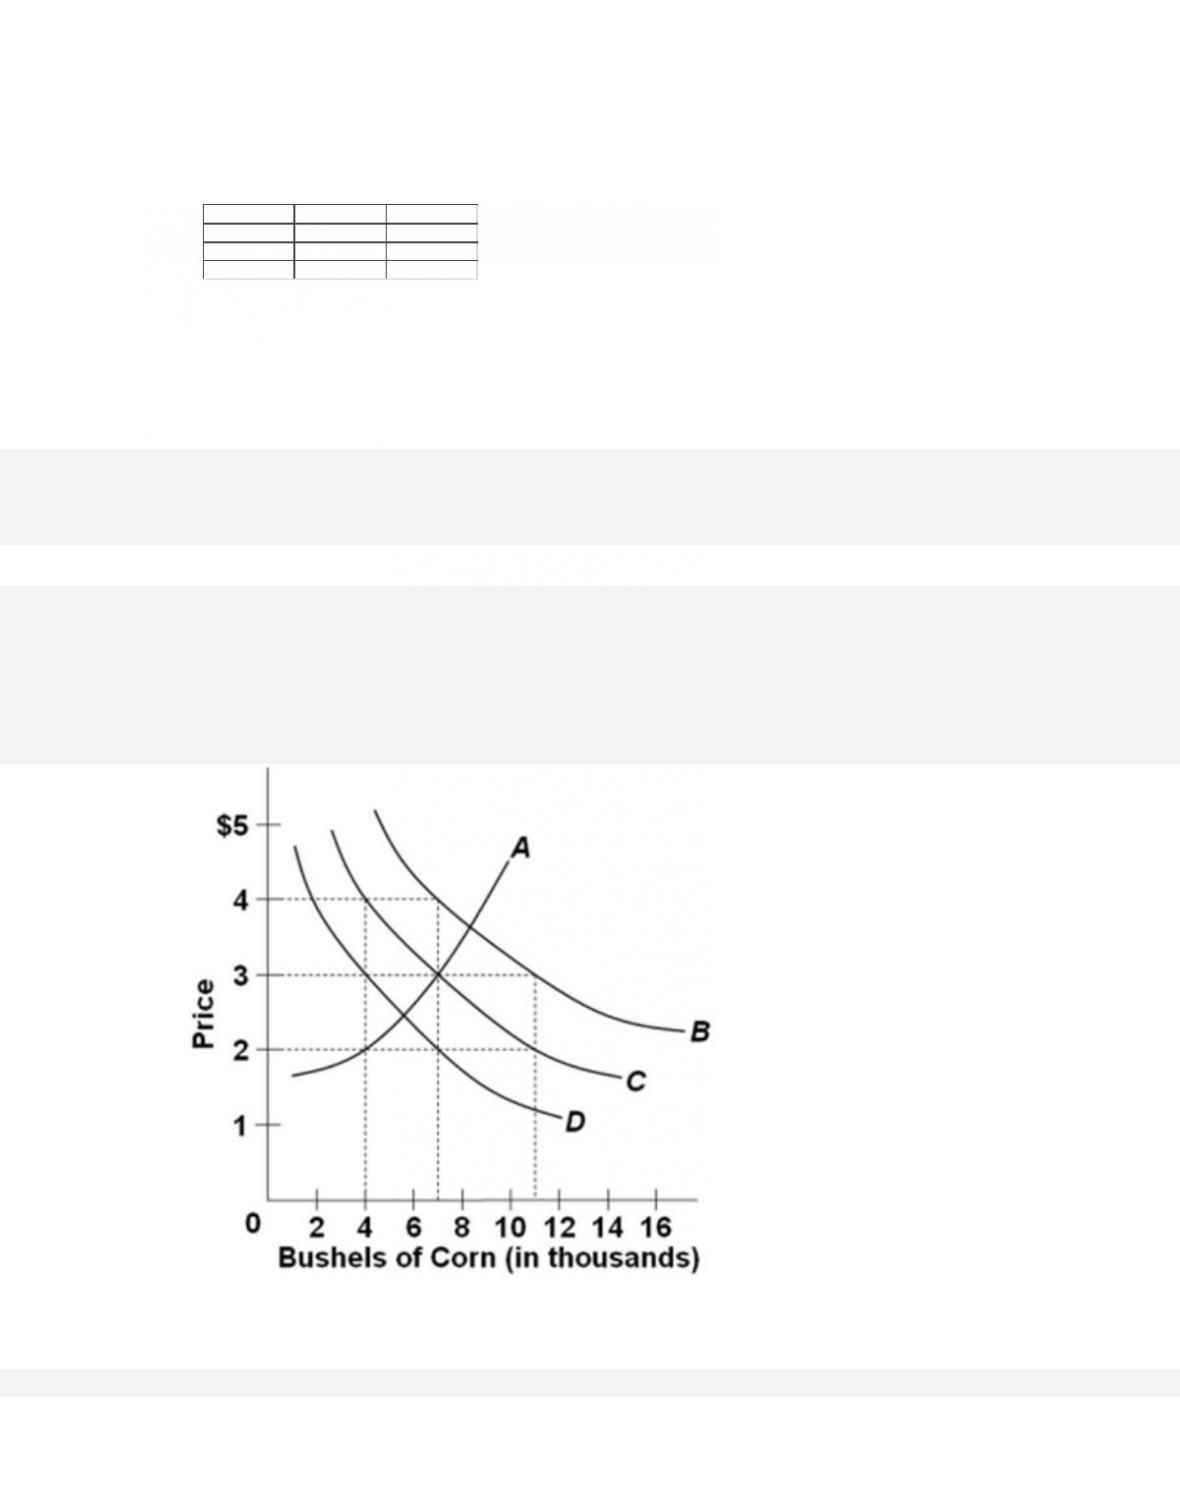
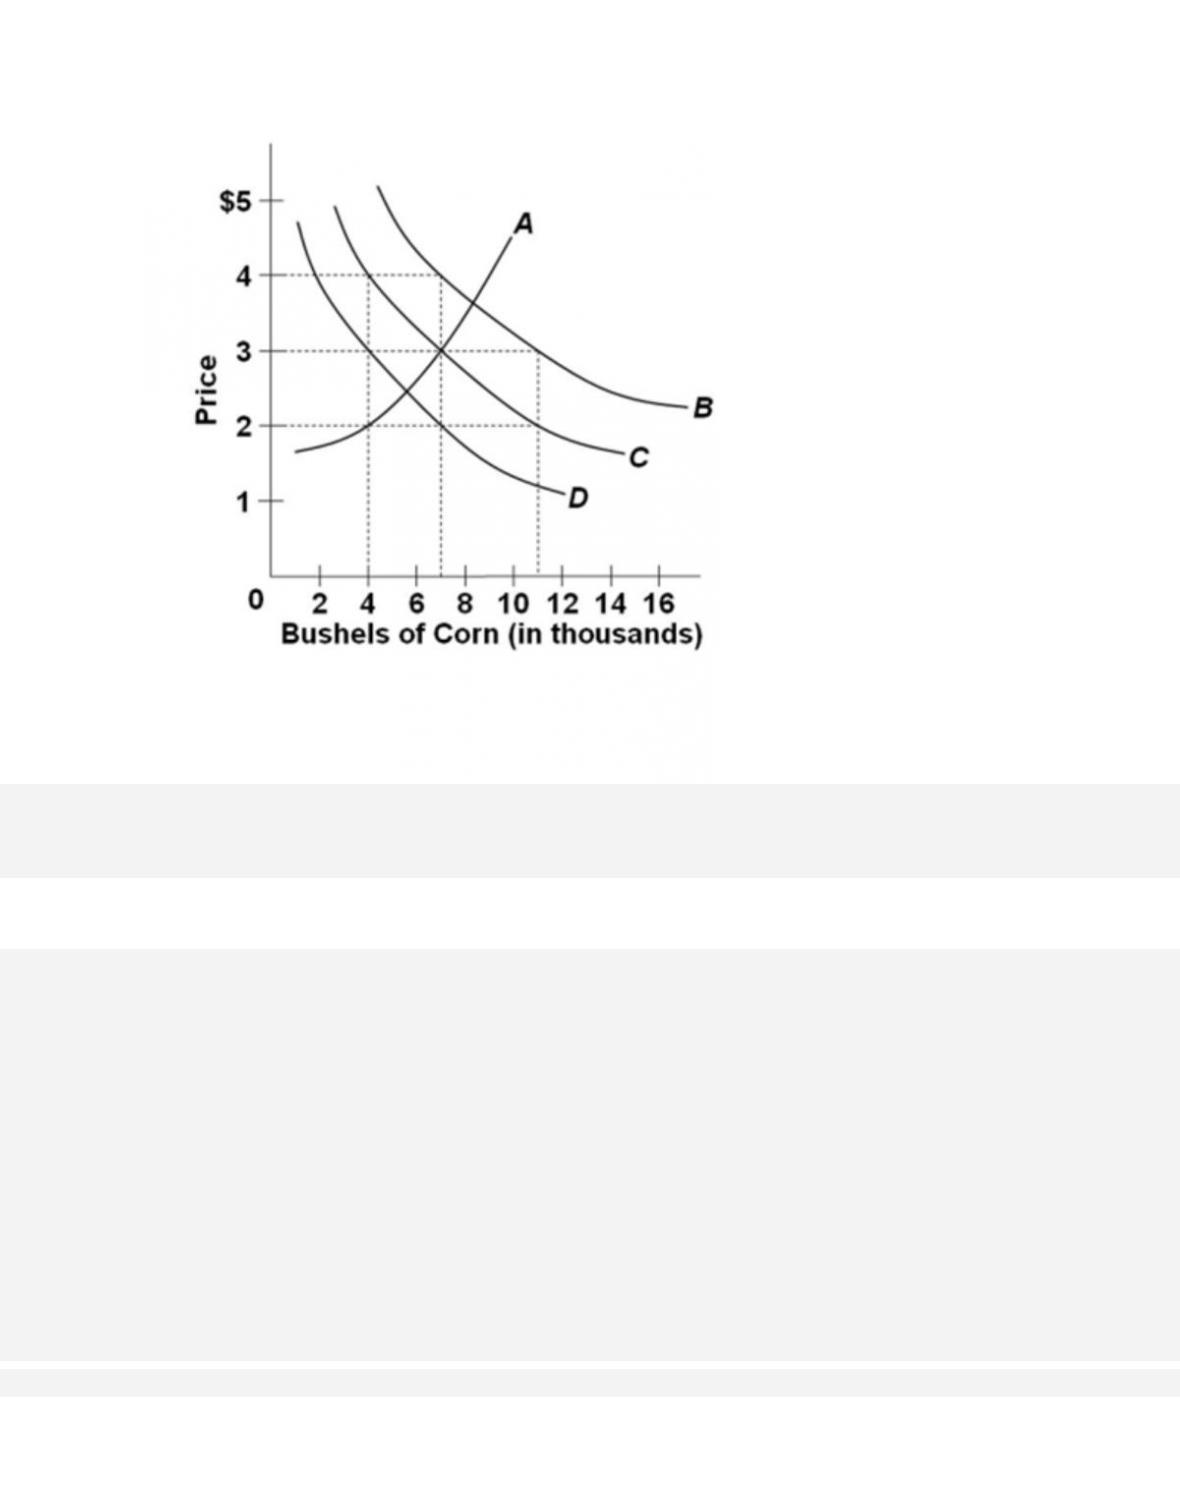
Refer to the following table, which shows the quantities of corn demanded at various levels
of corn price (hypothetical data).
Price Per
Bushel
Bushels
Demanded
Per Year
$5
2,000
4
4,000
3
7,000
2
11,000
1
16,000
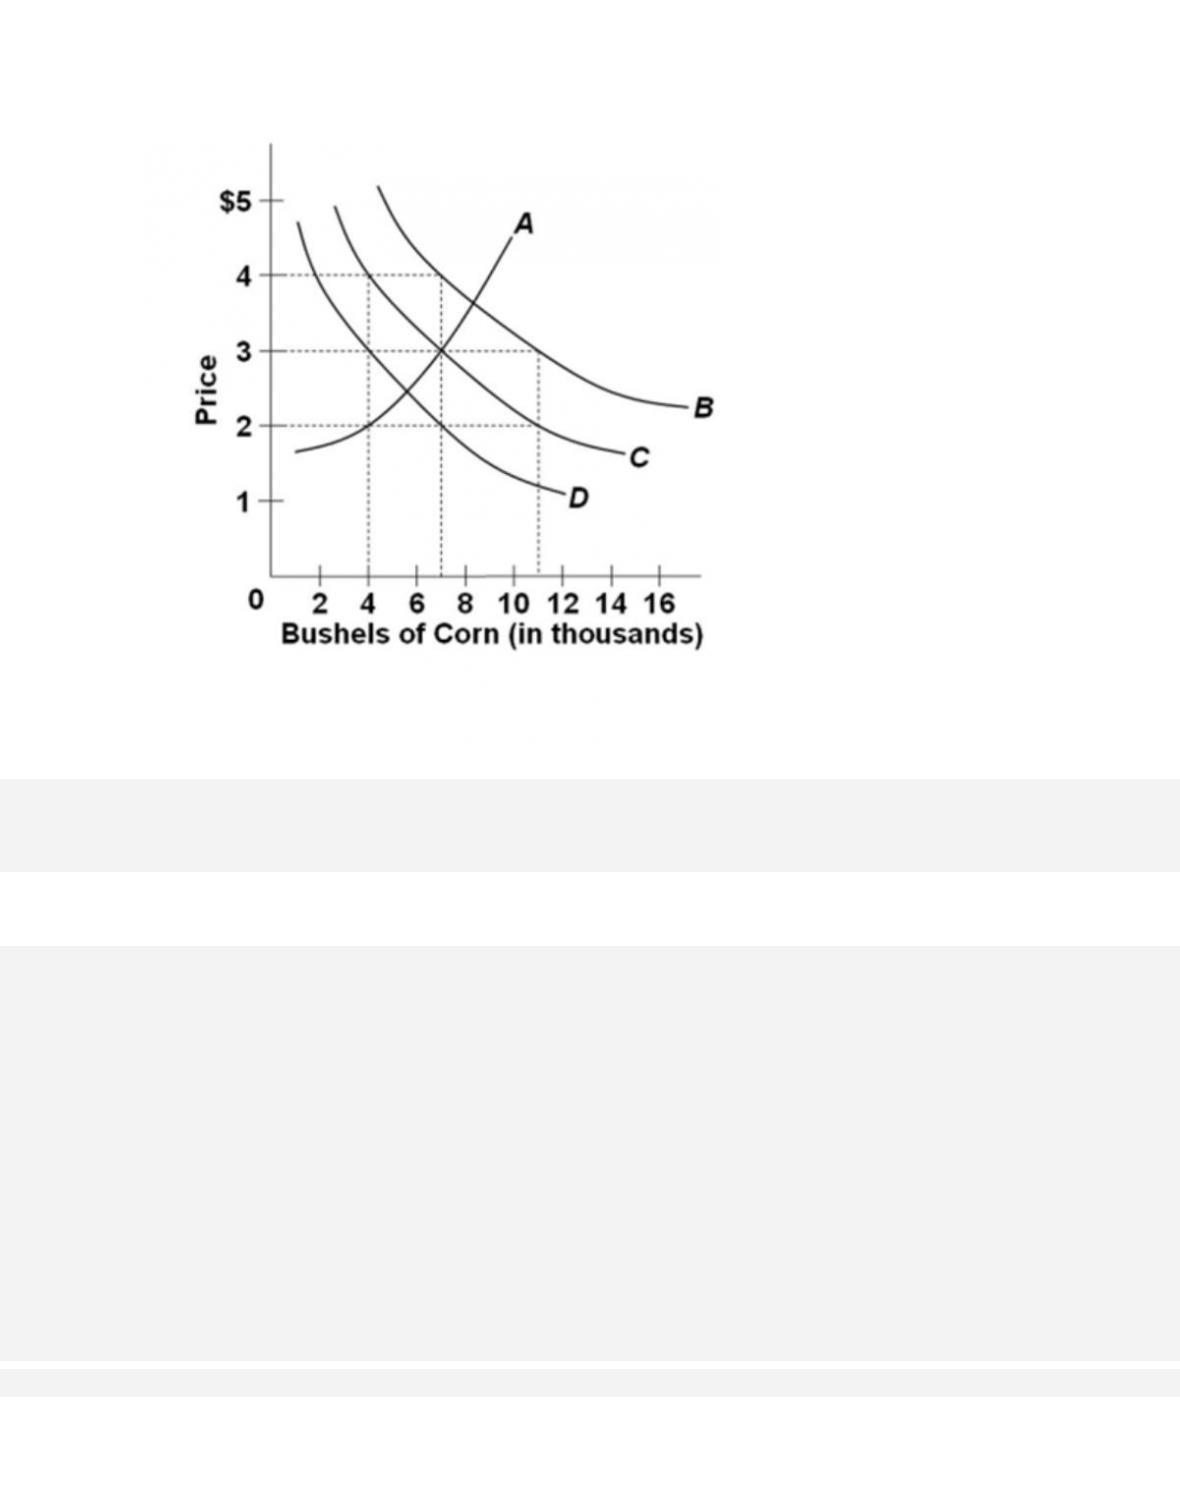
Which curve in the graph shown above best represents the data in the table?
A.
A
B.
B
478.
Refer to the provided graph. Which curve shows a direct relationship between price and
quantity?
D.
D
479.
Refer to the provided graph. From the economists’ perspective, which is the independent
variable and which is the dependent variable?
D.
Both price and quantity demanded are dependent variables.

1-246
480.
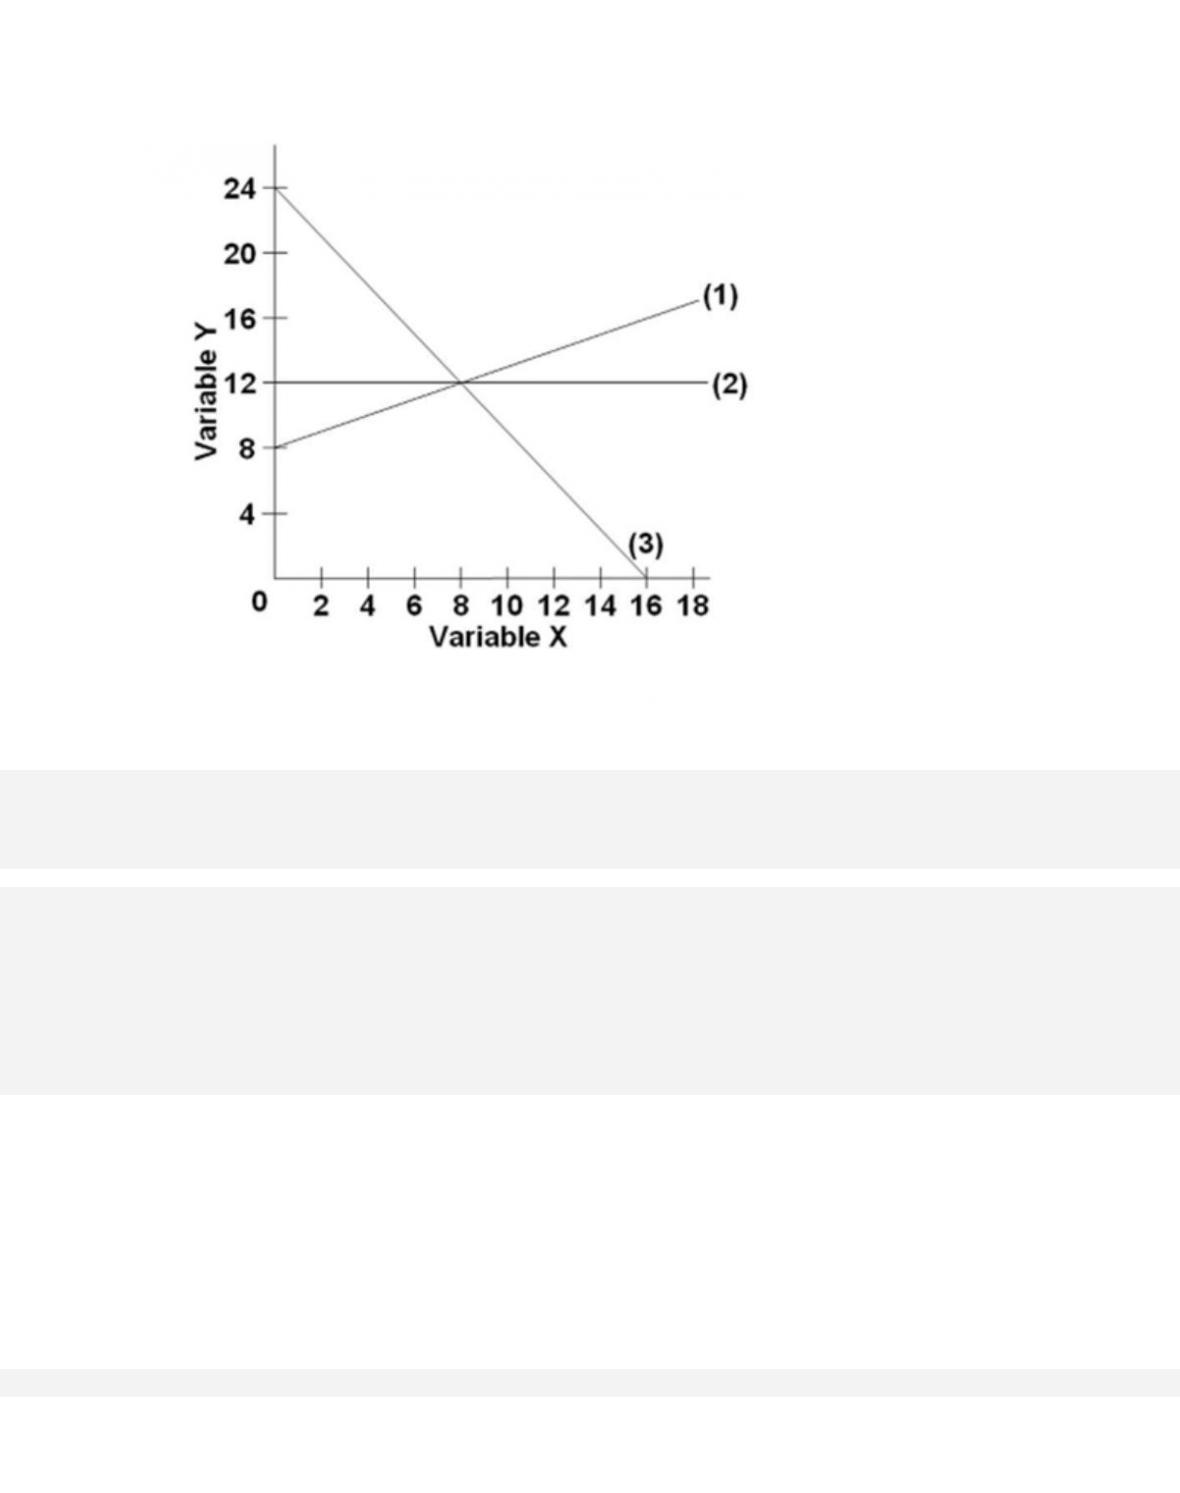
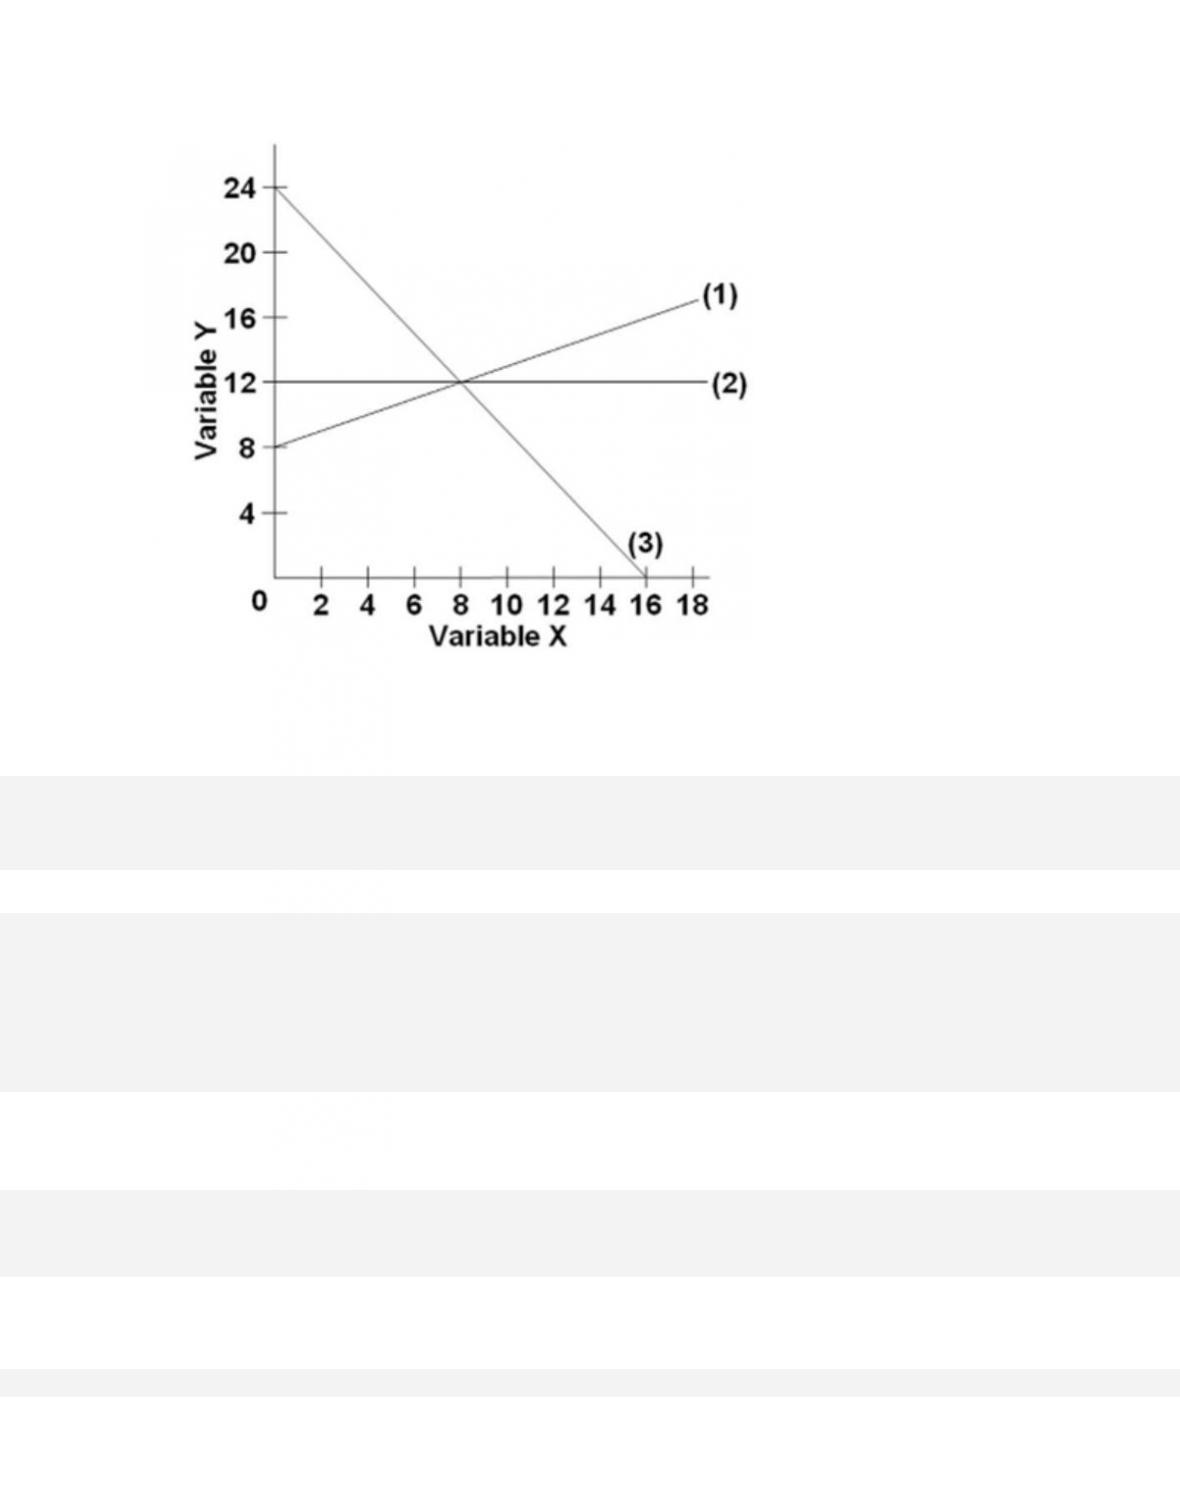
In line (2) on the provided graph, the variables x and y are
A.
nonlinearly related.

1-247
481.
The slope of line (2) on the provided graph is
D. infinite.
1-248
482.
The linear equation for line (1) on the provided graph is
A. y = 8 + 2x.
1-249
483.
The vertical intercept of line (3) on the provided graph is
A. 16.
484. If a linear relation is described by the equation C = 35 – 5D, then the vertical intercept
of the graph (where C is on the vertical axis) is
D. not known.

485. If you knew that the vertical intercept for a straight line was 15, that the slope was –
.5, and that the independent variable had a value of 8, the value of the dependent
variable
would be
A.
8.
486. If you knew that the vertical intercept for a straight line was 150 and that the slope
of the line was 4, then the dependent variable would be 250 when the value of the
independent variable is
A. 15.
1-251
Topic:
Appendix: Graphs and Their Meaning
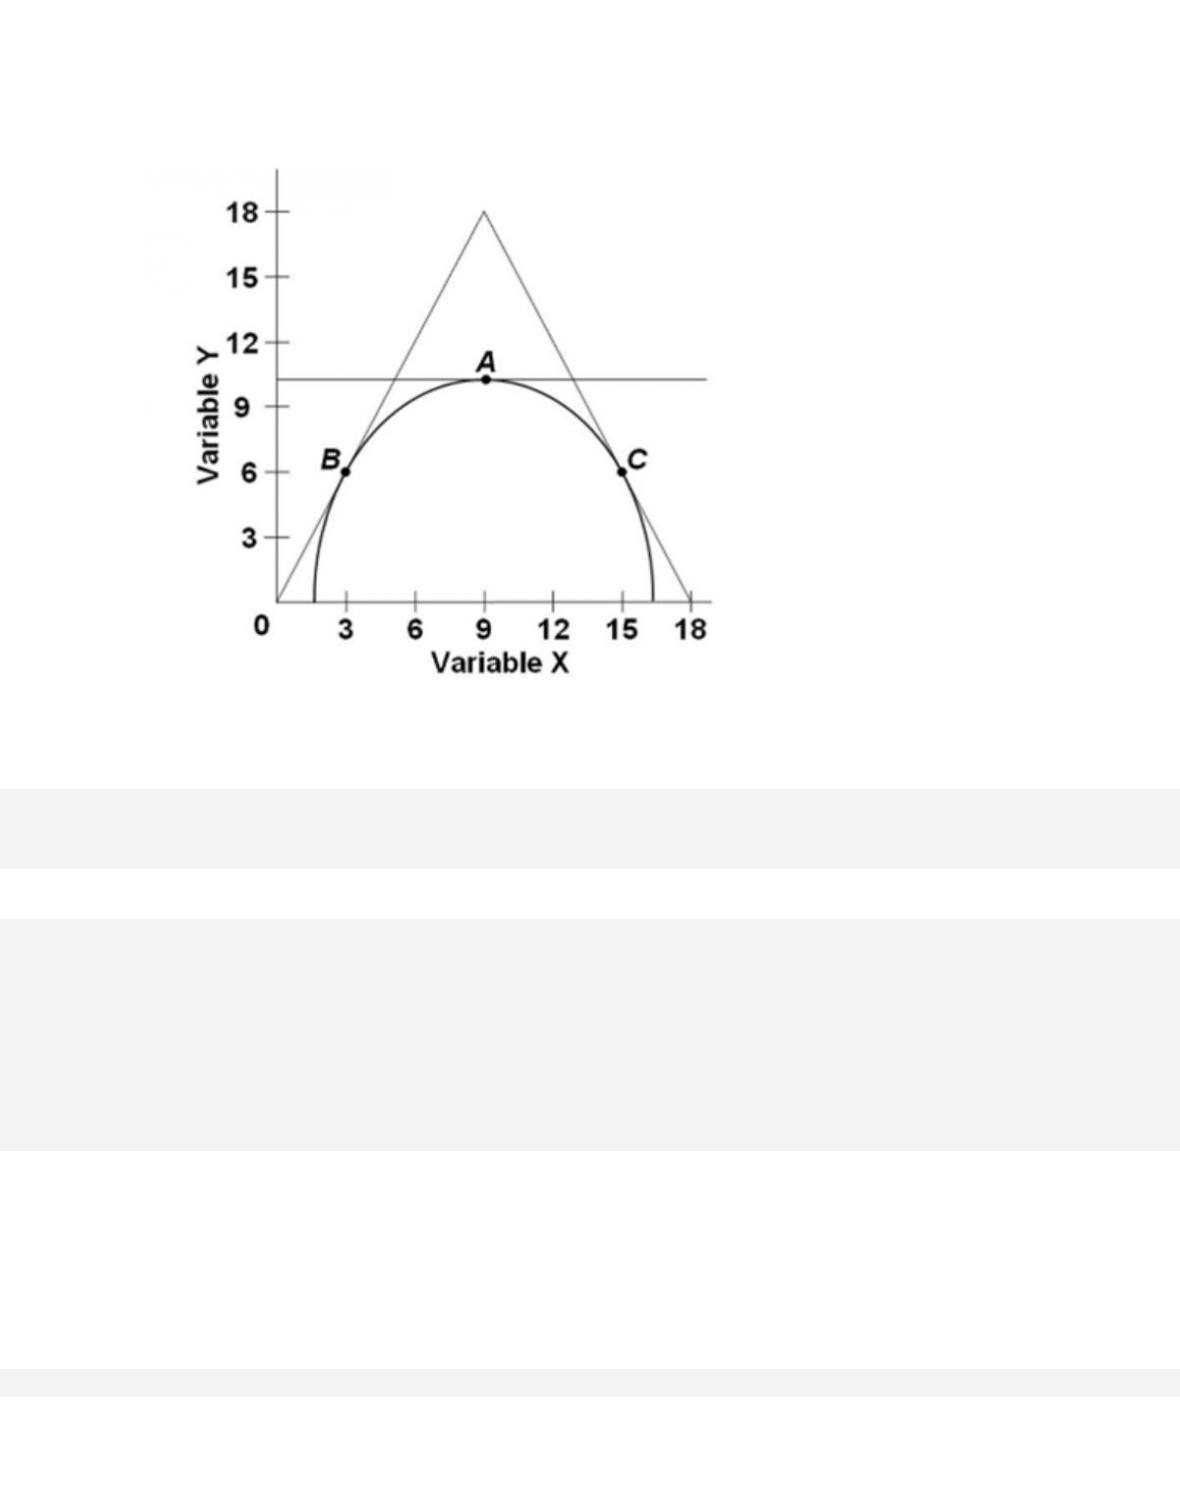
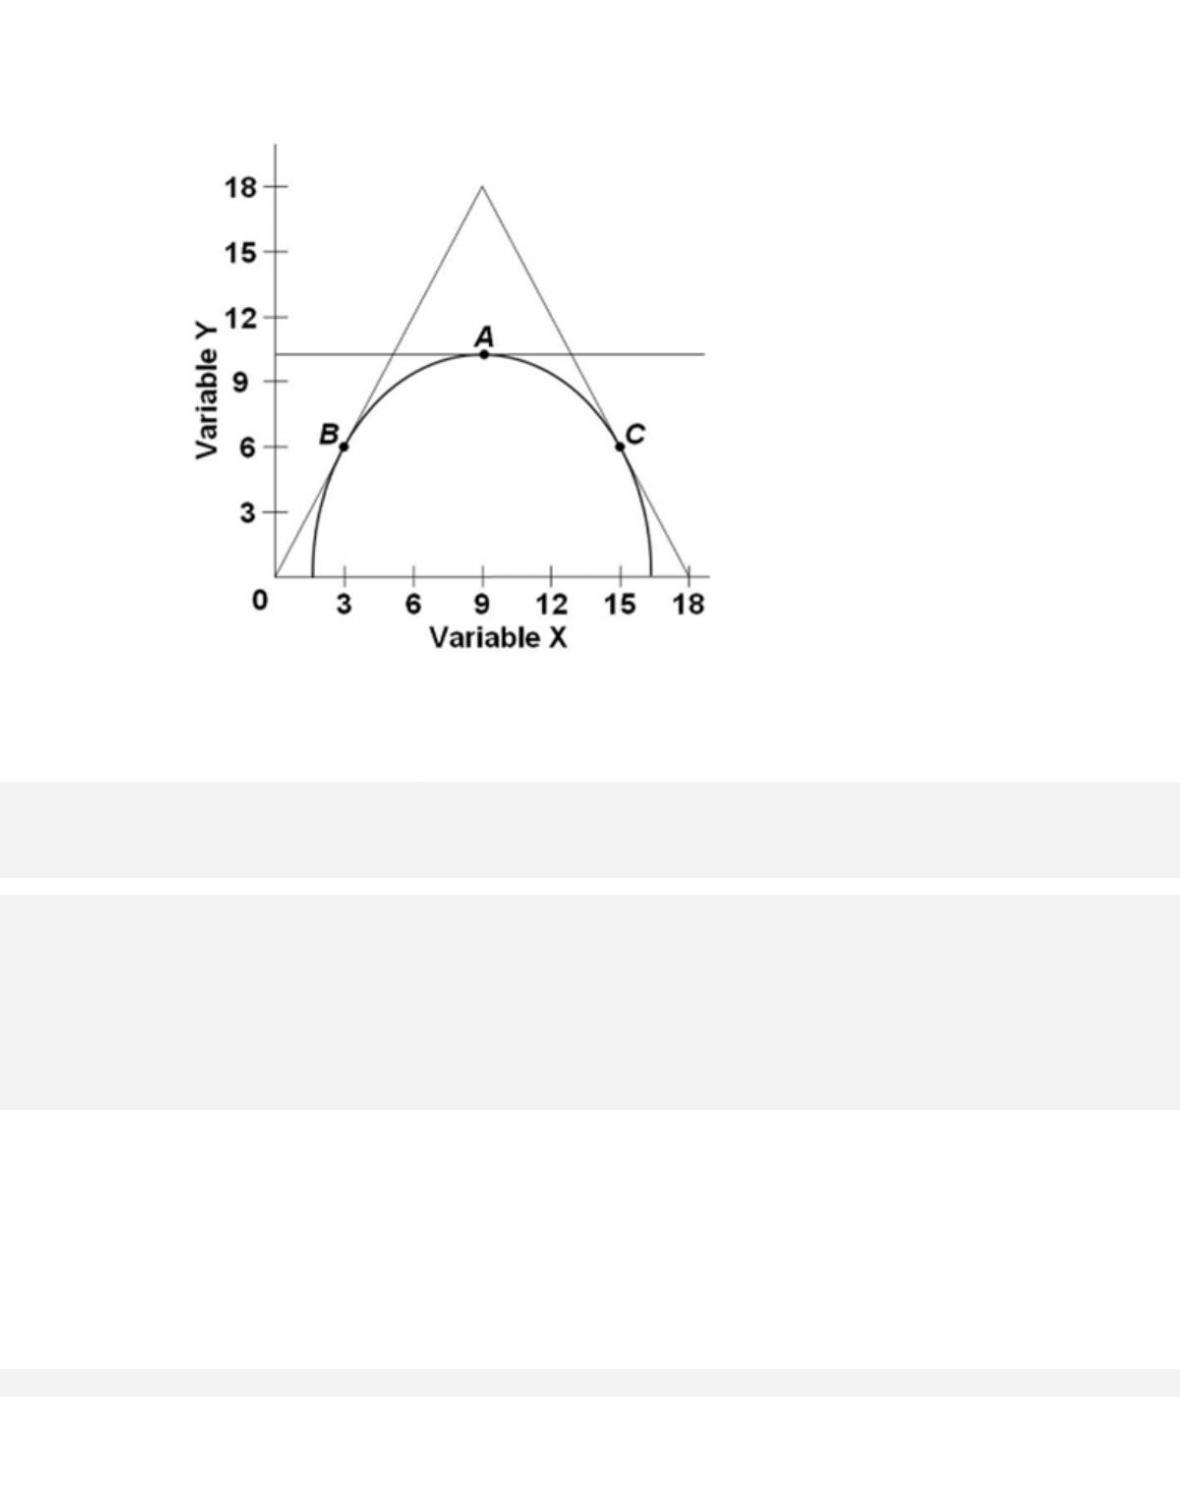
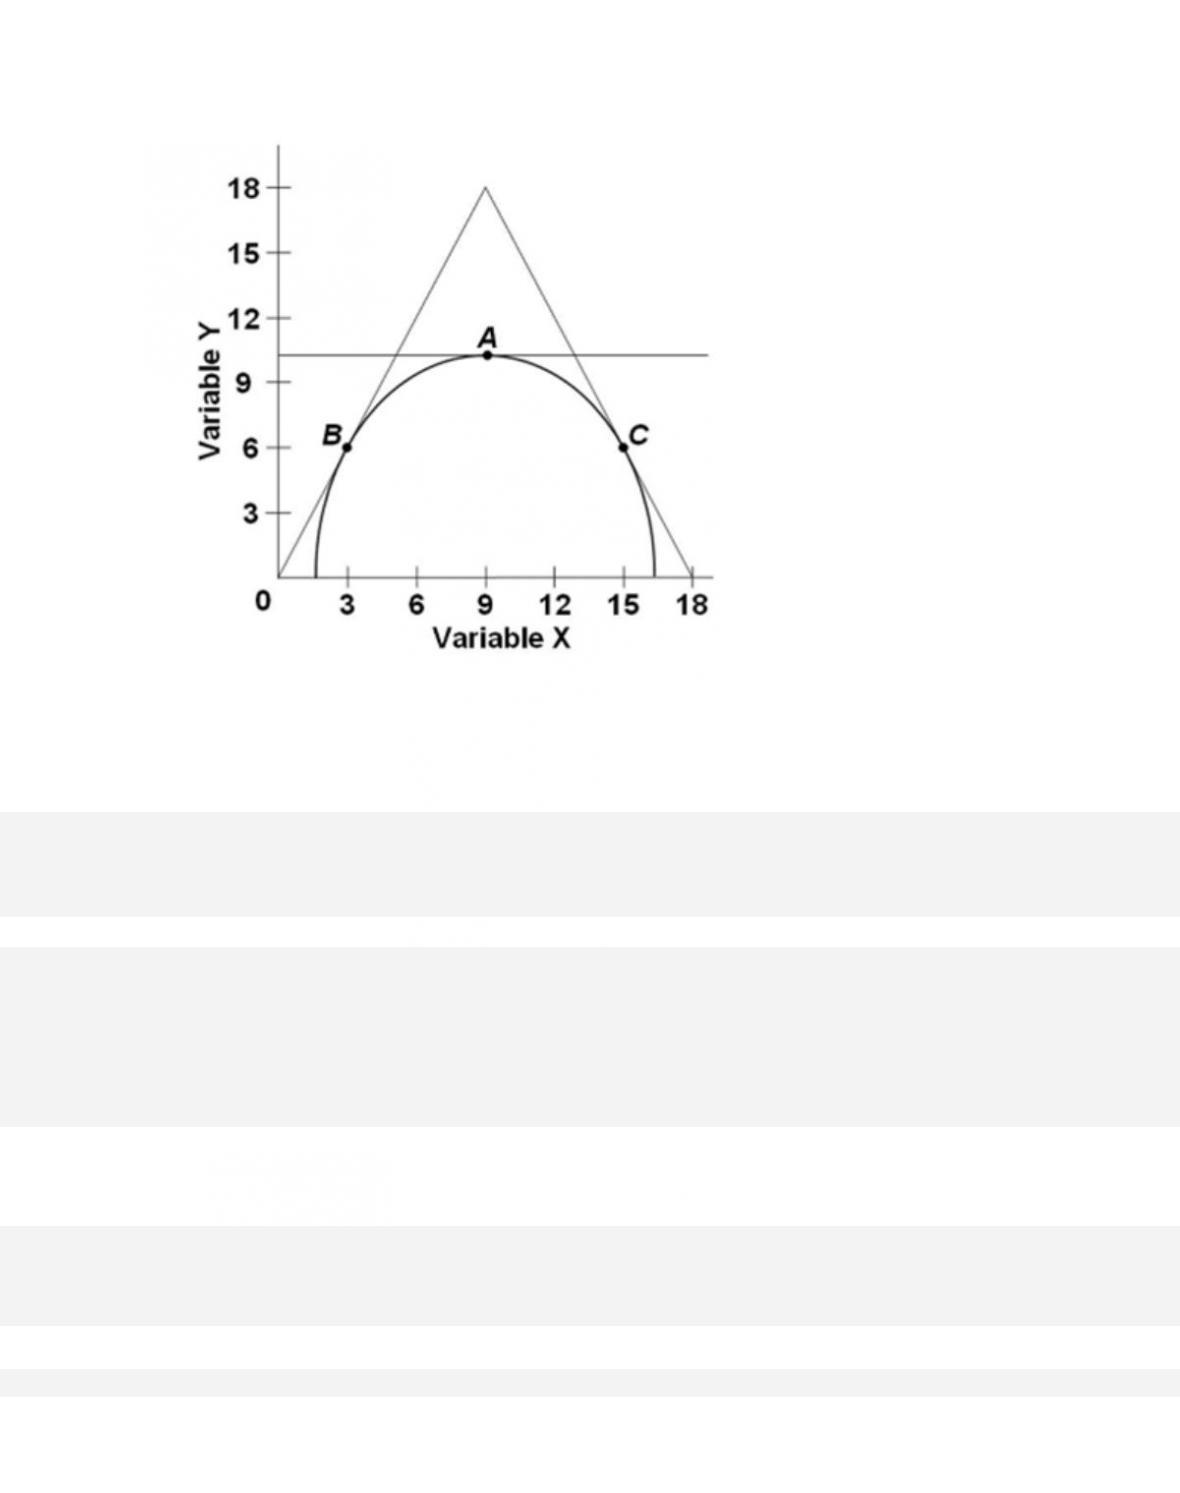
487.
Refer to the provided graph. The slope of the line tangent to the curve at point A is
D.
4.
1-252
488.
Refer to the provided graph. The slope of the line tangent to the curve at point B is
A. 0.5.
1-253
489.
Refer to the provided graph. As we move along the curve from point B to A to C, the slope
of the tangent line is
A. increasing in algebraic value.
490.
Given: the intercept for a straight line is 12. If the value of the independent variable is
3, then the value of the dependent variable would be 18. The slope of this line is
D.
4.
491.
In a linear equation relating income and consumption, you know that the intercept
is $1,000 and the slope of the line is 4. If income is $20,000, then consumption is
A. $8,000.
True / False Questions
492.
If two sets of data are inversely related, they will appear on a graph as an upward-
sloping line.
493.
If A is the dependent variable and B is the independent variable, then a change in A
results in a change in B.
494.
A linear relationship only refers to one whose graph is either vertical or horizontal.
495.
In graphing a relationship between two variables, economists always follow the
mathematical convention. Thus, if price is the independent variable then it is measured
on
the horizontal axis.
496.
An assumption is usually made in a two-axes (or two-dimensional) graph that, aside
from the two variables under study, the influence of all other variables or factors is
assumed to be constant.
497.
The slope of a graph measures the rate of change in one variable as the other variable
changes.
498.
The slope of a graph relating two variables is -5. This indicates that as one variable
decreases, the other variable also decreases.
1-257
499.
In the graph for the linear equation S = 15 – 5T, with T on the horizontal axis, the
vertical intercept of the graph is –5.
500.
In a curved graph that is dome-shaped, the tangent line at its maximum, or highest point,
has an infinite slope.