Unlock document.
This document is partially blurred.
Unlock all pages and 1 million more documents.
Get Access

1-201
387.
The law of increasing opportunity costs states that
A.
costs of production increase for one good, but costs decrease for the other good.
388.
If the opportunity cost of producing extra units of one good (expressed in terms
of the amount of another good given up) remains constant, then the shape of the
production possibilities curve is
A. a straight horizontal line.
389.
Which of the following statements is an explanation for the law of increasing
opportunity costs?
D.
The economy is achieving productive efficiency by producing goods at the least cost.

390.
If the production possibilities curve is a straight line, then
A. the opportunity cost of producing one good is zero.
391.
If economic resources are perfectly interchangeable between the two products shown
on a production possibilities graph,
A.
the economy will always be at full employment.

392.
The best output or the optimal production of the nation is
A.
a combination of products at the midpoint of the production possibilities curve.
393.
When a nation is under-allocating resources to the production of a good, then the
D.
marginal benefit of producing the good is increasing.
394.
If the marginal benefit of a good is less than its marginal cost, then the nation should
A.
produce more of that good.

395.
Suppose that a nation can only make two products: defense goods and civilian goods.
In a graph of the marginal benefit (MB) and marginal cost (MC) of defense goods,
a
leftward shift of the MB curve will cause the optimal quantity of
A.
civilian goods to decrease.
396.
Imagine an ideal scenario where world peace prevails and all nations are led by peace-
minded leaders. In such a world, the
D.
MC for defense goods would shift right.
397.
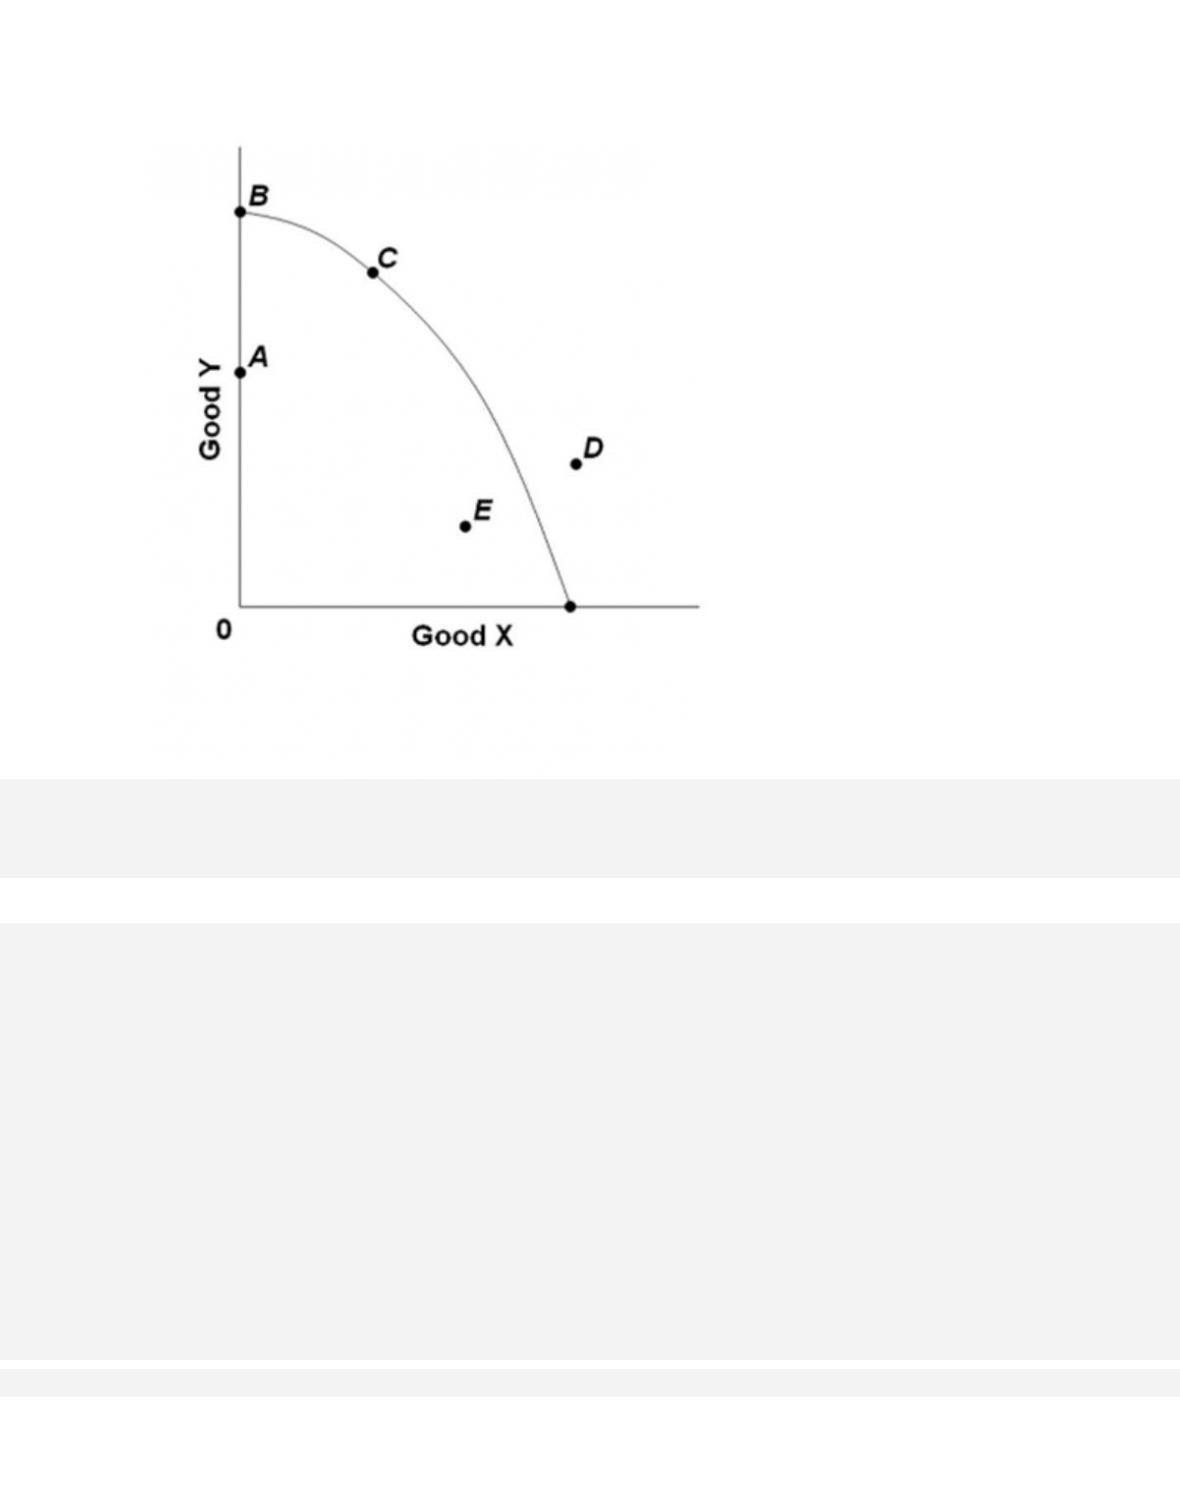
The graph provided shows the production possibilities curve for an economy producing
two goods, X and Y. Which of the points on the graph indicate(s) unemployed
resources?

398.
The graph provided shows the production possibilities curve for an economy producing
two goods, X and Y. All of the following may allow the economy to produce
combination
D in the future, except
D.
technological advances.
1-207
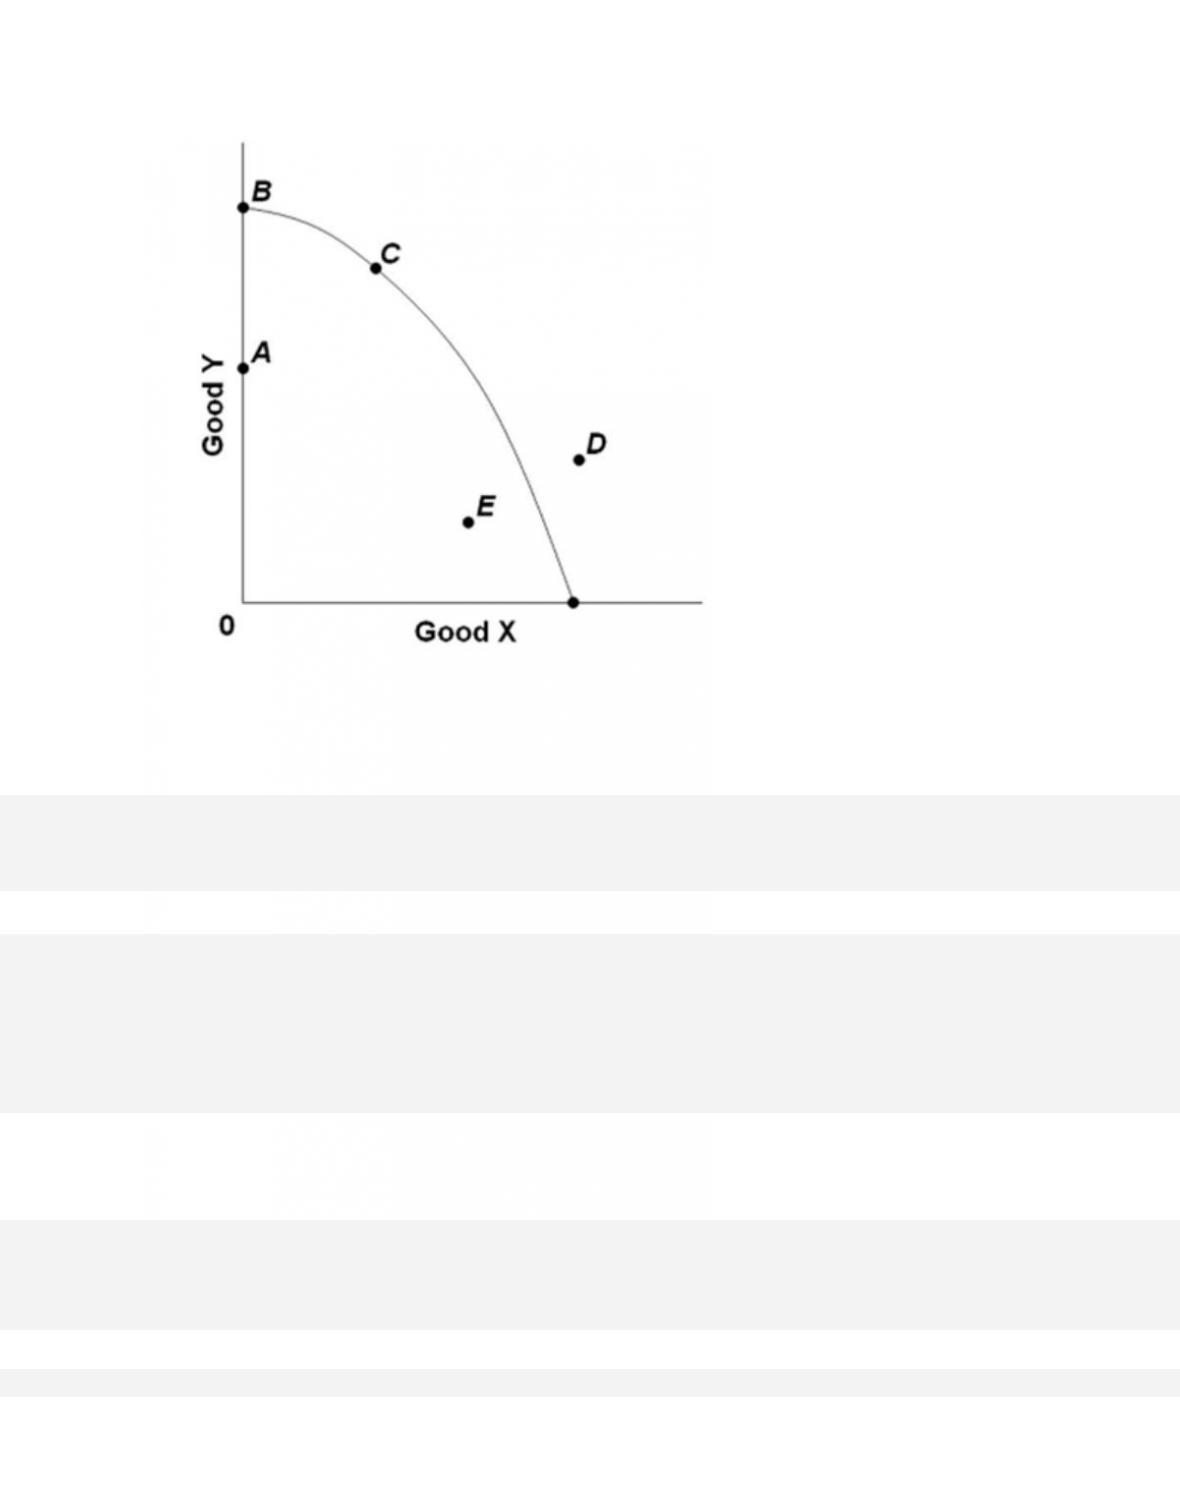
399.
Refer to the provided graph. Which of the following movements would indicate economic
growth?
A.
from point A to point C
400.
If a nation is operating at a point inside the production possibilities curve, it indicates
that the nation could

D.
not employ any more resources, because all resources are now employed.
401.
Consider an economy that is producing inside its production possibilities curve. This
economy could move closer toward its production possibilities curve by
A. distributing incomes more equally.
402.
A reduction in the level of unemployment would have which effect with respect to the
nation's production possibilities curve?
A.
It would shift the curve to the right.
1-209
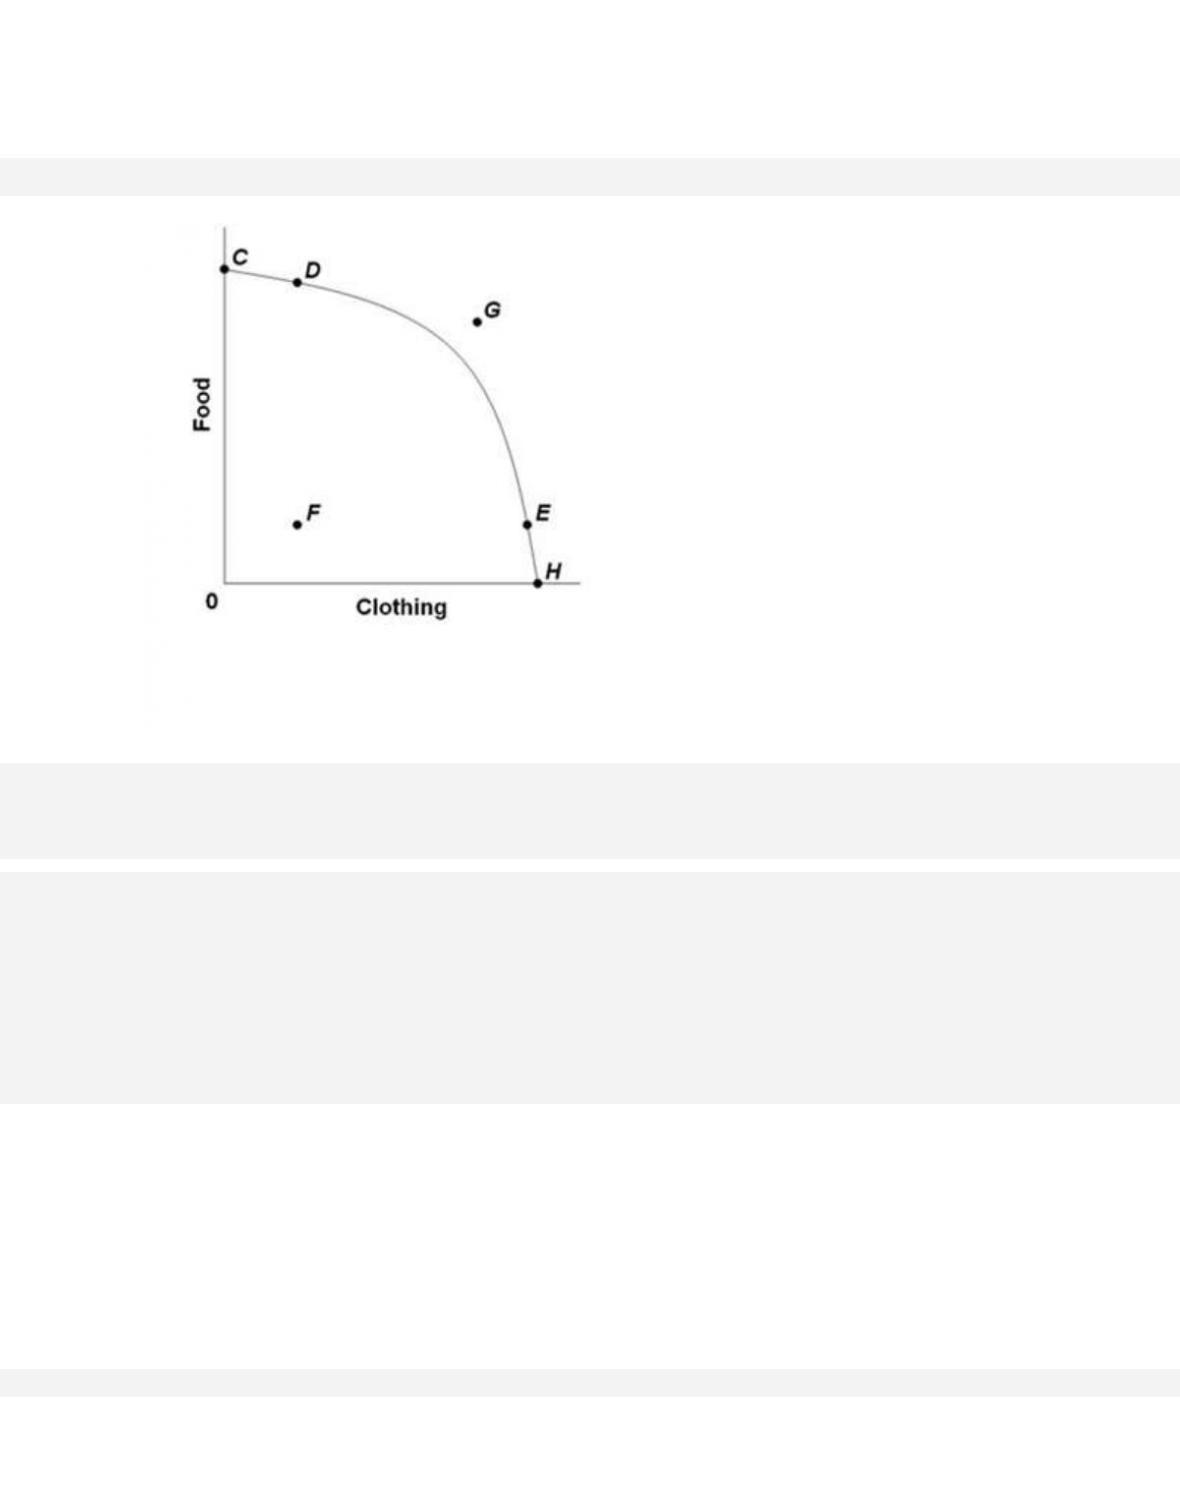
403.
Refer to the provided graph. Which of the following movements would indicate a reduction
in unemployment and an increase in capacity utilization?
A. from point C to point D
1-210
404.
Refer to the provided graph. Which of the following statements about combination G is true?
A.
The nation cannot produce combination G even if the nation gets additional resources.
B.
The nation can currently produce combination G, but not if the nation specializes and
trades with another nation.
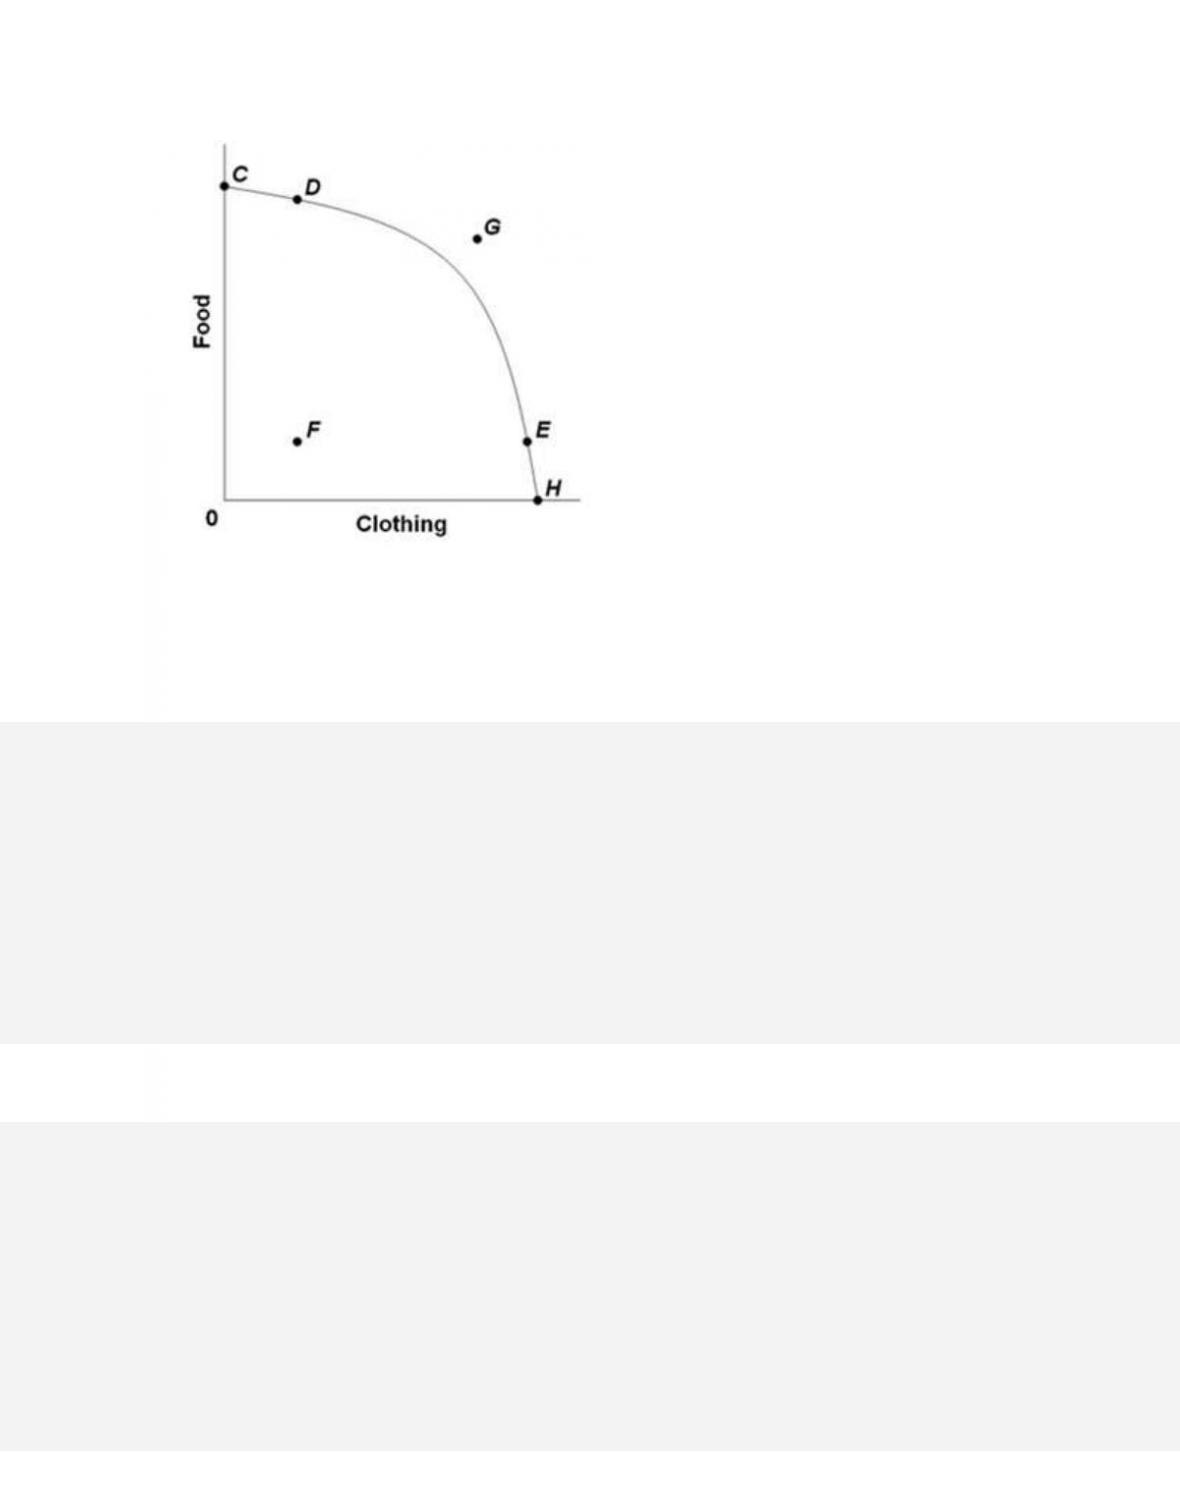
405.
Which point or output-combination in the provided graph could the nation produce only if it
experienced economic growth?
A. combination F
406. Economic growth may be represented by
A.
a movement from one end of the production possibilities curve to the other.

1-212
407. Economic growth is a result of
A.
a reduction in the unemployment rate.
408. A nation that devotes more of its resources to the production of capital goods rather
than consumer goods is likely to
D.
decrease the slope of its production possibilities curve.
409. Which of the following statements is not correct?
A.
An increase in a nation's labor supply will cause its potential output to increase.
1-213
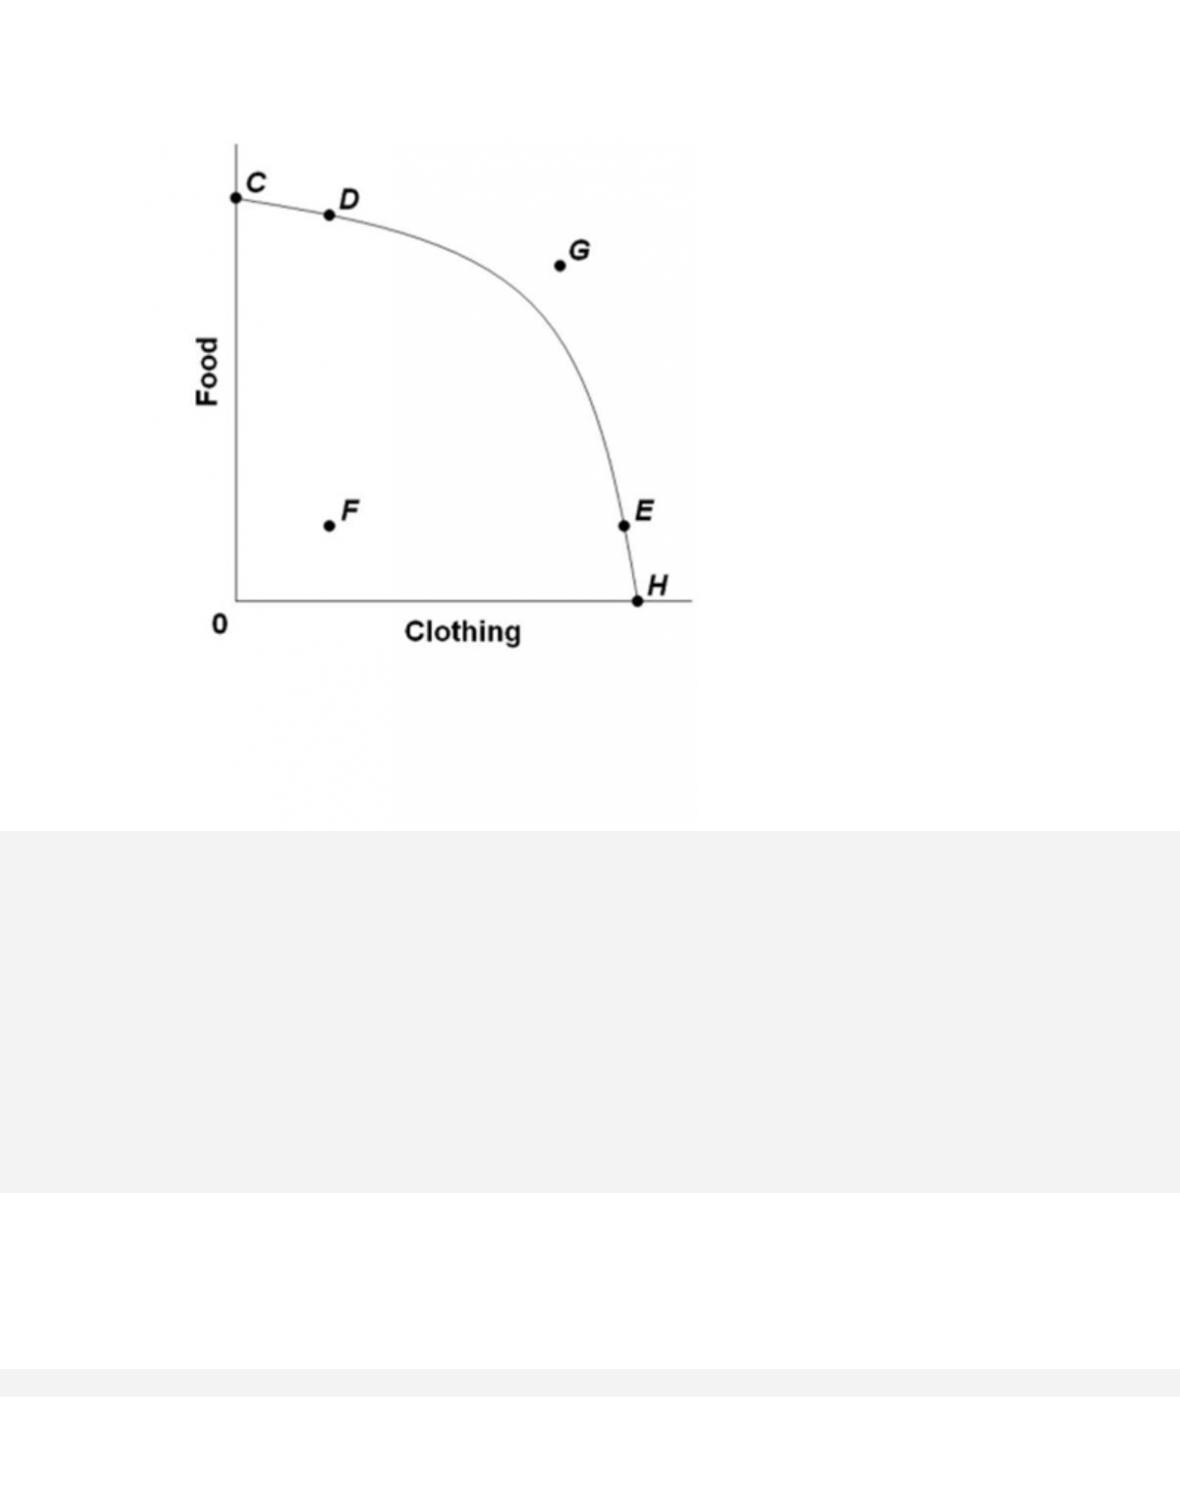
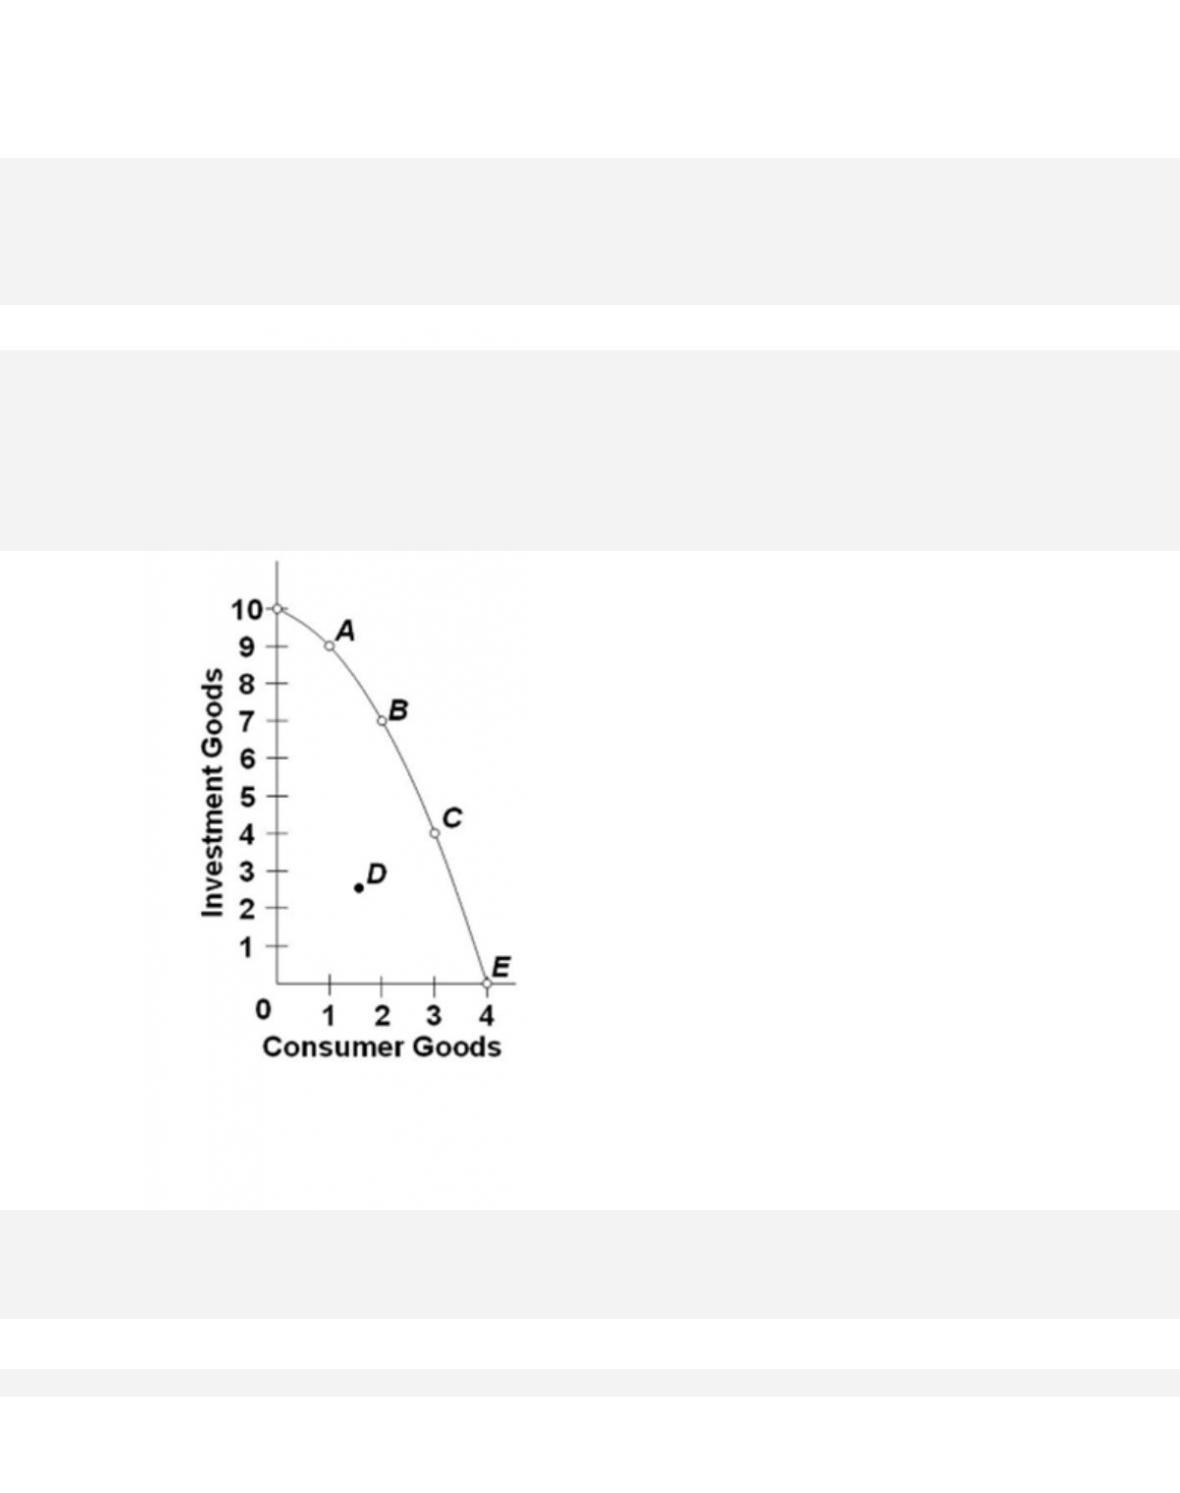
410.
Refer to the provided graph. Which point in the graph would allow a simultaneous increase
in the production of both investment and consumer goods?
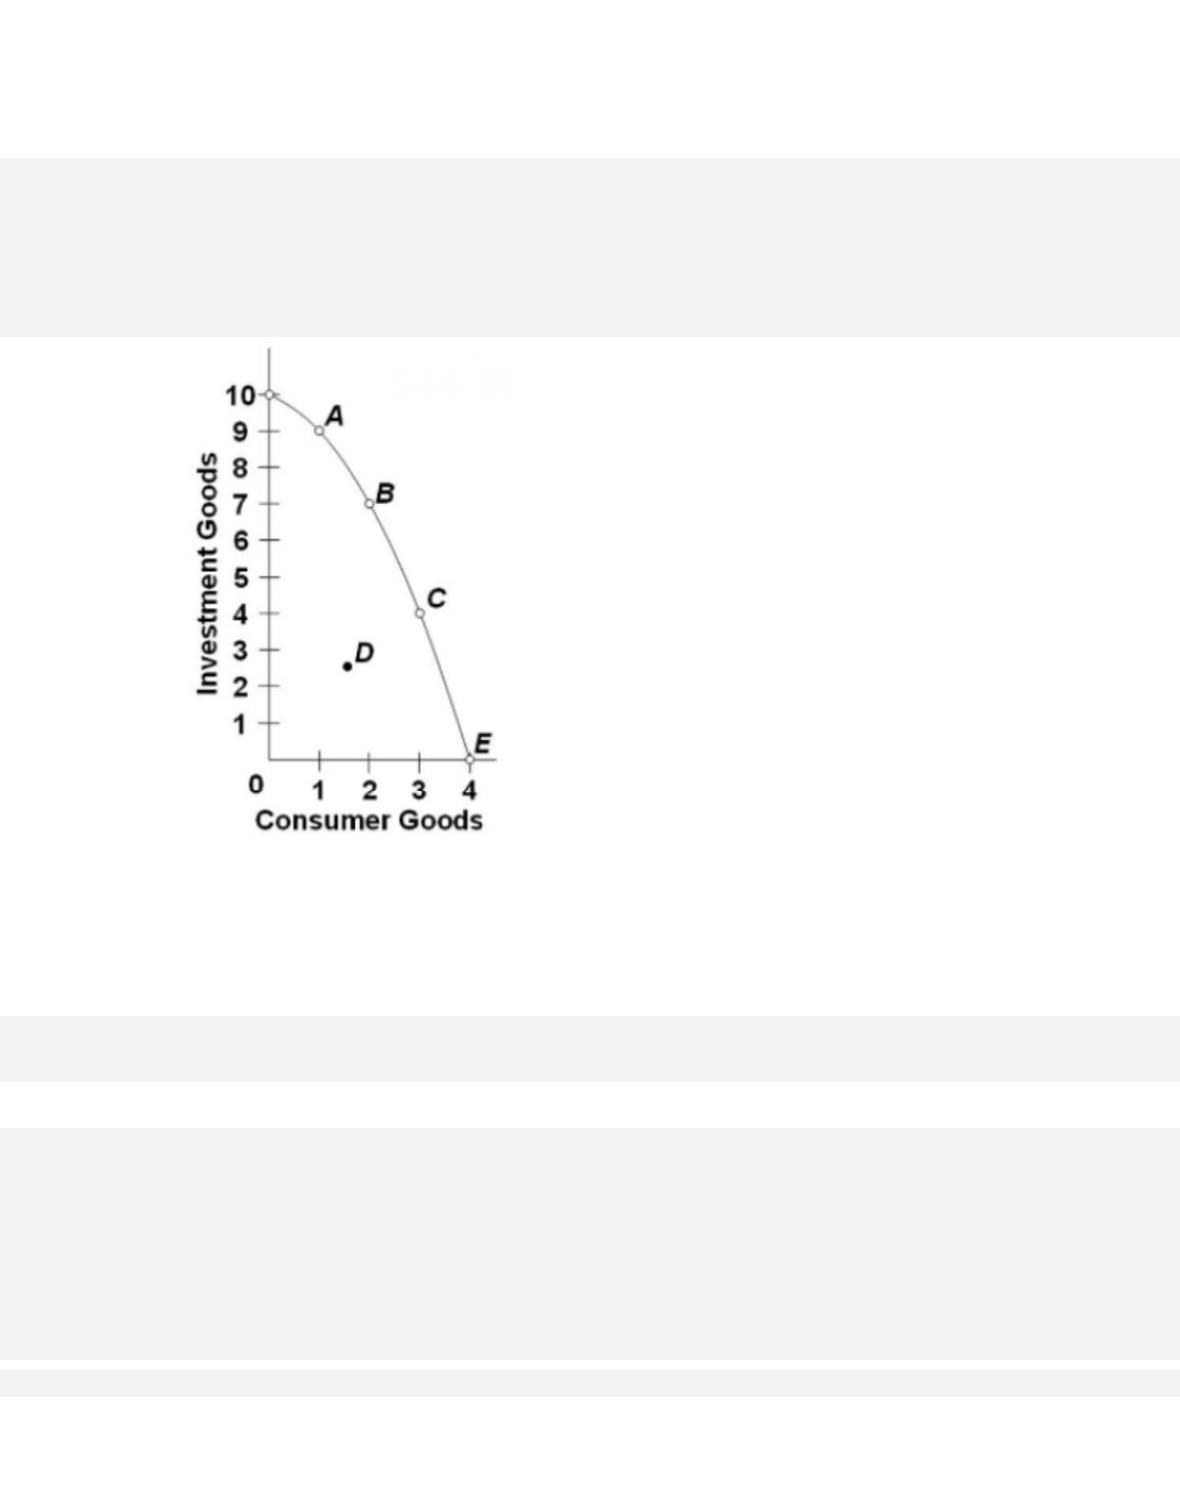
411.
Refer to the provided graph. The selection of which point on the production possibilities
curve is most likely to result in the fastest rate of economic growth over time?
A.
A
B.
B
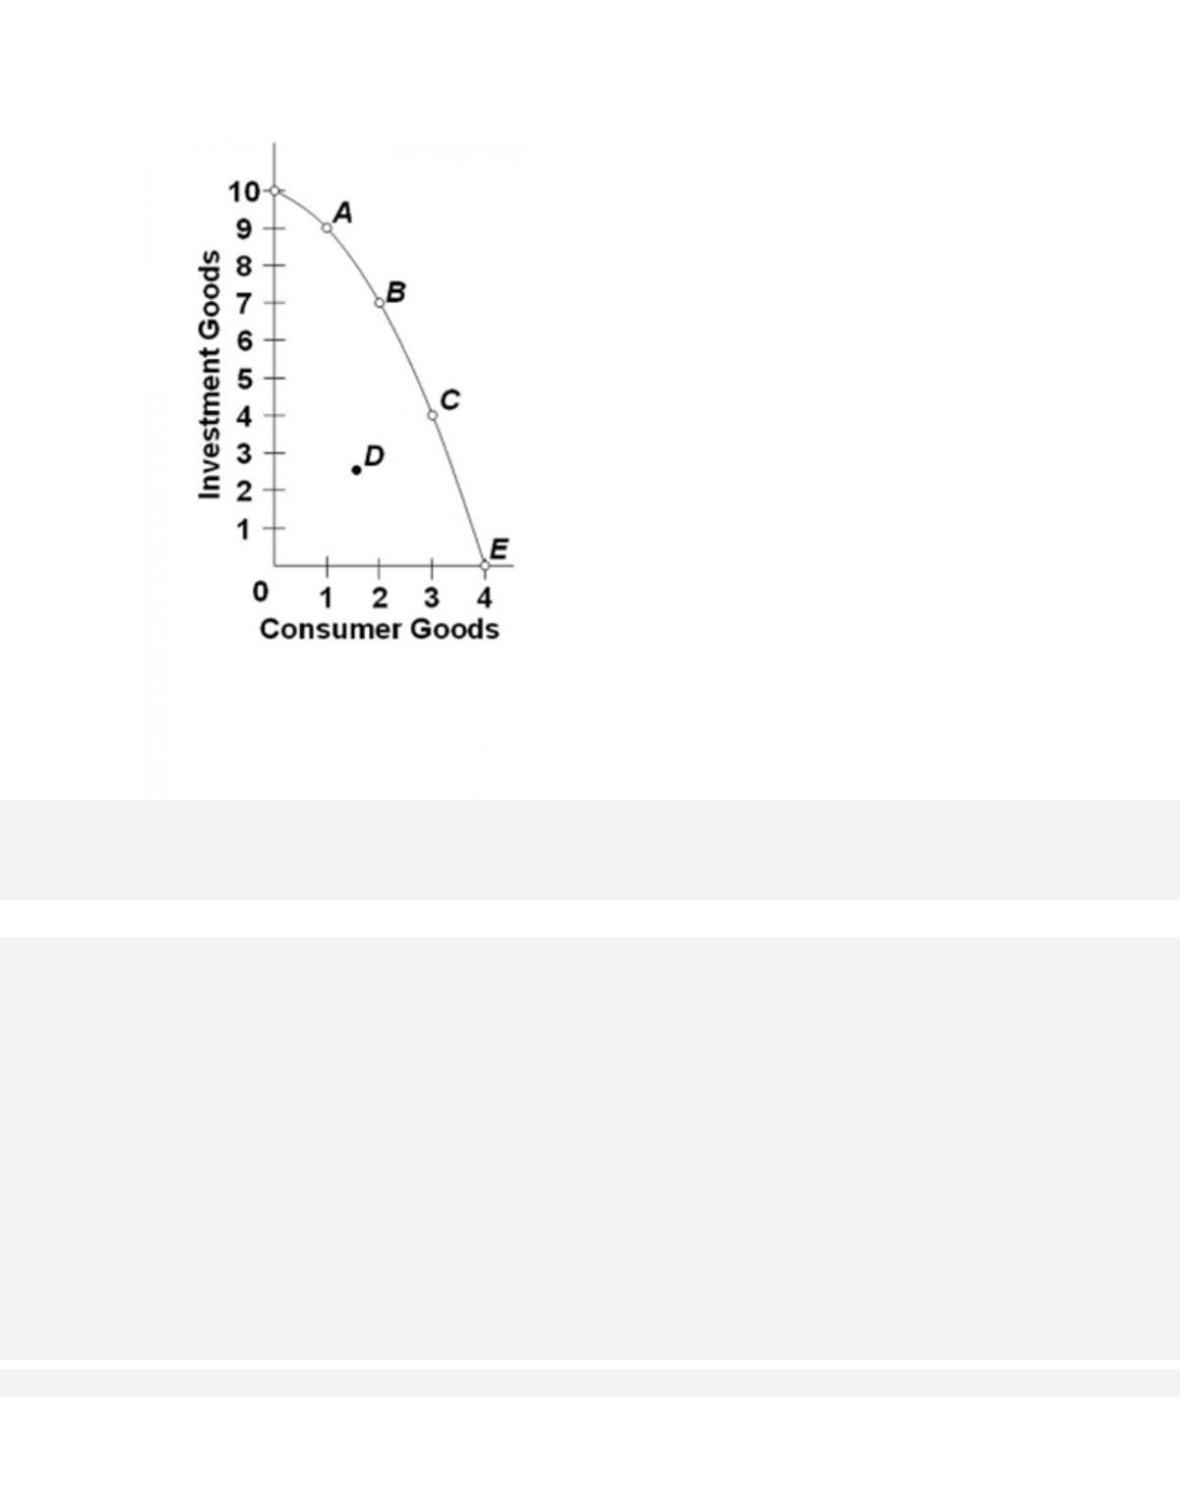
412.
Refer to the provided graph. All of the following developments would allow a movement
from point C to a point outside the production possibilities curve, except
A.
an increase in the supply of resource.
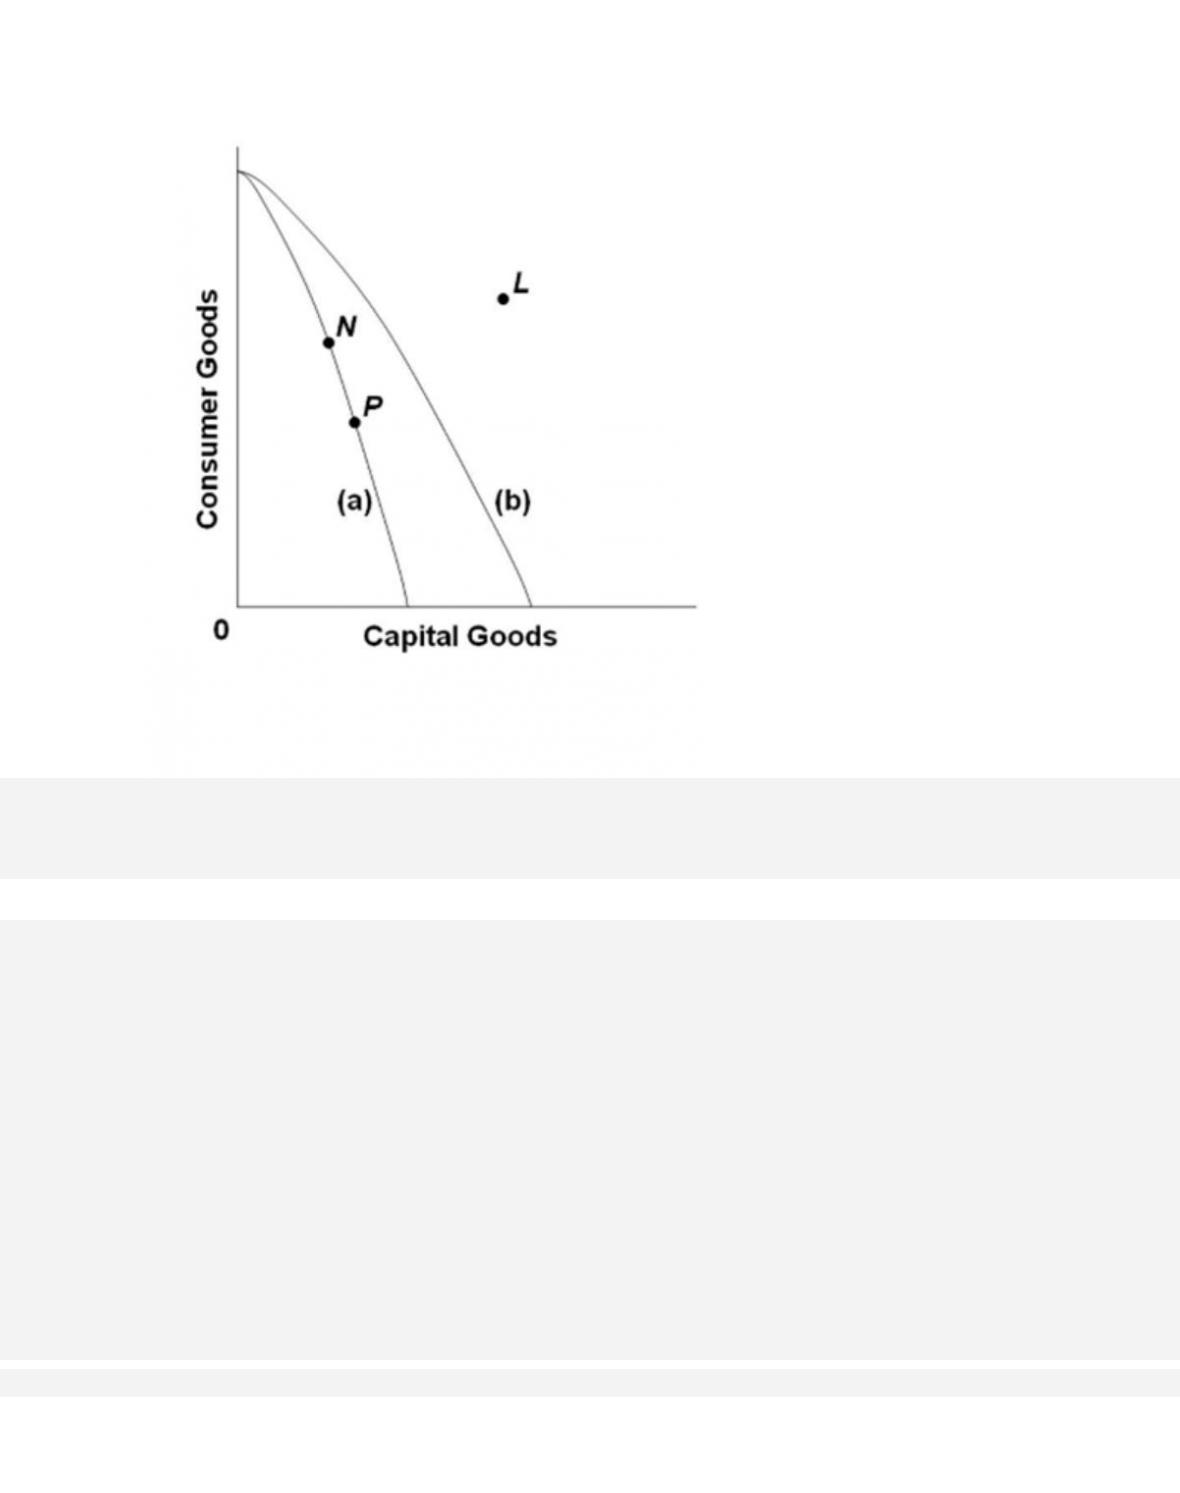
413.
Refer to the provided production possibilities curves. Curve (a) is the current curve for the
economy. Focusing on curve (a), point N suggests that the economy currently
produces
414.
Refer to the provided production possibilities curves. Curve (a) is the initial curve for the
economy, and the nation is initially producing combination P. A shift from
curve (a) to
curve (b) suggests that the economy can then increase its production of capital goods
A.
only if it reduces its production of consumer goods.
1-218
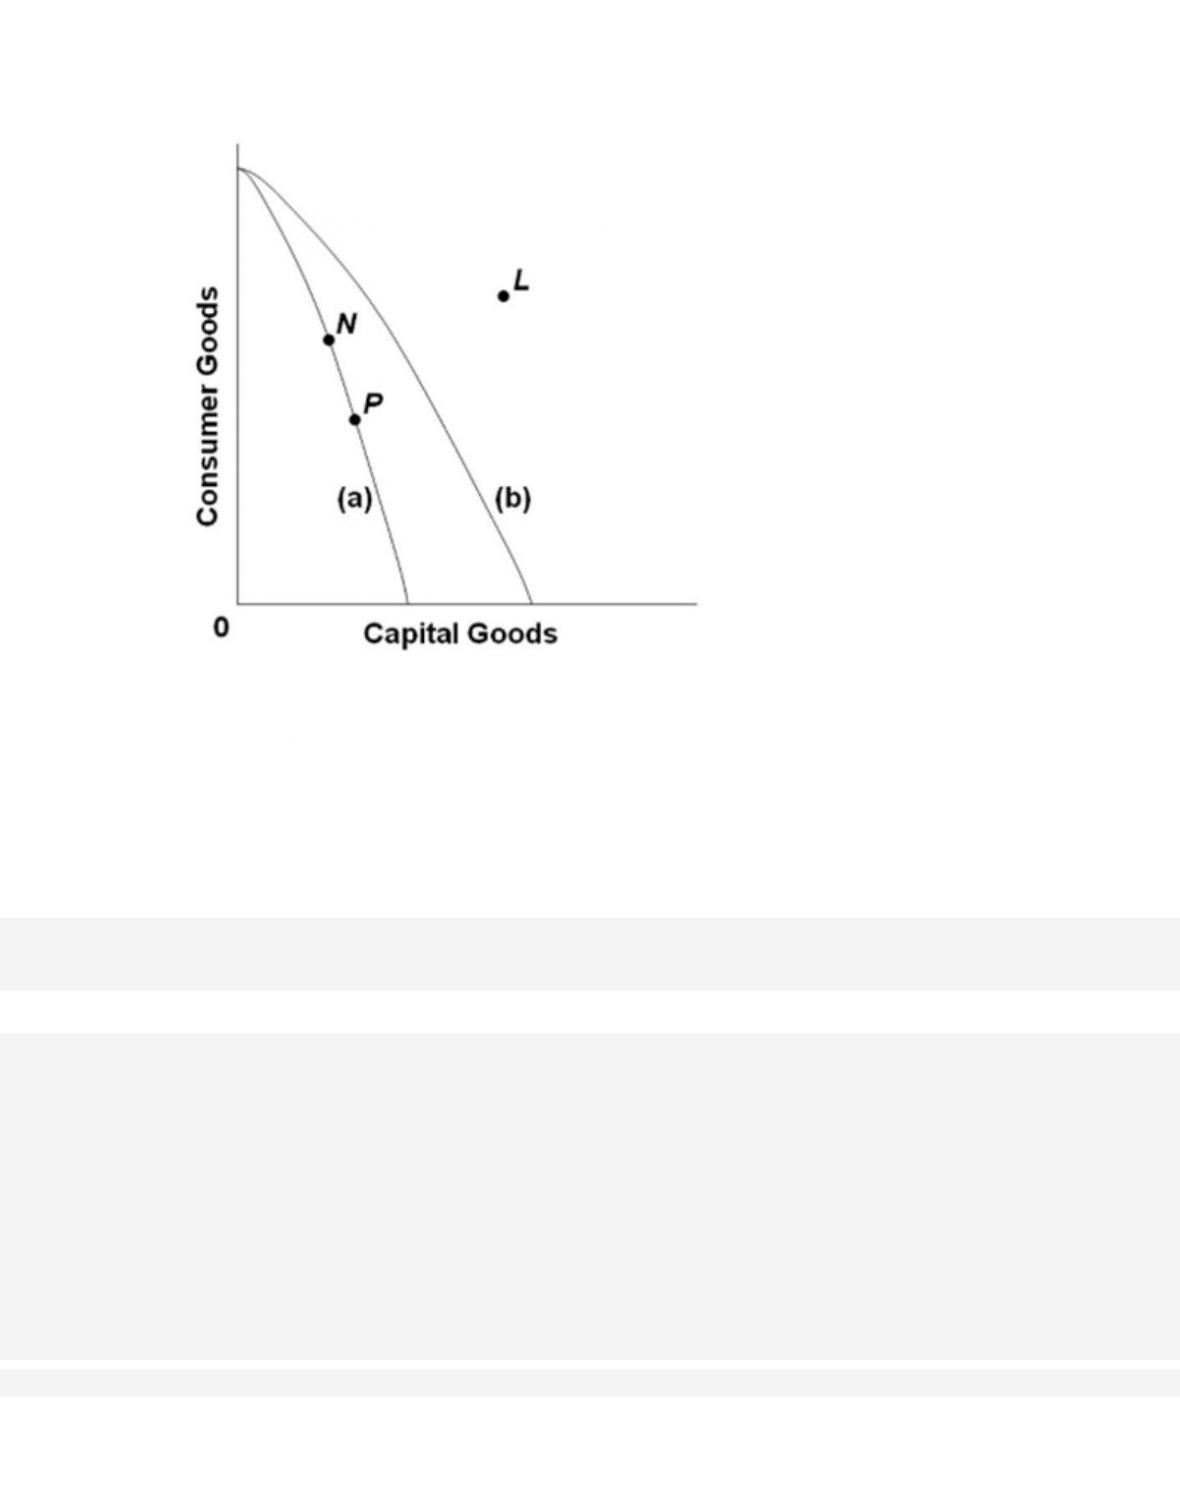
415.
Refer to the provided production possibilities curves. Curve (a) is the initial curve for the
economy. If the economy's production possibilities then shift to curve (b),
then
A.
point N would still indicate a case of full production and full employment of resources.
B.
point P would still indicate a case of full production and full employment of resources.
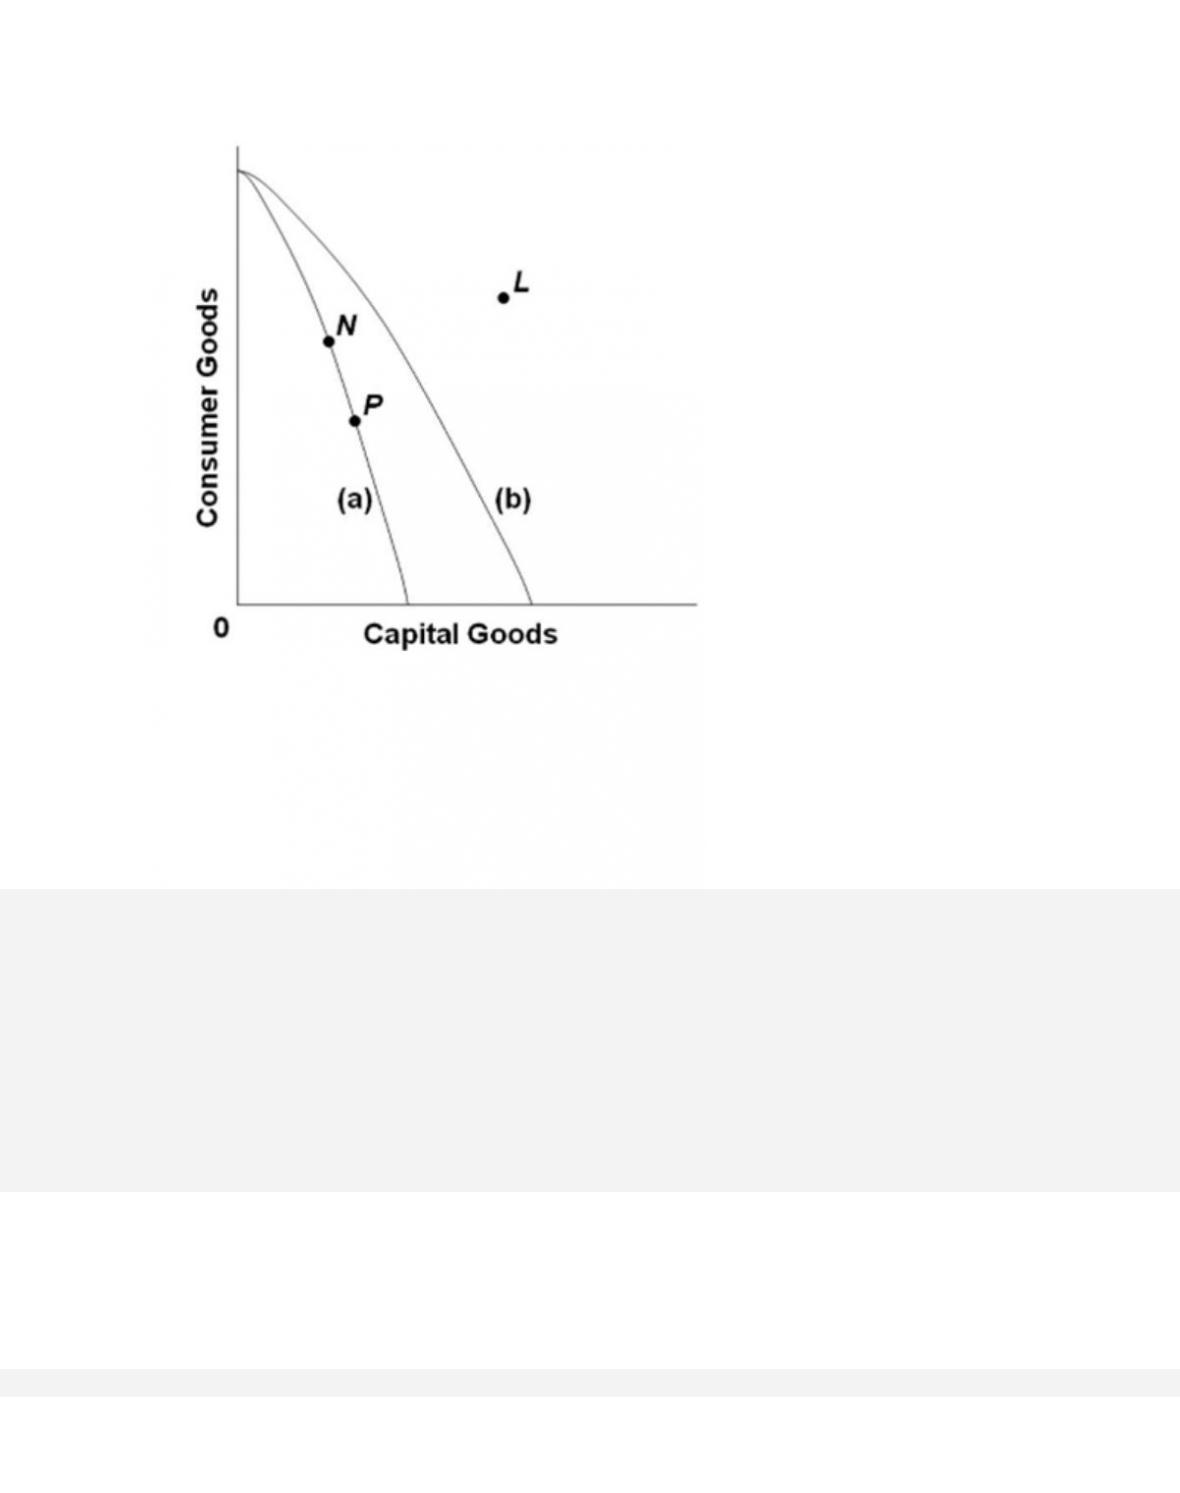
416.
Suppose there are two economies, Alpha and Beta, which have the same production
possibilities curves. If Beta devotes more resources to produce capital goods than
consumer goods as compared to Alpha, then in the future
A. Alpha will experience greater economic growth than Beta.

417.
Cuba is a command economy that suffered a decline in economic growth because of a
cut in the aid provided by the former Soviet Union when the latter collapsed. As a
consequence, Cuba
D.
went to a point inside its production possibilities curve.
418.
Which situation would most likely cause a nation's production possibilities curve to
shift inward?
A.
an increase in unemployment

1-220
419.
A nation can increase its production possibilities by
A.
shifting resources to produce more consumer goods and less investment goods.
420.
A society can consume a combination of goods outside its production possibilities if
there is
A. lower unemployment and increased capacity utilization.
421.
Specialization and international trade allow a nation to
A. produce a combination of goods that is beyond (or outside) its production possibilities.


