
24. What are two related effects that combine to make a consumer able and willing to buy more of a specific
product at a lower price than a higher price? Explain the logic of both effects.
25. A student asserts in class that the income and substitution effects lead to a decrease in the consumption of a
normal good when the price decreases. Do you agree with the statement? Explain using an example.
26. Assume that a person only purchases two goods, food and clothing, and has a fixed budget constraint. Both
goods are normal goods. If the price of food decreases, what will happen to the consumption of clothing
based on the income effect?
27. In a typical month, a family buys six bags of candy bars as snacks when the price of a bag costs $4.00.
When the price of the candy bars falls to $3.00 a bag, the family buys seven bags of candy bars a month.
When the price of a bag of candy bars rises to $6.00, the family buys three bags a month. Answer these
questions: (a) How did the fall in the price affect real income in terms of bags of candy bars? (b) How did
the rise in the price affect real income in terms of bags of candy bars? [Hint: How many bags of candy bars
could the family buy in situation (a) and in situation (b) without changing the amount they spend on candy
bars in a typical month?]
28. How can the utility-maximizing rule be used to explain the substitution and income effect?

29. Discuss the cost of leisure time in industrially advanced countries relative to those in developing countries.
30. A vice president of a company argues that the president of the company should raise workers’ wages if the
president wants less absenteeism. The president says that wages probably should be cut so that the workers
could not afford to miss so much work. Evaluate the two views using the income and substitution effects in
your analysis.
The analysis must be based on the idea that most workers prefer leisure to working for the president of the
company. Therefore, the higher their income, the more leisure they can afford (income effect). On the
31. Use marginal-utility analysis to explain why the growing popularity of iPads over laptop and desktop
computers.
32. Why would an ounce of gold be priced higher than an ounce of coffee beans, even though coffee is
generally considered more essential than gold? Explain the paradox in terms of marginal and total utility.

33. Is the following quotation consistent with the theory of consumer behavior? “The yield on time spent
working increases as the result of economic growth. Productivity per hour rises. This means that the time
allocation which has represented equilibrium at our previous income level is disrupted. The yield on time
devoted to other activities must also be raised. We are aware that time in production becomes increasingly
scarce with economic growth. What we will now claim in addition to this is that changes in the use of time
will occur, so that the yield on time in all other activities is brought into parity with the yield on working
time. In other words, economic growth entails a general increase in the scarcity of time.” (From: Staffan
Linder, The Harried Leisure Class)
34. A person has a basic choice between eating meals at home and eating meals in a restaurant. The cost of the
food that is eaten at home is $10 per meal. The cost of a restaurant meal is $20. It takes two hours to eat a
meal at home (including preparation time and cleanup time). It takes one hour of time to eat a meal in a
restaurant. The marginal utilities of the home meal and the restaurant meal are the same. The person
values time at $12 per hour. What does the theory of consumer behavior suggest the rational consumer will
decide to do: eat at home or in a restaurant? Answer by first excluding the value of time from the decision.
Then include the value of time in the decision.
If time is not a consideration in the cost of a meal, then the marginal utility per dollar of a meal at home is
greater than the marginal utility per dollar of the restaurant meal (MUh/$10 > MUr/$20). The consumer
35. How does the pricing of medical care in the United States affect the quantity consumed?
36. Explain why, in most cases, you would rather receive a gift of $25 cash over receiving a $25 sweater
chosen by your significant other.

37. Meaning well, your grandmother gives you a new wool sweater for your birthday that she knitted herself.
You, however, hate wearing wool. What is the utility problem that you face? What can you do to remedy
the problem?
38. (Last Word) Describe the relationship between raising the marginal cost of crime and the quantity of crime
committed. Explain the implications of this relationship as applied to property crimes.
39. (Last Word) Suppose Billy is determining whether he should steal a movie from Walmart. The cost of the
movie is $25 and the direct cost and the opportunity cost of stealing the movie is zero. There is a 15 percent
chance of getting caught, and caught, a fine of $250 will be charged.
(a) Will Billy steal the movie?
(b) Suppose Billy has a guilt cost of $10. Will Billy steal the movie?
40. (Last Word) Discuss the decision a criminal must make before deciding whether or not to steal.
A criminal, like a consumer, must compare the marginal utility of the good with the price it. The price of
the good, in the case of stealing, is the cost the criminal would bear by stealing the item. The marginal
utility of the good is the value the individual places on the item. The potential costs of stealing include
direct costs (supplies and tools), forgone income from legitimate work opportunities, and guilt costs. If the
criminal is caught he or she may bear additional costs in the form of fines, imprisonment, and shame.

C. Appendix Questions
consumer behavior and why?
42. What is shown by the budget line in a two-product (A and B) case? Describe what happens when there is a
43. What is the significance of the slope on a two-product budget line? What effect does a change in income
have on the slope? A change in product price?
44. Suppose a consumer has a daily income of $100 and purchases just two goods A and B. The price of good
A is $5 and the price of good B is $4.
45. How will an increase in income affect the budget line for two goods, all other things equal? How does an
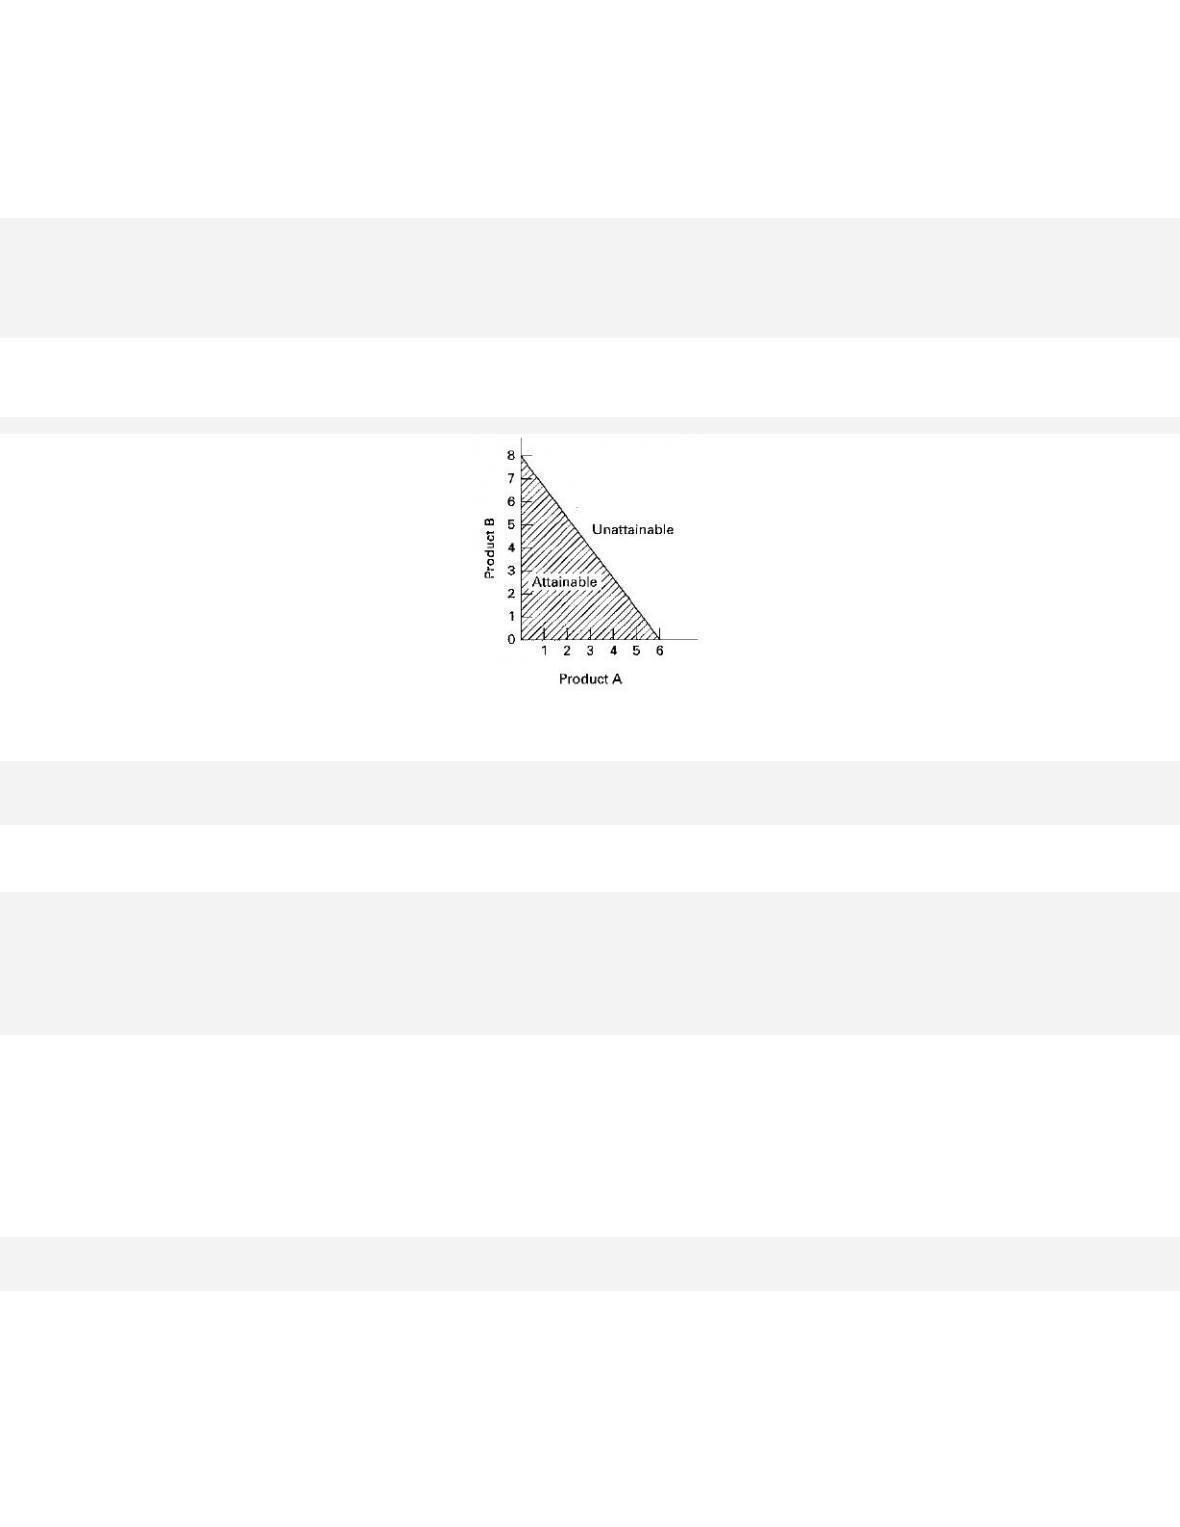
46. Suppose a consumer has a daily income of $48 and purchases just two goods, A and B. The price of A is
$8 and the price of B is $6. In the graph below, draw the budget line for the consumer. Indicate the area of
47. Why are indifference curves downsloping?
48. What is the rationale for the slope of an indifference curve in a two-product (A and B) case?
49. Explain two important characteristics of indifference curves for two goods.
50. Explain the meaning of the “marginal rate of substitution.”
51. Why can’t indifference curves intersect?
52. What is shown by the indifference map for two goods? Which indifference curve would a consumer want
to be on?
53. What are the conditions for equilibrium in indifference curve analysis?
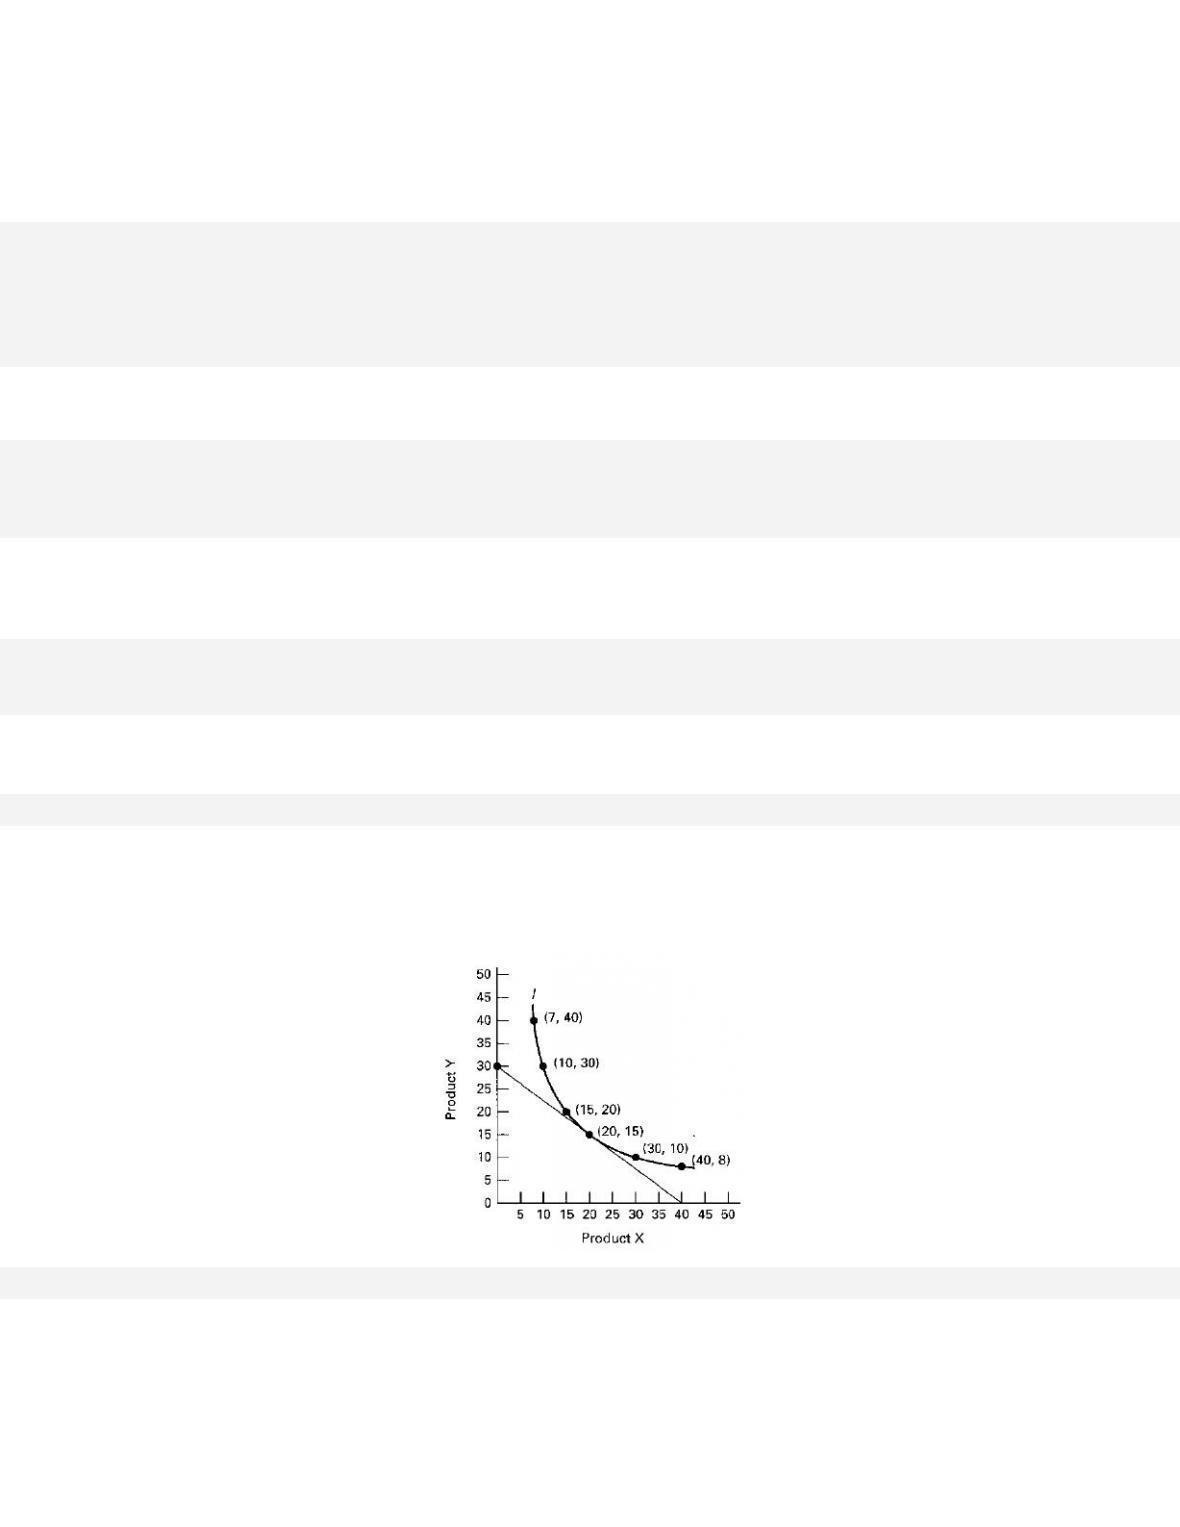
54. A consumer has a daily income of $120 and purchases two products, X and Y. The price of X is $3 and the
price of Y is $4. The following six pairs of points for X and Y define an indifference schedule: (7,40),
(10,30), (15,20), (20,15), (30,10), and (40,8). In the graph below, draw the budget line and the indifference
curve. What amounts of X and Y will allow the consumer to achieve equilibrium?
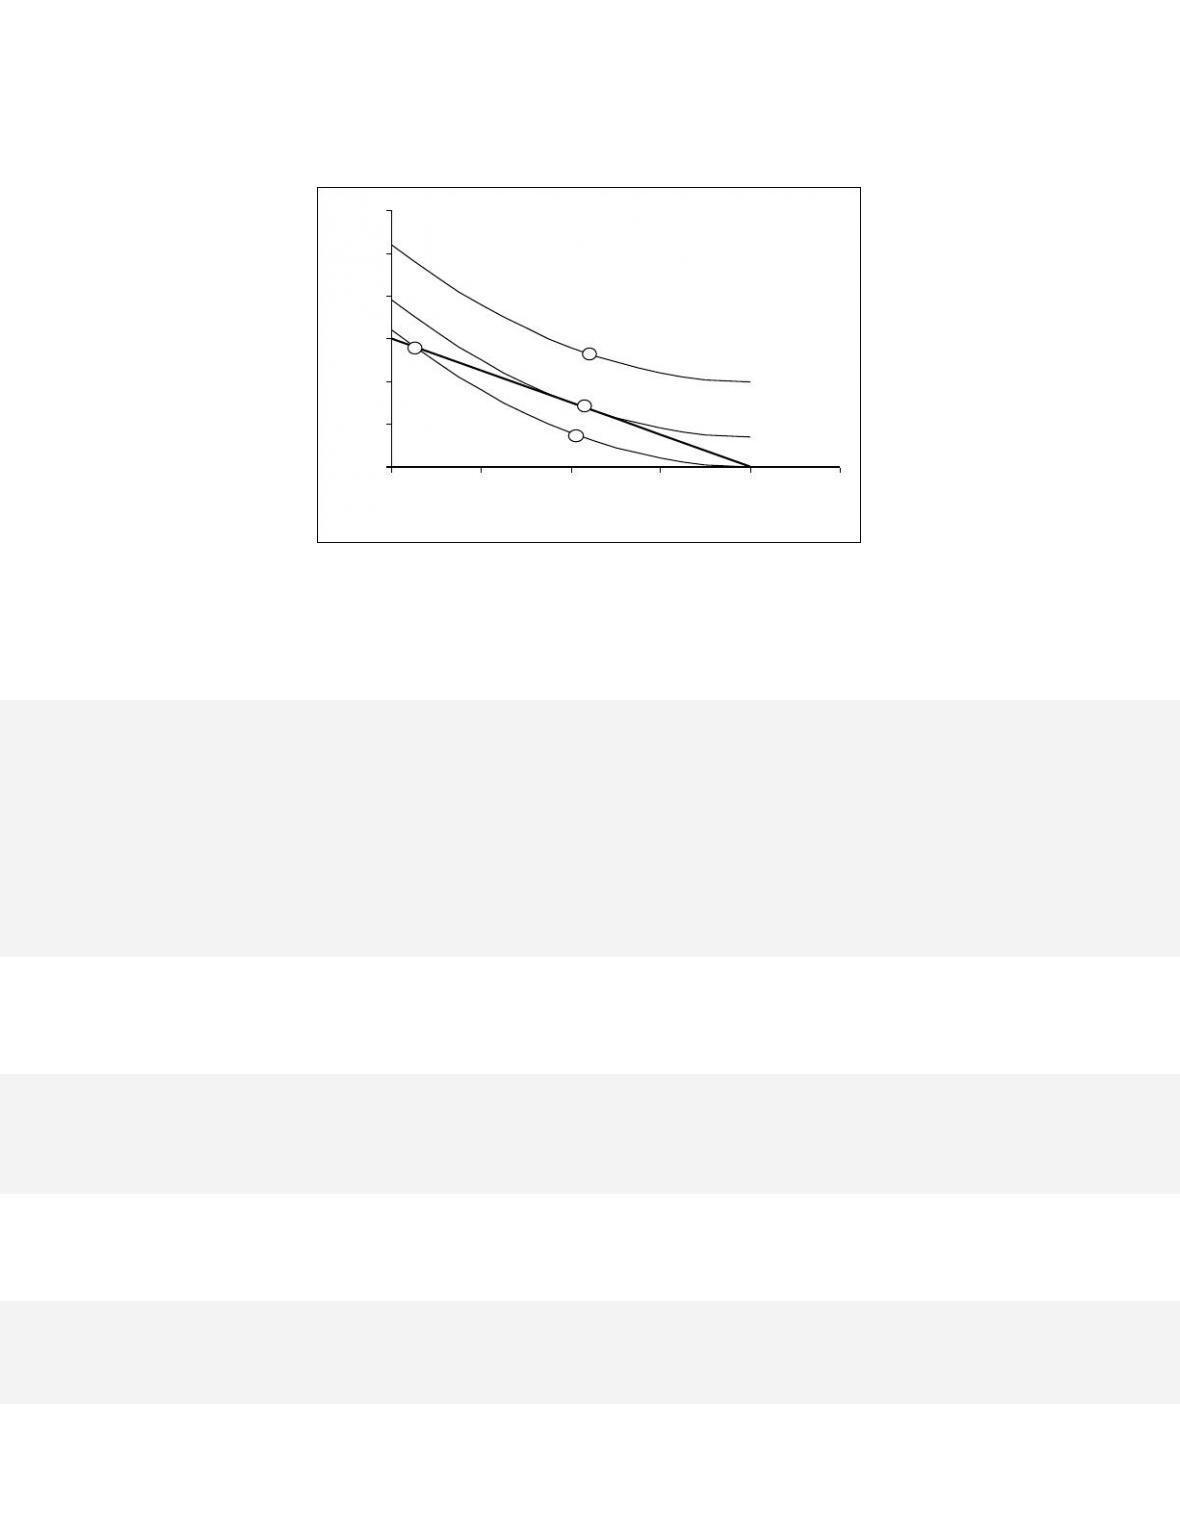
55. The graph below depicts a Bob’s budget line for 2 goods and three indifference curves depicting his
preferences. Use this graph to answer the following questions.
56. When does the marginal rate of substitution (MRS) in an indifference curve equal the ratio of marginal
utilities in marginal-utility analysis? Explain.
57. What happens to the budget line when the price of a product falls? Use indifference curve analysis to
58. How is an indifference map like a topographic map?
0
10
20
30
40
50
60
010 20 30 40 50
Quantity of A
Quantity of B
B
A
C
D
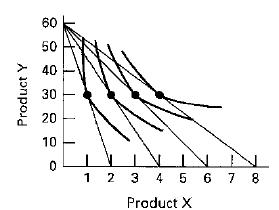
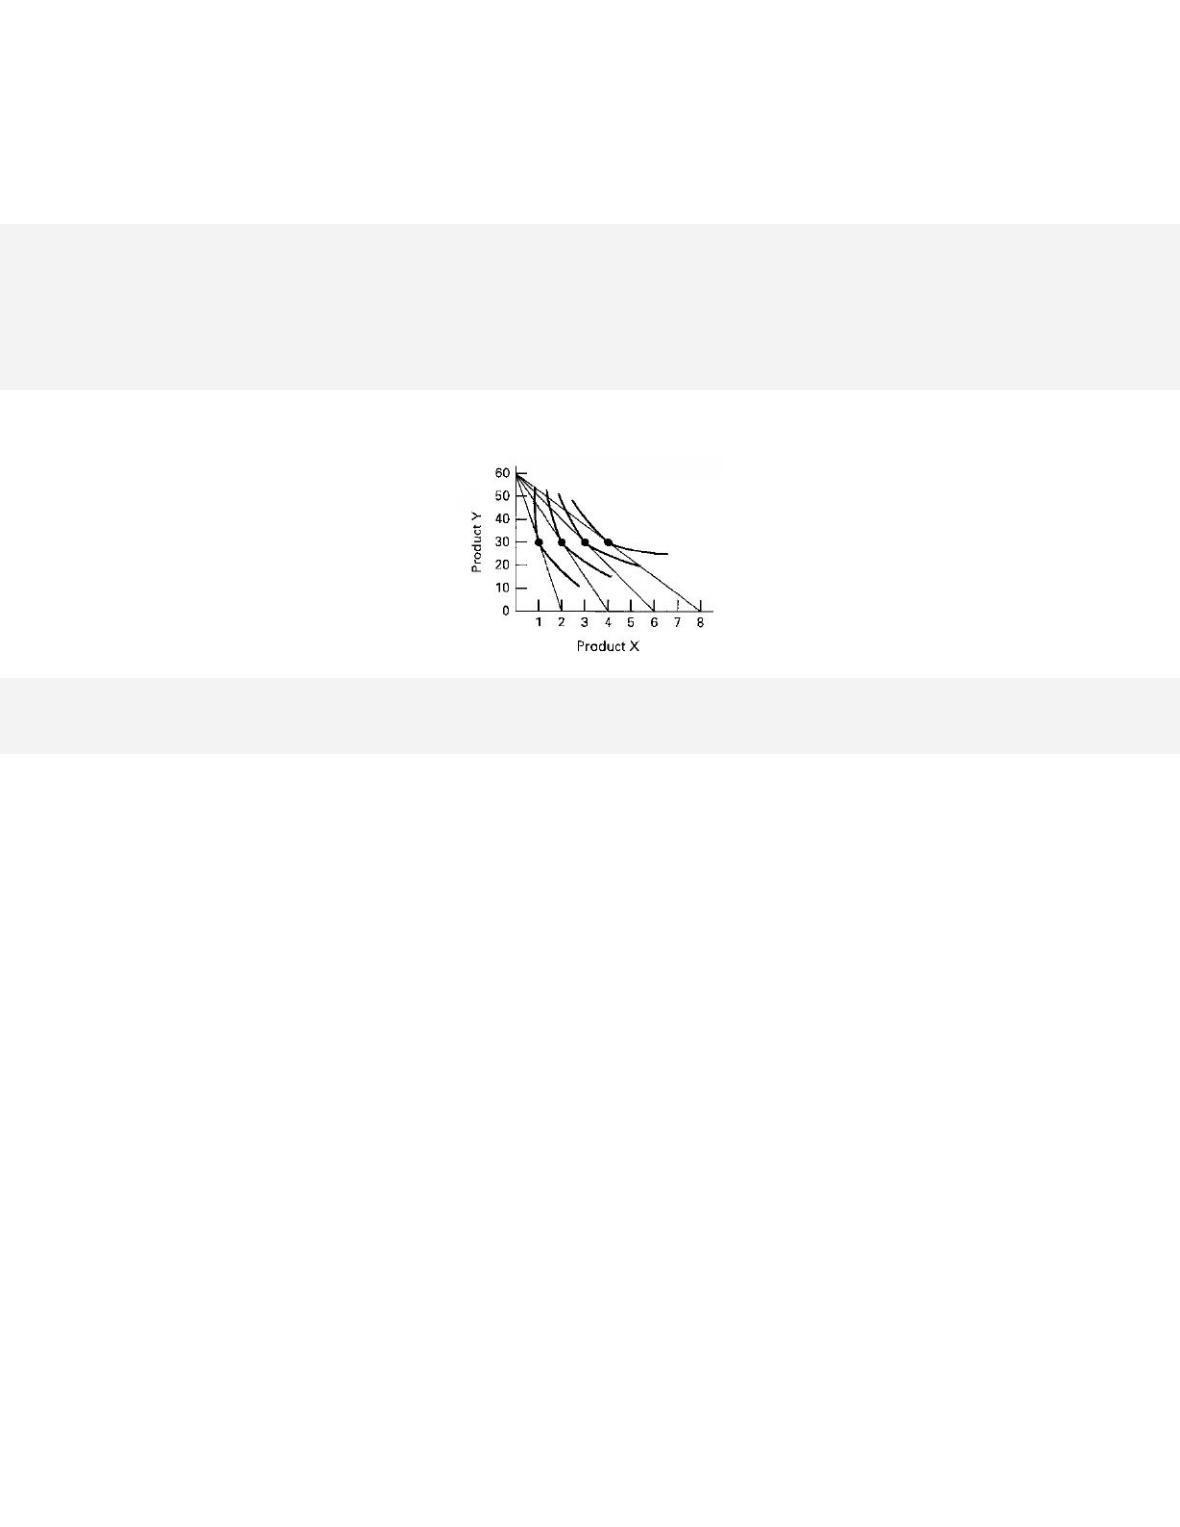
59. Using the below indifference curve graph, determine the demand curve for product X across four different
prices when the income is $60 and price of Y is $1.

D. Answers to Appendix Questions
41. Explain the difference between cardinal and ordinal utility. Which is better to use when modeling
consumer behavior and why?
42. What is shown by the budget line in a two-product (A and B) case? Describe what happens when there is a
change in income or the price of a product.
A budget line shows various combinations of two products which can be purchased with a given money
income of a consumer and given the prices of the two products. A decrease in the money income of a
43. What is the significance of the slope on a two-product budget line? What effect does a change in income
have on the slope? A change in product price?
44. Suppose a consumer has a daily income of $100 and purchases just two goods A and B. The price of good
A is $5 and the price of good B is $4.
(a) What is the slope of the budget line?
(b) Suppose the consumer’s income decreases to $80. What is the new slope?
(c) Suppose the price of product B decreases to $2. What is the new slope?
45. How will an increase in income affect the budget line for two goods, all other things equal? How does an
increase in the price of one good affect the budget line for two goods, all other things equal?
46. Suppose a consumer has a daily income of $48 and purchases just two goods, A and B. The price of A is
$8 and the price of B is $6. In the graph below, draw the budget line for the consumer. Indicate the area of
47. Why are indifference curves downsloping?
48. What is the rationale for the slope of an indifference curve in a two-product (A and B) case?
49. Explain two important characteristics of indifference curves for two goods.
First, indifference curves are downsloping because both goods will yield utility for the consumer. Because
total utility is constant for each indifference curve, the consumption of more of one good would increase
total utility and this must be offset by the decrease in the amount consumed of the other good. More utility
is derived from the consumption of one good; less utility is obtained from the other good. This inverse
relationship produces the downward (negative) slope of the indifference curves.
50. Explain the meaning of the “marginal rate of substitution.”
An indifference curve shows all the combinations of two products, X and Y that will give the consumer the
51. Why can’t indifference curves intersect?
52. What is shown by the indifference map for two goods? Which indifference curve would a consumer want
to be on?
53. What are the conditions for equilibrium in indifference curve analysis?
54. A consumer has a daily income of $120 and purchases two products, X and Y. The price of X is $3 and the
price of Y is $4. The following six pairs of points for X and Y define an indifference schedule: (7,40),
(10,30), (15,20), (20,15), (30,10), and (40,8). In the graph below, draw the budget line and the indifference
curve. What amounts of X and Y will allow the consumer to achieve equilibrium?
55. The graph below depicts a Bob’s budget line for 2 goods and three indifference curves depicting his
preferences. Use this graph to answer the following questions.
(a) Bob’s friend Martha argues that B represents the least pleasurable bundle for Bob. Do you agree?
(b) Bob’s friend Michael argues that Bob should choose to consume bundle D since it offers him the
highest utility. Do you agree?
(c) If you were a friend of Bob’s, which bundle would you advise him to take?
56. When does the marginal rate of substitution (MRS) in an indifference curve equal the ratio of marginal
utilities in marginal-utility analysis? Explain.
In equilibrium for the two good case, the MRS for good A and good B equals the ratio of the price of B to
57. What happens to the budget line when the price of a product falls? Use indifference curve analysis to
explain how this change affects consumption of the product.
Changing the price of one product shifts the budget line. When the price falls, the budget line shifts
0
10
20
30
40
50
60
010 20 30 40 50
Quantity of A
Quantity of B
B
A
C
D
58. How is an indifference map like a topographic map?
Each elevation line on a topographic map shows an equal level of elevation. As you move along a line, the
elevation stays the same. Similarly, each line for an indifference curve in an indifference map shows an
59. Using the below indifference curve graph, determine the demand curve for product X across four different
prices when the income is $60 and price of Y is $1.