
CHAPTER 4
Market Failures: Public Goods and Externalities
A. Short-Answer, Essays, and Problems
1. Explain the two types of market failure and given an example of each one.
2. Define “consumer surplus.”
3. Are consumer surplus and equilibrium price directly or inversely related? Explain your answer.
4. Define “producer surplus.”
5. At the beginning of the school year, used couches are in high demand among State University freshman
living on the sixth floor of Beta Dormitory. Fortunately for the freshman, the upperclassmen moving off of
the sixth floor are very willing to sell their used couches. Answer the following questions about the sixth
floor used-couch market.
(a) Complete the table below containing the market demand for used couches on the sixth floor. What is
the total consumer surplus?
Freshman
Maximum price
willing to pay
Equilibrium
price
Consumer
surplus
Rita
$100
$50
_____
Emily
90
50
_____
Chris
80
50
_____
Pedro
70
50
_____
Zak
60
50
_____
Natalie
50
50
_____
(b) Complete the table below containing the market supply for used couches on the sixth floor. What is
the total producer surplus?
Upperclassman
Maximum
acceptable price
Equilibrium
price
Producer
surplus
Frank
$25
$50
_____
Cho
30
50
_____
Toby
35
50
_____
Susie
40
50
_____
Rob
45
50
_____
Anisha
50
50
_____
6. In terms of consumer and producer surplus, when is economic efficiency achieved?
7. What are the three conditions that must exist when there is allocative efficiency?
8. Explain why underproduction or overproduction of a good results in efficiency losses.

4-89
9. Use the graph below to identify the efficiency loss when there is underproduction (Q1) and the efficiency
loss when there is overproduction (Q3) in a market.
10. What is the basic difference between a public good and a private good?
11. Compare and contrast the difference in private and public goods based on the characteristics of “rivalry”
and “exclusion.”
12. From the list below decide whether the product is rival or non-rival. Be sure to explain why.
13. Why is there a free-rider problem with public goods?
14. What is the free-rider problem and how does it cause the underproduction of a public good in a competitive
market?
15. (Consider This) Why do street performers face a free-rider problem? How do they try to reduce this
problem?
16. How will the market demand curve for a public good differ from the market demand curve for a private
good?
17. Describe the rationale behind supply and demand analysis for public goods.
18. “Since a public good is enjoyed by all members of society, willingness to pay for the good will not
diminish as the amount produced increases.” Evaluate and use an example to support your answer.
a
b
c
e
d
Q1
Q2
Q3
S
D
P

4-90
19. Data on two individuals’ preferences for a public good are reflected in the table below. PA and PB represent
the prices individuals A and B, the only two people in the society, are willing to pay for the last unit of a
public good, rather than do without.
Quantity
PA
PB
2
$12
$11
3
10
9
4
8
7
5
6
5
6
4
3
7
2
1
(a) Complete the table below showing the collective willingness to pay for the public good in this society.
Qd
Price
Qs
2
$_____
8
3
_____
7
4
_____
6
5
_____
5
6
_____
4
7
_____
3
(b) Given the supply schedule for this public good as shown by the Qs column, what is the optimal
quantity of this public good and what is the optimal price?
(c) What is the perceived marginal benefit and perceived marginal cost when 4 units of the public good
are supplied? What does this indicate about the allocation of resources to this public good?
20. Data on two individuals’ preferences for a public good are reflected in the table below. PA and PB represent
the prices individuals A and B, the only two people in the society, are willing to pay for the last unit of a
public good, rather than do without.
Quantity
PA
PB
1
$36
$35
2
30
30
3
24
25
4
18
20
5
12
15
6
6
10
(a) Complete the table below showing the collective willingness to pay for the public good in this society.
Qd
Price
Qs
1
$_____
7
2
_____
6
3
_____
5
4
_____
4
5
_____
3
6
_____
2
(b) Given the supply schedule for this public good as shown by the Qs column, what is the optimal
quantity of this public good and what is the optimal price?
(c) What is the perceived marginal benefit and perceived marginal cost when 3 units of the public good
are supplied? What does this indicate about the allocation of resources to this public good?
4-91
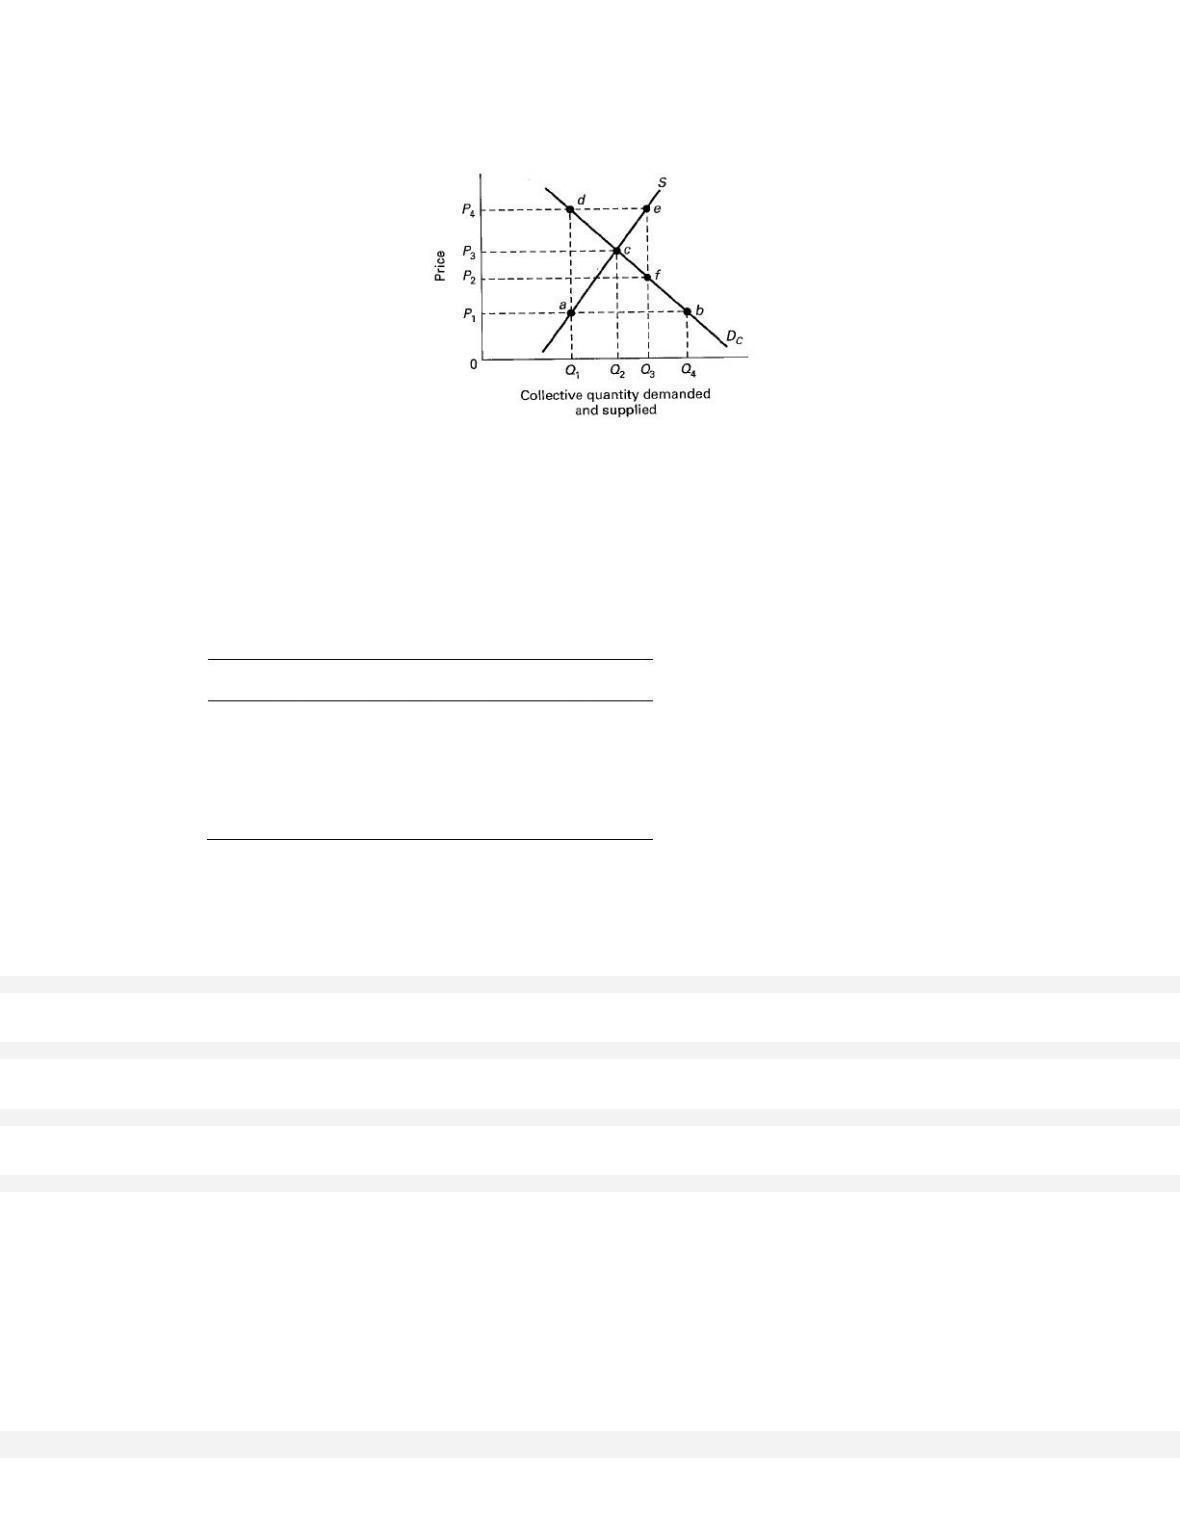
21. The next three questions refer to the below supply and demand graph for a public good.
(a) What does point c represent?
(b) What does the line segment ef at output Q3 represent?
(c) At what output level is there an underallocation of resources to the production of this public good?
22. (Consider This) Discuss how technology has transitioned music to a public good. How can the music
industry remain profitable?
23. Imagine that a state government is considering the construction of a new state office building to consolidate
state operations. Its estimate of the total costs and the total benefits of building a 4– 6-, 8-, or 10-story
building is shown in the table below. (All figures are in millions of dollars.)
Project
Total
cost
Marginal
cost
Total
benefit
Marginal
benefit
No building
$ 0
$ 0
4-story building
7
$_____
8
$_____
6-story building
16
_____
23
_____
8-story building
24
_____
28
_____
10-story building
34
_____
31
_____
(a) Compute the marginal cost and the marginal benefit of the 4-, 6-, 8-, and 10-story buildings.
(b) Should the state build a new office building? If so, what size building and what will be the total
benefit, total cost, and net benefit to society?
24. In the current presidential election, one candidate argues: “The government is extremely inefficient. To fix
25. Can economic analysis precisely determine the proper levels of government spending and taxation? In
26. How do quasi-public goods differ from pure public goods? Give examples of both types. Explain the
27. Describe the reallocation process of resources when the government provides more public or quasi-public
28. Define negative externality and give an example.
29. Define positive externality and give an example.

4-92
30. Demand and supply curves for products for which there are negative or positive externalities are shown in
the three graphs below.
(a) On this graph draw in another curve that indicates what might happen after the producer was prevented
from causing a negative externality or was forced to pay a tax to cover these costs.
(b) On this graph draw in another curve that indicates the situation after the government subsidizes the
producer because there are positive externalities from this product.
(c) On this graph draw in another curve that indicates the situation after the government subsidizes
consumers for this product which has a positive externality.
31. What are negative externalities and positive externalities? How do they affect supply and demand curves?
32. (Consider This) How could you use the Coase theorem to predict what would happen when smoke from a
factory creates dirty air and slightly acid rain for all the residents in the area in a one-mile radius of the
plant?
33. What is a Pigouvian Tax? Give an example of a good that the government may place this tax on.
34. How do direct controls and specific taxes affect externalities? Briefly explain in terms of supply and
demand.
35. What resource problem is created by negative externalities and what methods are suggested for dealing
with this problem?
36. What resource problem is created by positive externalities and what methods are suggested for dealing with
this problem?
37. Explain the statement: “Clean air and water have become increasingly scarce and valuable resources
because they have been treated in the past as if they were free and unlimited in supply.” What methods
might be used to internalize spillover costs?
38. Suppose a local coffee shop in the downtown area decides to purchase a neighboring abandoned lot and
convert it into a garden area with outdoor seating.
(a) Does this decision create an externality? If so, what kind?
(b) Despite the city’s positive response to the coffee shop’s renovation, other businesses in the area have
not followed suit in renovating the many decrepit buildings and abandoned lots. How might the
presence of an externality be in part the cause of this?
(c) In response to the lack of effort on the part of businesses to renovate the downtown area, city council
members to take action. What are some ways that the city government could promote this kind of
revival?
39. Should all pollution be banned? Why might some level of pollution be economically efficient?
Quantity
(a)
P
D
S
0
Quantity
(b)
P
D
S
0
Quantity
(c)
P
D
S
0

4-93
40. The following table shows marginal costs and benefits of the optimal quantity of pollution abatement that
will occur at a local factory.
Quantity of pollution
abatement
Marginal
cost
Marginal
benefit
700 tons
$100,000
$ 20,000
600 tons
60,000
30,000
500 tons
40,000
40,000
400 tons
20,000
60,000
300 tons
10,000
80,000
200 tons
5,000
160,000
(a) What is the optimal level of pollution abatement? Why?
(b) If the marginal benefit of pollution abatement were to increase by $30,000 at each level because of the
factory’s desire to improve its image and environment, what would the optimal level be? Why?
(c) What might cause the optimal level of pollution abatement to be 400 tons?
41. The following table shows marginal costs and benefits of the optimal quantity of pollution abatement that
will occur at a local factory.
Quantity of pollution
abatement
Marginal
cost
Marginal
benefit
200 tons
$300,000
$ 20,000
180 tons
180,000
30,000
160 tons
120,000
40,000
140 tons
60,000
60,000
120 tons
30,000
80,000
100 tons
15,000
160,000
(a) What is the optimal level of pollution abatement? Why?
(b) If the marginal benefit of pollution abatement were to increase by $150,000 at each level because of
the factory’s desire to improve its image and environment, what would the optimal level be? Why?
(c) What might cause the optimal level of pollution abatement to be 120 tons?
42. “Pollution should be completely eliminated.” Evaluate. Support your answer using MB and MC analysis.
43. What perspective do economists use to evaluate the issue of the amount of pollution control?
44. What are the limitations to government’s role in the economy?
45. (Last Word) Describe the idea behind the cap-and-trade program for improving environmental quality.
46. (Last Word) Describe how a market for externality rights or cap-and-trade system would work in terms of
supply and demand.
4-94
47. (Last Word) Assume the atmosphere of an urban area is able to reabsorb 4000 tons of pollutants per year.
The schedule below shows the price polluters would be willing to pay for the right to dispose of 1 ton of
pollutants per year and the total quantity of pollutants they would wish to dispose of at each price.
Price
(per ton of
pollutant rights)
Total quantity of pollutant
rights demanded
(tons)
$ 0
8000
1000
7000
2000
6000
3000
5000
4000
4000
5000
3000
6000
2000
7000
1000
(a) If there were no emission fee, how many tons of pollutants would there be and how much greater
would this amount be than the capacity for reabsorption?
(b) What pollution fee should the urban authorities charge to solve the problem?
(c) What would happen in this market for pollution rights if quantity demanded increased by 1000 tons at
each price?
48. (Last Word) Assume the atmosphere of an urban area is able to reabsorb 8000 tons of pollutants per year.
The schedule below shows the price polluters would be willing to pay for the right to dispose of 1 ton of
pollutants per year and the total quantity of pollutants they would wish to dispose of at each price.
Price
(per ton of
pollutant rights)
Total quantity of pollutant
rights demanded
(tons)
$ 0
13,000
1000
12,000
2000
11,000
3000
10,000
4000
9,000
5000
8,000
6000
7,000
7000
6,000
(a) If there were no emission fee, how many tons of pollutants would there be and how much greater
would this amount be than the capacity for reabsorption?
(b) What pollution fee should the urban authorities charge to solve the problem?
(c) What would happen in this market for pollution rights if quantity demanded increased by 1000 tons at
each price?
49. (Last Word) Draw a supply and demand graph on the below diagram that illustrates the market for
pollution rights. Label the axes and curves. Then show what happens to price and quantity when the
demand for pollution rights increases in the market.

4-95

4-96
B. Answers to Short-Answer, Essays, and Problems
1. Explain the two types of market failure and given an example of each one.
2. Define “consumer surplus.”
3. Are consumer surplus and equilibrium price directly or inversely related? Explain your answer.
4. Define “producer surplus.”
5. At the beginning of the school year, used couches are in high demand among State University freshman
living on the sixth floor of Beta Dormitory. Fortunately for the freshman, the upperclassmen moving off of
the sixth floor are very willing to sell their used couches. Answer the following questions about the sixth
floor used-couch market.
(a) Complete the table below containing the market demand for used couches on the sixth floor. What is
the total consumer surplus?
Freshman
Maximum price
willing to pay
Equilibrium
price
Consumer
surplus
Rita
$100
$50
_____
Emily
90
50
_____
Chris
80
50
_____
Pedro
70
50
_____
Zak
60
50
_____
Natalie
50
50
_____
(b) Complete the table below containing the market supply for used couches on the sixth floor. What is
the total producer surplus?
Maximum
Equilibrium
Producer

4-97
Upperclassman
acceptable price
price
surplus
Frank
$25
$50
_____
Cho
30
50
_____
Toby
35
50
_____
Susie
40
50
_____
Rob
45
50
_____
Anisha
50
50
_____
(a) The total consumer surplus is $150 (= 50 +40+30+20+10). See table.
Freshman
Maximum price
willing to pay
Equilibrium
price
Consumer
surplus
Rita
$100
$50
$50 (= 100 − 50)
Emily
90
50
40 (= 90 − 50)
Chris
80
50
30 (= 80 − 50)
Pedro
70
50
20 (= 70 − 50)
Zak
60
50
10 (= 60 − 50)
Natalie
50
50
0 (= 50 − 50)
(b) Total producer surplus is $125 (=25+20+15+10+5). See table.
Upperclassman
Maximum
acceptable price
Equilibrium
price
Producer
surplus
Frank
$25
$50
$25 (= 50 − 25)
Cho
30
50
20 (= 50 − 30)
Toby
35
50
15 (= 50 − 35)
Susie
40
50
10 (= 50 − 40)
Rob
45
50
5 (= 50 − 45)
Anisha
50
50
0 (= 50 − 50)
6. In terms of consumer and producer surplus, when is economic efficiency achieved?
7. What are the three conditions that must exist when there is allocative efficiency?
8. Explain why underproduction or overproduction of a good results in efficiency losses.
4-98
9. Use the graph below to identify the efficiency loss when there is underproduction (Q1) and the efficiency
loss when there is overproduction (Q3) in a market.
10. What is the basic difference between a public good and a private good?
11. Compare and contrast the difference in private and public goods based on the characteristics of “rivalry”
and “exclusion.”
12. From the list below decide whether the product is rival or non-rival. Be sure to explain why.
a) Scenic view
b) Netflix
c) Ice Cream Cone
d) Online Newspaper
e) Internet Domain names
a
b
c
e
d
Q1
Q2
Q3
S
D
P

13. Why is there a free-rider problem with public goods?
14. What is the free-rider problem and how does it cause the underproduction of a public good in a competitive
market?
15. (Consider This) Why do street performers face a free-rider problem? How do they try to reduce this
problem?
16. How will the market demand curve for a public good differ from the market demand curve for a private
good?
The demand curve for the private good will be an accurate reflection of what people are willing to pay for a
17. Describe the rationale behind supply and demand analysis for public goods.
With a private good you add together the quantities demanded people are willing to pay at each possible
price, whereas with a public good you add together the prices people are willing to pay for the last unit of

4-100
18. “Since a public good is enjoyed by all members of society, willingness to pay for the good will not
diminish as the amount produced increases.” Evaluate and use an example to support your answer.
19. Data on two individuals’ preferences for a public good are reflected in the table below. PA and PB represent
the prices individuals A and B, the only two people in the society, are willing to pay for the last unit of a
public good, rather than do without.
Quantity
PA
PB
2
$12
$11
3
10
9
4
8
7
5
6
5
6
4
3
7
2
1
(a) Complete the table below showing the collective willingness to pay for the public good in this society.
Qd
Price
Qs
2
$_____
8
3
_____
7
4
_____
6
5
_____
5
6
_____
4
7
_____
3
(b) Given the supply schedule for this public good as shown by the Qs column, what is the optimal
quantity of this public good and what is the optimal price?
(c) What is the perceived marginal benefit and perceived marginal cost when 4 units of the public good
are supplied? What does this indicate about the allocation of resources to this public good?
(a) See table.
Qd
Price
Qs
2
$23
8
3
19
7
4
15
6
5
11
5
6
7
4
7
3
3

4-101
20. Data on two individuals’ preferences for a public good are reflected in the table below. PA and PB represent
the prices individuals A and B, the only two people in the society, are willing to pay for the last unit of a
public good, rather than do without.
Quantity
PA
PB
1
$36
$35
2
30
30
3
24
25
4
18
20
5
12
15
6
6
10
(a) Complete the table below showing the collective willingness to pay for the public good in this society.
Qd
Price
Qs
1
$_____
7
2
_____
6
3
_____
5
4
_____
4
5
_____
3
6
_____
2
(b) Given the supply schedule for this public good as shown by the Qs column, what is the optimal
quantity of this public good and what is the optimal price?
(c) What is the perceived marginal benefit and perceived marginal cost when 3 units of the public good
are supplied? What does this indicate about the allocation of resources to this public good?
(a) See table.
Qd
Price
Qs
1
$71
7
2
60
6
3
49
5
4
38
4
5
27
3
6
16
2