
30. Suppose the aggregate demand and supply schedules for a hypothetical economy are as shown below.
Amount of real
domestic output
demanded, billions
Price level
(price index)
Amount of real
domestic output
supplied, billions
$ 200
300
$800
400
250
800
600
200
600
800
150
400
1000
100
200
(a) Use these sets of data to graph the aggregate demand and supply curves on the below graph.
(b) What will be the equilibrium price and output level in this hypothetical economy? Is it also the full-
employment level of output? Explain.
(c) Why won’t the 150 index be the equilibrium price level? Why won’t the 250 index be the equilibrium
price level?
(d) Suppose demand increases by $400 billion at each price level. What will be the new equilibrium price
and output levels?
(e) What factors might cause a change in aggregate demand?

31. Suppose the aggregate demand and supply schedules for a hypothetical economy are as shown below.
Amount of real
domestic output
demanded, billions
Price level
(price index)
Amount of real
domestic output
supplied, billions
$ 60
350
$240
120
300
240
180
250
180
240
200
120
300
150
60
(a) What will be the equilibrium price and output level in this hypothetical economy? Is it also the full–
employment level of output? Explain.
(b) Why won’t the 200 index be the equilibrium price level? Why won’t the 300 index be the equilibrium
price level?
(c) Suppose demand increases by $120 billion at each price level. What will be the new equilibrium price
and output levels?
(d) List five factors that might cause a change in aggregate demand.
32. Describe each of the following outcomes in terms of shifts in aggregate demand or aggregate supply
curves.
(a) A recession deepens while the rate of inflation increases
(b) The price level rises sharply while real output and employment increase
(c) The price level falls, but the unemployment rate rises
(d) Real output rises, unemployment rate falls, and the price level rises

33. Evaluate the effect of the following on the AD curve, AS curve, equilibrium price level and equilibrium
output.
(a) The U.S. imposes tariffs on foreign goods to promote domestic industry. In retaliation, foreign
countries impose tariffs on U.S. goods.
(b) Congress decides to decrease personal income taxes, and to compensate for the lost revenue they
decrease business subsidies.
(c) A technology boom improves technology across industries, improving their productivity.
(d) U.S. oil companies discover new large oil reserves in the U.S. The international price of oil falls.
34. Illustrate the following by drawing a short-run aggregate supply curve and aggregate demand graph in the
appropriate graph spaces below:
(a) A new technology allows workers to be more productive.
(b) A recession causes consumer wealth to fall.
(c) The dollar depreciates relative to the euro.
(d) The regulations associated with Obamacare are enforced.

35.What is the effect of the multiplier when aggregate demand increases and there is a large increase in the
price level? What happens when there only is a small increase in the price level?
36. In the table below are aggregate demand and supply schedules.
Price level
Real domestic output
Demanded
Supplied
(1)
(2)
(3)
(4)
250
1400
1900
2000
225
1500
2000
2000
200
1600
2100
1900
175
1700
2200
1700
150
1800
2300
1400
125
1900
2400
1000
100
2000
2500
500
(a) On the graph below, plot the aggregate demand curve shown in columns (1) and (2) in the above table,
and label this curve AD1.
(b) On the graph below, plot the aggregate supply curve shown in columns (1) and (4) in the above table;
and label this curve AS.
(c) What is the level of equilibrium real domestic output and price level?
(d) Now assume that aggregate demand changes. Use columns (1) and (3) to plot the new aggregate
demand curve; and label this curve AD2.
(e) What is the new level of equilibrium real domestic output and price level?

37. Use this aggregate demand–aggregate supply schedule for a hypothetical economy to answer the following
questions.
Real domestic
output demanded
(in billions)
Price level
Real domestic
output supplied
(in billions)
$3000
350
$9000
4000
300
8000
5000
250
7000
6000
200
6000
7000
150
5000
8000
100
4000
(a) What will be the equilibrium price level and quantity of real domestic output?
(b) If the quantity of real domestic output demanded increased by $2000 at each price level, what will be
the new equilibrium price level and quantity of real domestic output?
(c) Using the original data from the table, if the quantity of real domestic output demanded increased by
$5000 and the quantity of real domestic output supplied increased by $1000 at each price level, what
would the new equilibrium price level and quantity of real domestic output be?
38. What are five reasons for the downward price-level inflexibility, especially as it pertains to wages and
prices?
39. Is there downward price inflexibility applicable to today’s economy? What factors might explain it?
40. (Consider This) What is the ratchet effect? How does it apply to price level changes in the economy as
aggregate demand changes?

41. Explain “cost–push” inflation using aggregate demand–aggregate supply analysis.
42. Some economists argue that it is easier to resolve demand-pull inflation than it is cost-push inflation. Use
the aggregate demand and aggregate supply model to explain this assertion.
43. Examine the effect the following events would have on either aggregate supply or aggregate demand.
44. How would the following developments affect aggregate demand or aggregate supply?
(a) A reduction in personal income taxes.
(b) More funding for research and development in new technologies.
(c) An increase in business subsidies.

45. Suppose an economic advisor to the President recommended a personal income tax increase. Indicate the
expected effects on aggregate demand and on aggregate supply.
46. Use an aggregate demand–aggregate supply analysis to explain the impact of the public’s expectations of
severe inflation on real domestic output and the price level.
47. How can an economy achieve full employment without igniting inflation?
48. (Last Word) Explain the Great Recession in terms of aggregate demand, before the recession and after the
recession.

49. (Last Word) Discuss the explanations economists give for the slow recovery after the Great Recession.
C. Appendix Questions
50. How can the aggregate demand curve be derived from the aggregate expenditures model?
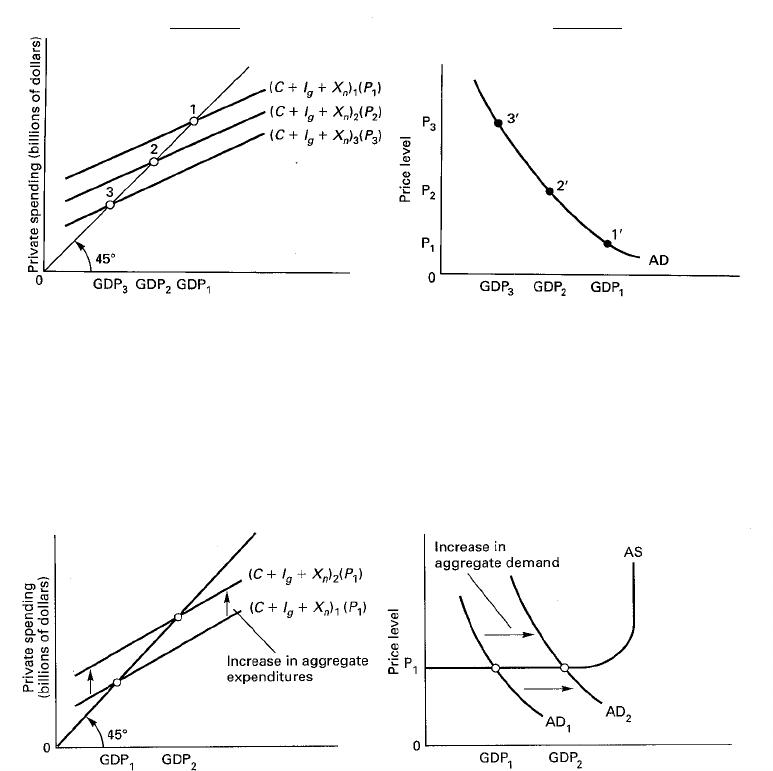
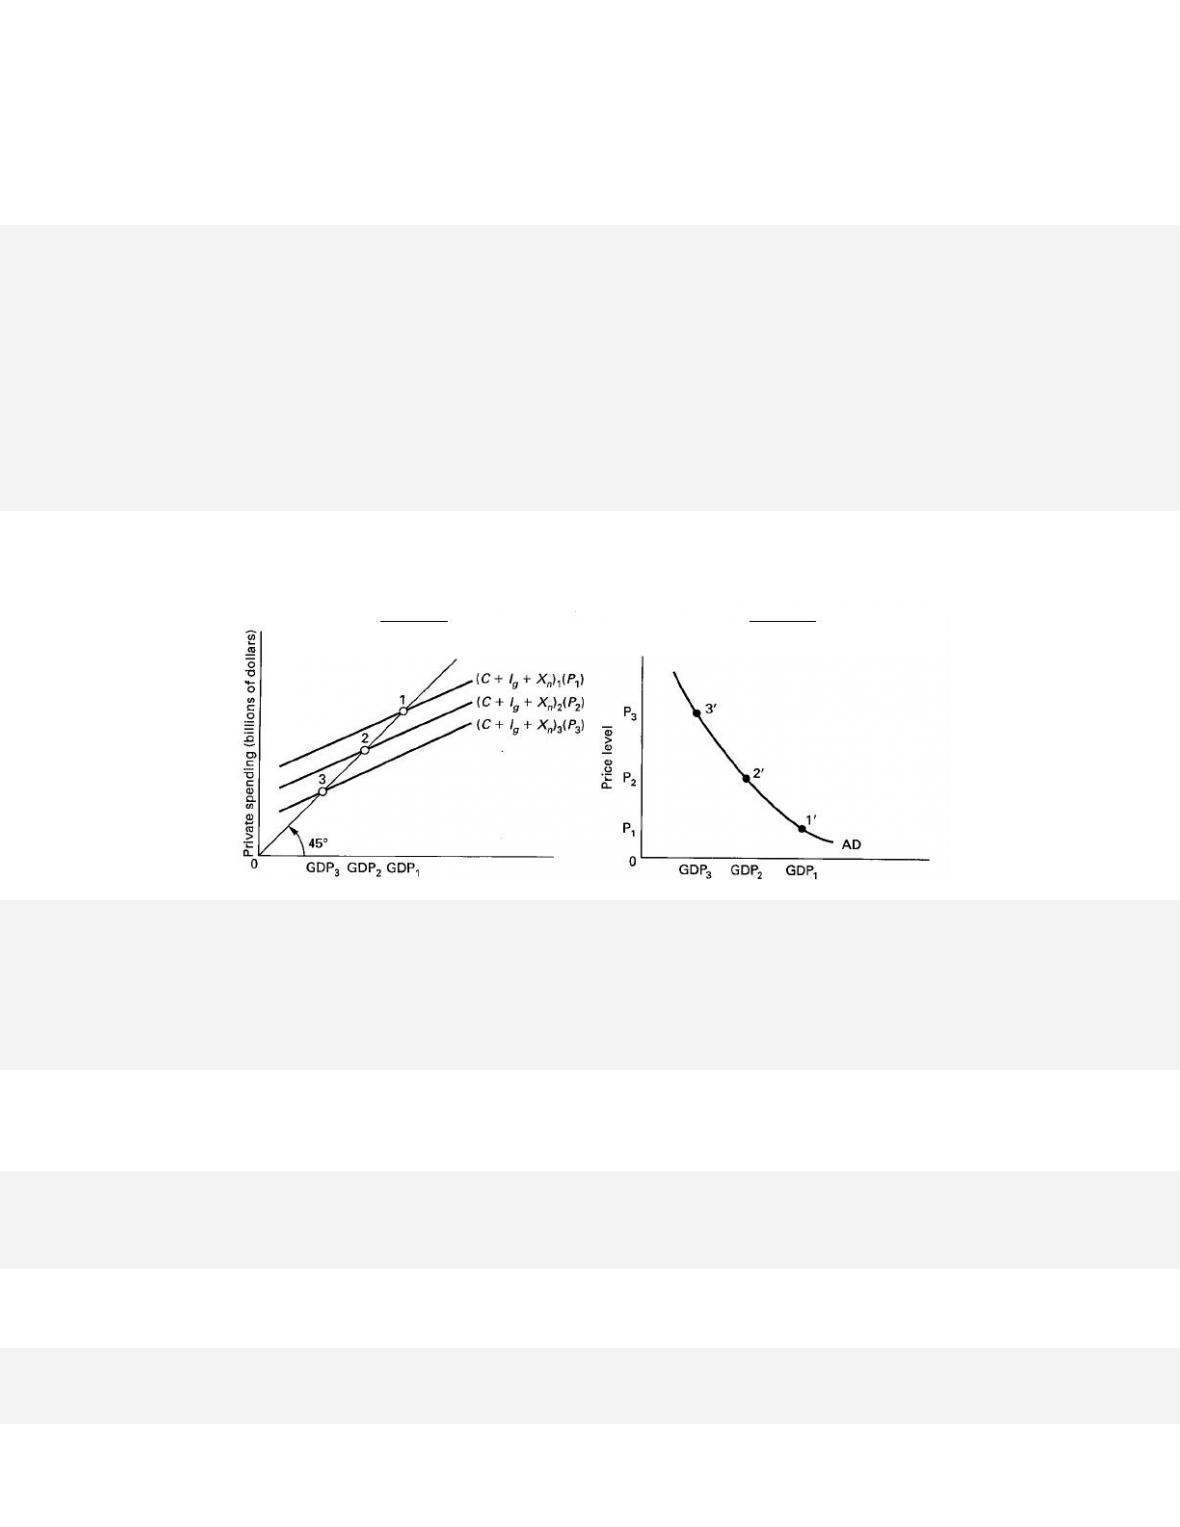
51. Explain the relationship between the aggregate expenditures model in graph (A) below and the aggregate
demand–aggregate supply model in graph (B) below. In other words, explain how points 1, 2, and 3 are
related to points 1’, 2’, and 3’.
52. How does the aggregate expenditures analysis differ from the aggregate demand–aggregate supply
analysis?
53. Why does aggregate demand shift outward by a greater amount than the initial change in spending?
54. Explain the relationship between the aggregate expenditures model in graph (A) below and the aggregate
demand–aggregate supply model in graph (B) below where aggregate demand is shifting while the price
level remains constant.
(A) (B)
Graph A
Graph B
D. Answers to Appendix Questions
50. How can the aggregate demand curve be derived from the aggregate expenditures model?
51. Explain the relationship between the aggregate expenditures model in graph (A) below and the aggregate
demand–aggregate supply model in graph (B) below. In other words, explain how points 1, 2, and 3 are
related to points 1’, 2’, and 3’.
52. How does the aggregate expenditures analysis differ from the aggregate demand–aggregate supply
analysis?
53. Why does aggregate demand shift outward by a greater amount than the initial change in spending?
Graph A
Graph B
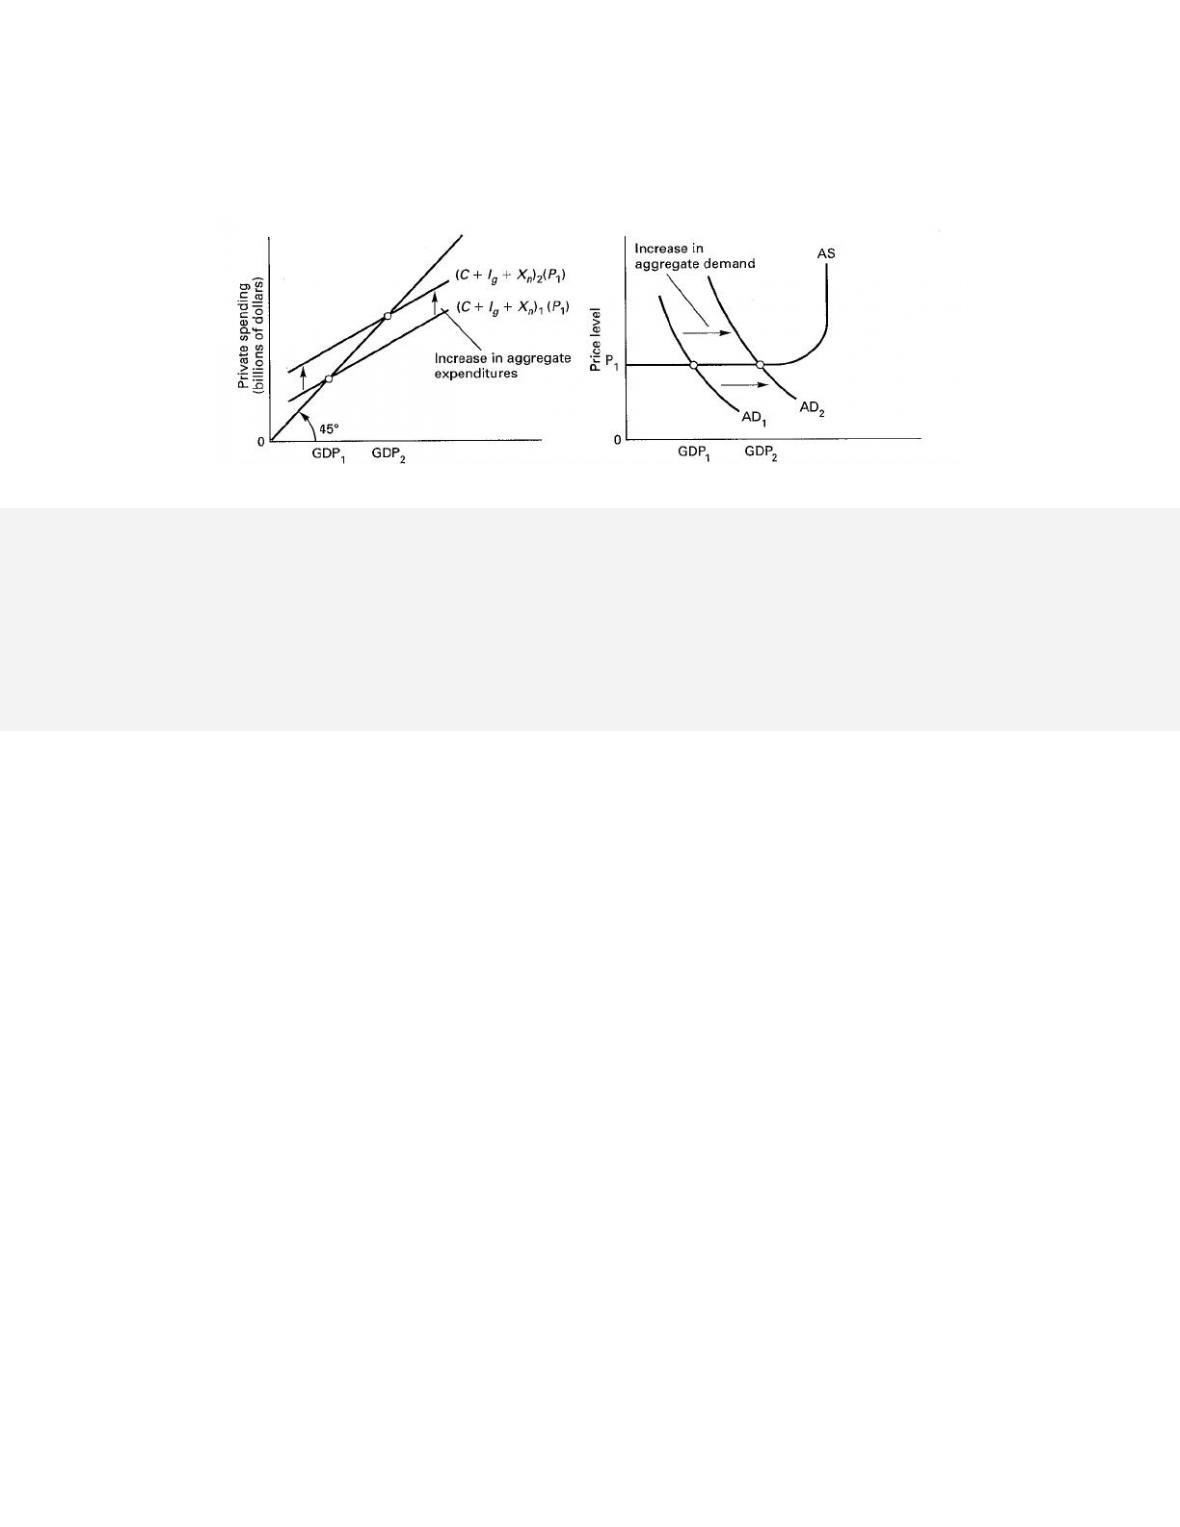
54. Explain the relationship between the aggregate expenditures model in graph (A) below and the aggregate
demand–aggregate supply model in graph (B) below where aggregate demand is shifting while the price
level remains constant.
(A) (B)