
23. How could the omission of net exports from GDP overstate production? Or understate it?
24. The data in the first two columns below are for a private closed economy. Use this table to answer the
following questions.
Real GDP
= DI
(billions)
Aggregate
expenditures
(billions)
Exports
(billions)
Imports
(billions)
Net
exports
(billions)
Aggregate
expenditures
(billions)
$100
$120
$10
$15
$_____
$_____
125
140
10
15
_____
_____
150
160
10
15
_____
_____
175
180
10
15
_____
_____
200
200
10
15
_____
_____
225
220
10
15
_____
_____
250
240
10
15
_____
_____
275
260
10
15
_____
_____
(a) What is the equilibrium GDP for the private closed economy?
(b) Including the international trade figures for exports and imports, calculate net exports and determine
the equilibrium GDP for a private open economy.
(c) What will happen to equilibrium GDP if exports were $5 billion larger at each level of GDP?
(d) What will happen to equilibrium GDP if exports remained at $10 billion, but imports dropped to $5
billion?
(e) What is the size of the multiplier in this economy?
Aggregate
Aggregate
$120
$115

25. The data in the first two columns below are for a private closed economy. Use this table to answer the
following questions.
Real GDP
= DI
(billions)
Aggregate
expenditures
(billions)
Exports
(billions)
Imports
(billions)
Net
exports
(billions)
Aggregate
expenditures
(billions)
$ 80
$100
$15
$5
$_____
$_____
120
130
15
5
_____
_____
160
160
15
5
_____
_____
200
190
15
5
_____
_____
240
220
15
5
_____
_____
280
250
15
5
_____
_____
320
280
15
5
_____
_____
360
310
15
5
_____
_____
(a) What is the equilibrium GDP for the private closed economy?
(b) Including the international trade figures for exports and imports, calculate net exports and determine
the equilibrium GDP for a private open economy.
(c) What will happen to equilibrium GDP if exports were $10 billion larger at each level of GDP?
(d) What will happen to equilibrium GDP if exports remained at $15 billion, but imports rose to $15
billion?
(e) What is the size of the multiplier in this economy?
= DI
(billions)
Aggregate
expenditures
(billions)
Exports
(billions)
Imports
(billions)
Net
exports
(billions)
Aggregate
expenditures
(billions)
$ 80
$100
$5
$10
$110
120
15
5
160
15
5
200
15
5
240
15
5
280
15
5
320
15
5
360
15
5


28. Describe how a sustained depreciation of the U.S. dollar over time is likely to affect U.S. net exports.
29. How will a sustained appreciation of the U.S. dollar over time likely affect U.S. net exports?
30. Assume that the United States raises tariffs on products imported from other countries. What effect will
this U.S. trade policy have in the short run if other nations do not change their policy? What effect will this
policy have in the long run if other nations retaliate?
31. Why will using currency devaluations and imposing tariffs be counterproductive to pull the United States
out of a recession?
32. Describe the probable impact of an increase in government spending assuming no change in taxes or
private spending and less than full-employment output.
33. Identify the relationship between GDP, taxes, and disposable income.

34. “If taxes and government spending are increased by the same amount, there will still be a positive effect on
equilibrium GDP.” Explain.
35. Why don’t identical shifts in government spending and taxes have the same effect on GDP?
36. With the additional leakages of imports and taxes in additional to savings in a public, open economy, how
is the economy still able to reach equilibrium?
37. Compare and contrast the recessionary expenditure gap and the inflationary expenditure gap.
38. If there is a recessionary expenditure gap of $100 billion and the MPC is 0.80, by how much must taxes be
reduced to eliminate the recessionary expenditure gap?

31–630
39. Assume the level of investment is $8 billion and independent of the level of total output. Complete the
following table and determine the equilibrium level of output and income which the private sector of this
closed economy would provide.
Possible employment
levels (millions)
Real GDP = DI
(billions)
Consumption
(billions)
Saving
(billions)
80
$120
$122
$_____
90
130
130
_____
100
140
138
_____
110
150
146
_____
120
160
154
_____
130
170
162
_____
140
180
170
_____
150
190
178
_____
160
200
186
_____
(a) If this economy has a labor force of 140 million, will there be a recessionary or inflationary
expenditure gap? Explain the consequences of this gap.
(b) If the labor force is 110 million, will there be an inflationary or recessionary expenditure gap? Explain
the consequences of this gap.
(c) What are the sizes of the MPC, MPS, and multiplier in this economy?
(d) Using the multiplier concept, give the increase in equilibrium GDP that would occur if the level of
investment increased from $8 billion to $10 billion.
Possible employment
levels (millions)
Real GDP = DI
(billions)
Consumption
(billions)
Saving
(billions)
80
$120
$122
$ 2
90
130
130
0
100
140
138
2
110
150
146
4
120
160
154
6
130
170
162
8
140
180
170
10
150
190
178
12
160
200
186
14
(a) At the 140-million employment level, aggregate expenditures will be $178 billion and output will be
$180 billion. Therefore, there exists a recessionary expenditure gap of $2 billion. Producers plan
output to match anticipated aggregate expenditures. If expenditures fall below this level of $180
billion, then producer inventories will be greater than planned and they will reduce output until the
actual inventories equal planned inventories for that level of output.
(b) At the 110-million employment level, aggregate expenditures will be $154 billion and output will be
$150 billion. An inflationary expenditure gap exists because aggregate expenditures exceed full–
employment output and producers will attempt to expand output thinking full employment has not
been reached. Expansion takes place because the level of planned output was set to match anticipated
spending. Since aggregate spending exceeded this level of $150 billion, producer inventories will be
lower than planned and they will increase output to replenish these inventories.
(c) Consumption changes by $8 billion for every $10 billion change in DI. Therefore, the MPC is
8/10 or 0.8. MPS = 0.2. Multiplier will be 1/.2 = 5.
(d) If investment spending rises by $2 billion, then equilibrium GDP should rise by 5 $2 billion or $10
billion.

31–631
40. Assume the level of investment is $8 billion and independent of the level of total output. Complete the
following table and determine the equilibrium level of output and income which the private sector of this
closed economy would provide.
Possible employment
levels (millions)
Real GDP = DI
(billions)
Consumption
(billions)
Saving
(billions)
50
$ 80
$ 83
$_____
60
90
90
_____
70
100
97
_____
80
110
104
_____
90
120
111
_____
100
130
118
_____
110
140
125
_____
120
150
132
_____
130
160
139
_____
(a) If this economy has a labor force of 110 million, will there be a recessionary or inflationary
expenditure gap? Explain the consequences of this gap.
(b) If the labor force is 80 million, will there be an inflationary or recessionary expenditure gap? Explain
the consequences of this gap.
(c) What are the sizes of the MPC, MPS, and multiplier in this economy?
(d) Using the multiplier concept, give the increase in equilibrium GDP that would occur if the level of
investment increased from $8 billion to $10 billion.
Possible employment
levels (millions)
Real GDP = DI
(billions)
Consumption
(billions)
Saving
(billions)
50
$ 80
$ 83
$ 3
60
90
90
0
70
100
97
3
80
110
104
6
90
120
111
9
100
130
118
12
110
140
125
15
120
150
132
18
30
160
139
21
(a) At the 110-million employment level, aggregate expenditures will be $132 billion and full-
employment output will be $140 billion. Therefore, there exists a recessionary expenditure gap of $7
billion. Producers plan output to match anticipated aggregate expenditures. If expenditures fall below
this level of $140 billion, then producer inventories will be greater than planned and they will reduce
output until the actual inventories equal planned inventories for that level of output.
(b) At the 80-million employment level, aggregate expenditures will be $112 billion and full-employment
output will be $110 billion. An inflationary expenditure gap exists because aggregate expenditures
exceed full-employment output and producers will attempt to expand output thinking full employment
has not been reached. Expansion takes place because the level of planned output was set to match
anticipated spending. Since aggregate spending exceeded this level of $110 billion, producer
inventories will be lower than planned and they will increase output to replenish these inventories.
(c) Consumption changes by $7 billion for every $10 billion change in DI. Therefore, the MPC is
7/10 or 0.7. MPS = 0.3, multiplier will be 1/.3 = 3 1/3.
(d) If investment spending rises by $2 billion, then equilibrium GDP should rise by 3 1/3 $2 billion or $6
2/3 billion.

41. Refer to the following table to answer the questions.
(1)
Possible levels of
employment,
millions
(2)
Real domestic
output,
billions
(3)
Aggregate expenditures
(Ca + Ig + Xn + G),
billions
45
$250
$260
50
275
280
55
300
300
60
325
320
65
350
340
(a) If full employment in this economy is 65 million, will there be an inflationary or recessionary
expenditure gap? What will be the consequence of this gap? By how much would aggregate
expenditures in column 3 have to change at each level of GDP to eliminate the inflationary or
recessionary expenditure gap? Explain.
(b) Will there be an inflationary or recessionary expenditure gap if the full-employment level of output is
$250 billion? Explain the consequences. By how much would aggregate expenditures in column 3
have to change at each level of GDP to eliminate the inflationary or recessionary expenditure gap?
Explain.
(c) Assuming that investment, net exports, and government expenditures do not change with changes in
real GDP, what are the sizes of the MPC, the MPS, and the multiplier?
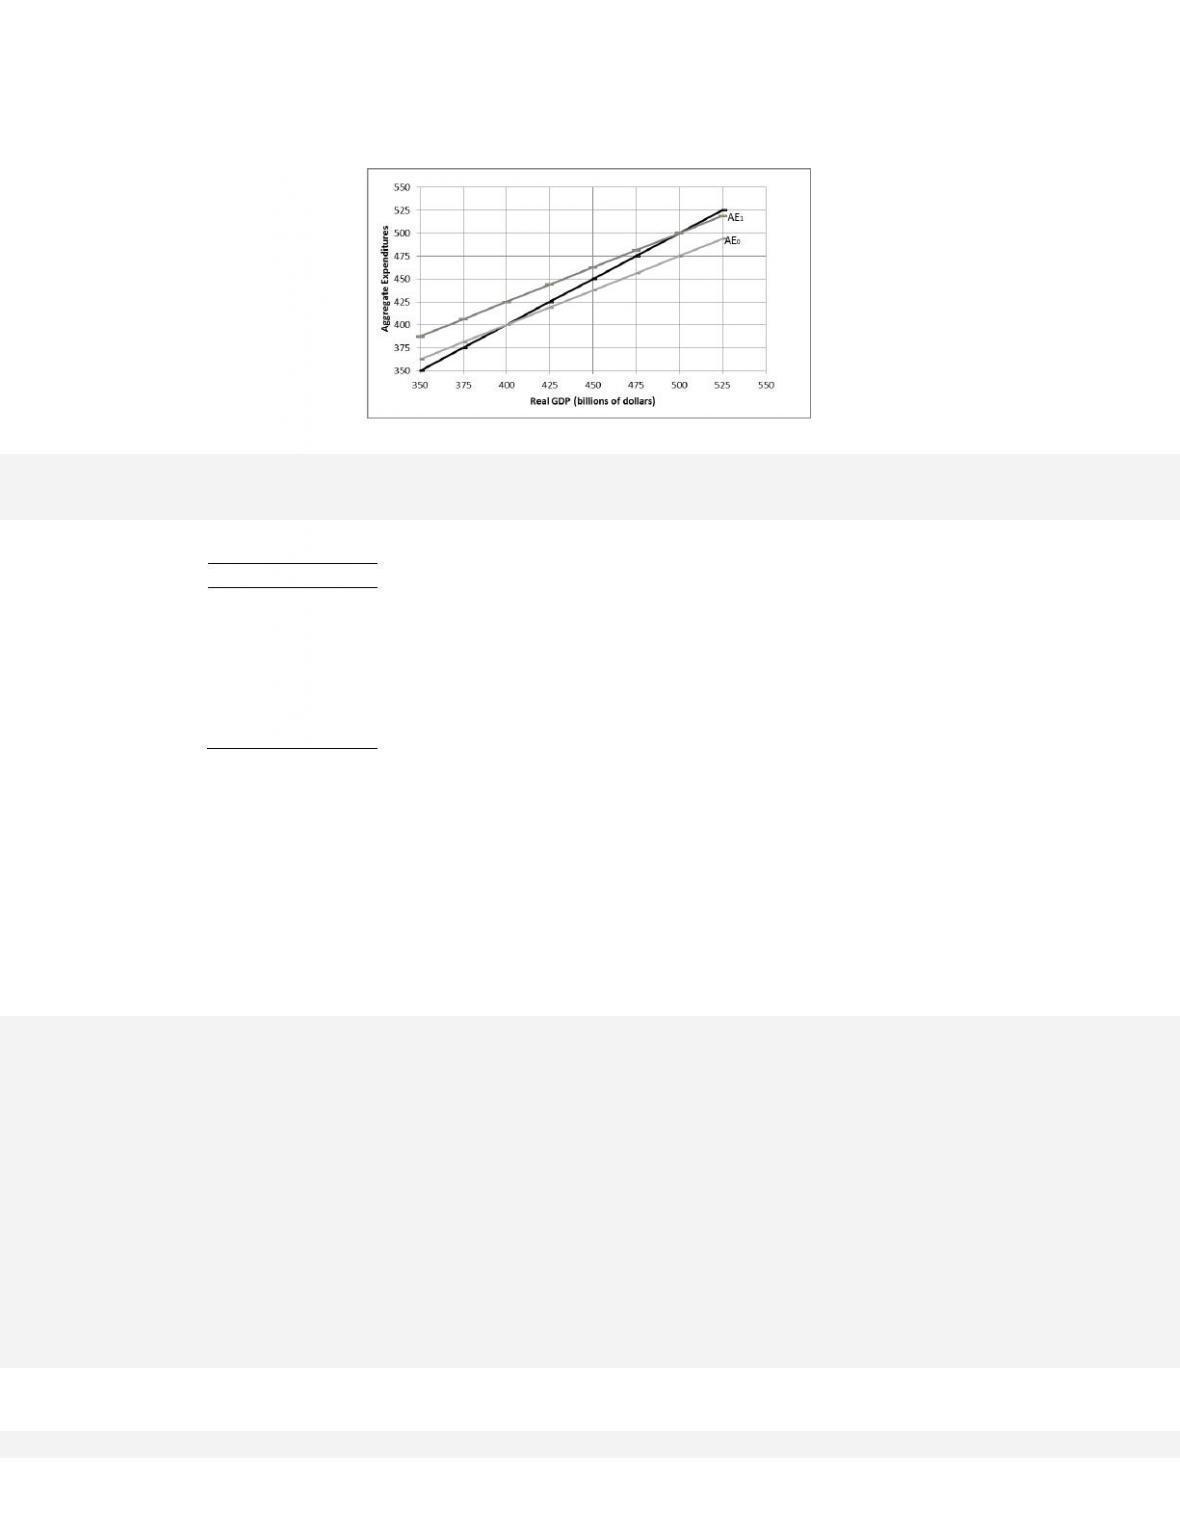
42. Use the graph below to explain the recessionary expenditure gap.
31–633
43. Use the graph below to explain the inflationary expenditure gap.
44. Use the table below to answer the following questions.
Real GDP
C
$500
$495
510
504
520
513
530
522
540
531
550
540
560
549
(a) What is the size of the multiplier in this economy?
(b) If taxes were zero, government purchases were $5, investment is $3, and net exports are zero, what is
the equilibrium GDP?
(c) If taxes are $10, government purchases are $10, investment is $6, and net exports are zero, what is the
equilibrium GDP?
(d) Assume investment is $50, taxes are $50, and net exports and government purchases are each zero.
The full-employment level of GDP is $545. How much of a reduction in taxes is needed to eliminate
the recessionary expenditure gap?
(e) Assume that investment, net exports, and taxes are zero. Government purchases are $30 and the full–
employment GDP without inflation is $530. By how much must government spending be reduced to
eliminate the inflationary expenditure gap?

31–634
45. Use the table below to answer the following questions.
Real GDP
C
$300
$290
310
298
320
306
330
314
340
322
350
330
360
338
(a) What is the size of the multiplier in this economy?
(b) If taxes were zero, government purchases were $10, investment $6, and net exports are zero, what is
the equilibrium GDP?
(c) If taxes are $5, government purchases are $10, investment is $6, and net exports are zero, what is the
equilibrium GDP?
(d) Assume investment is $50, taxes are $50, net exports and government purchases are each zero. The
full-employment level of GDP is $340. How much of a reduction in taxes is needed to eliminate the
recessionary expenditure gap?
(e) Assume that investment, net exports, and taxes are zero. Government purchases are $30 and the full–
employment GDP without inflation is $330. By how much must government spending be reduced to
eliminate the inflationary expenditure gap?
46. If there is an inflationary expenditure gap of $80 billion and the MPC is 0.75, by a) how much should
government expenditure (G) change it to reduce the gap? b) By how much should taxes (T) change? (c)
Why are the changes in G and T different?

31–635
47. What two solutions did Keynes suggest as appropriate government policies in order to close a recessionary
gap? Does the assumption of stuck prices hold true when the economy moves close to its potential output?
Explain.
48. Explain how the recession of 2007–2009 in the United States provides an example of a recessionary
expenditure gap.
49. (Advanced analysis) Suppose that the linear equation for consumption in a hypothetical economy is C = 50
+ 0.9 Y. Also suppose that income (Y) is $400. Determine the following: (a) MPC; (b) MPS; (c) level of
consumption; (d) APC; (e) APS.
50. (Advanced analysis) Assume the following output-income and saving data for the private sector of the
economy.
Real GDP (Y)
Consumption (C)
$240
$244
260
260
280
276
300
292
320
308
340
324
360
340
380
356
400
372
(a) Describe the consumption schedule in equation form.
(b) Assuming net investment is $5 billion and independent of the level of GDP, what will be the
equilibrium level of GDP?
(c) Assuming net investment of $15 billion and independent of the level of GDP, what will be the
equilibrium level of GDP?
(d) Using your answers to (a) and (b), find the size of the multiplier.
(e) Check your answer using the MPC embodied in these data.

31–636
51. (Advanced analysis) Assume the consumption schedule for the economy is such that C = 50 + 0.8Y.
Assume further that investment and net exports are autonomous or independent of the level of income and
gross investment is 40 and net exports equal −10. Recall that in equilibrium, Y = C + Ig + Xn.
(a) Calculate the equilibrium level of income for this economy.
(b) What will happen to equilibrium Y if gross investment falls to 20? What does this tell us about the size
of the multiplier?
52. (Advanced analysis) Assume that without any taxes the consumption schedule for an economy is as shown
in the table.
GDP (billions)
Consumption
(billions)
$ 200
$ 240
400
400
600
560
800
720
1000
880
1200
1040
1400
1200
(a) Graph the consumption schedule and note the size of the MPC and multiplier using the below graph.
(b) Assume a lump-sum regressive tax of $10 billion is imposed at all levels of GDP. Calculate the tax
rate at each level of GDP and graph the resulting consumption schedule. Compare the MPC and the
multiplier with the pretax consumption schedule. MPC and the multiplier are unchanged.
(c) Explain why a proportional or progressive tax system would contribute to greater economic stability as
compared with the regressive lump-sum tax. Demonstrate graphically using a 10% proportional tax.

31–637
53. (Last Word) Explain Say’s law.
54. (Last Word) “If production results in income and income is the source of spending, it would seem that the
production of a full-employment economy would automatically guarantee enough spending to sustain itself.
How, then, can unemployment occur?” Explain.
55. (Last Word) What two events undermined the theory that supply creates its own demand?
56. (Last Word) Contrast the classical and Keynesian views of unemployment.