
17. List four factors that could shift the consumption schedule.
Shifts in the consumption schedule could be caused by any of the nonincome determinants of consumption
and saving. This includes changes in any of the following: wealth, expectations, real interest rates, and
18. Define wealth. What is the effect of increase in wealth on the consumption and saving schedules?
19. How does increased household borrowing affect present and future consumption?
20. How do expectations about future income effect current and future spending?
21.The expected rate of return is a guaranteed rate of return on an investment. Evaluate.
22. Suppose that real interest rates increase. What would be the likely effect on household consumption and
saving?
23. Discuss and show graphically how an increase in consumption at each level of GDP effects saving.
Typically if a household consumes more at each level of real GDP, they are saving less. A downward shift

24. Other things being constant, what will be the effect of each of the following on disposable income (or real
GDP)?
(a) An increase in the amount of liquid assets consumers are holding
(b) A sharp rise in stock prices
(c) A rapid upsurge in the rate of technological advance
(d) A sharp increase in the real interest rate
25. Other things being constant, what will be the effect of each of the following on consumption and saving
schedules?
(a) Credit card companies increase the interest-free periods on their cards to compete for customers.
(b) Concern grows over rising prices.
(c) A weakening of the housing market lowers home values.
(d) Real interest rates fall.
(e) Congress officially approves the President’s plan for tax cuts.
26. Explain the difference between a movement along the consumption schedule and a shift in the consumption
schedule.

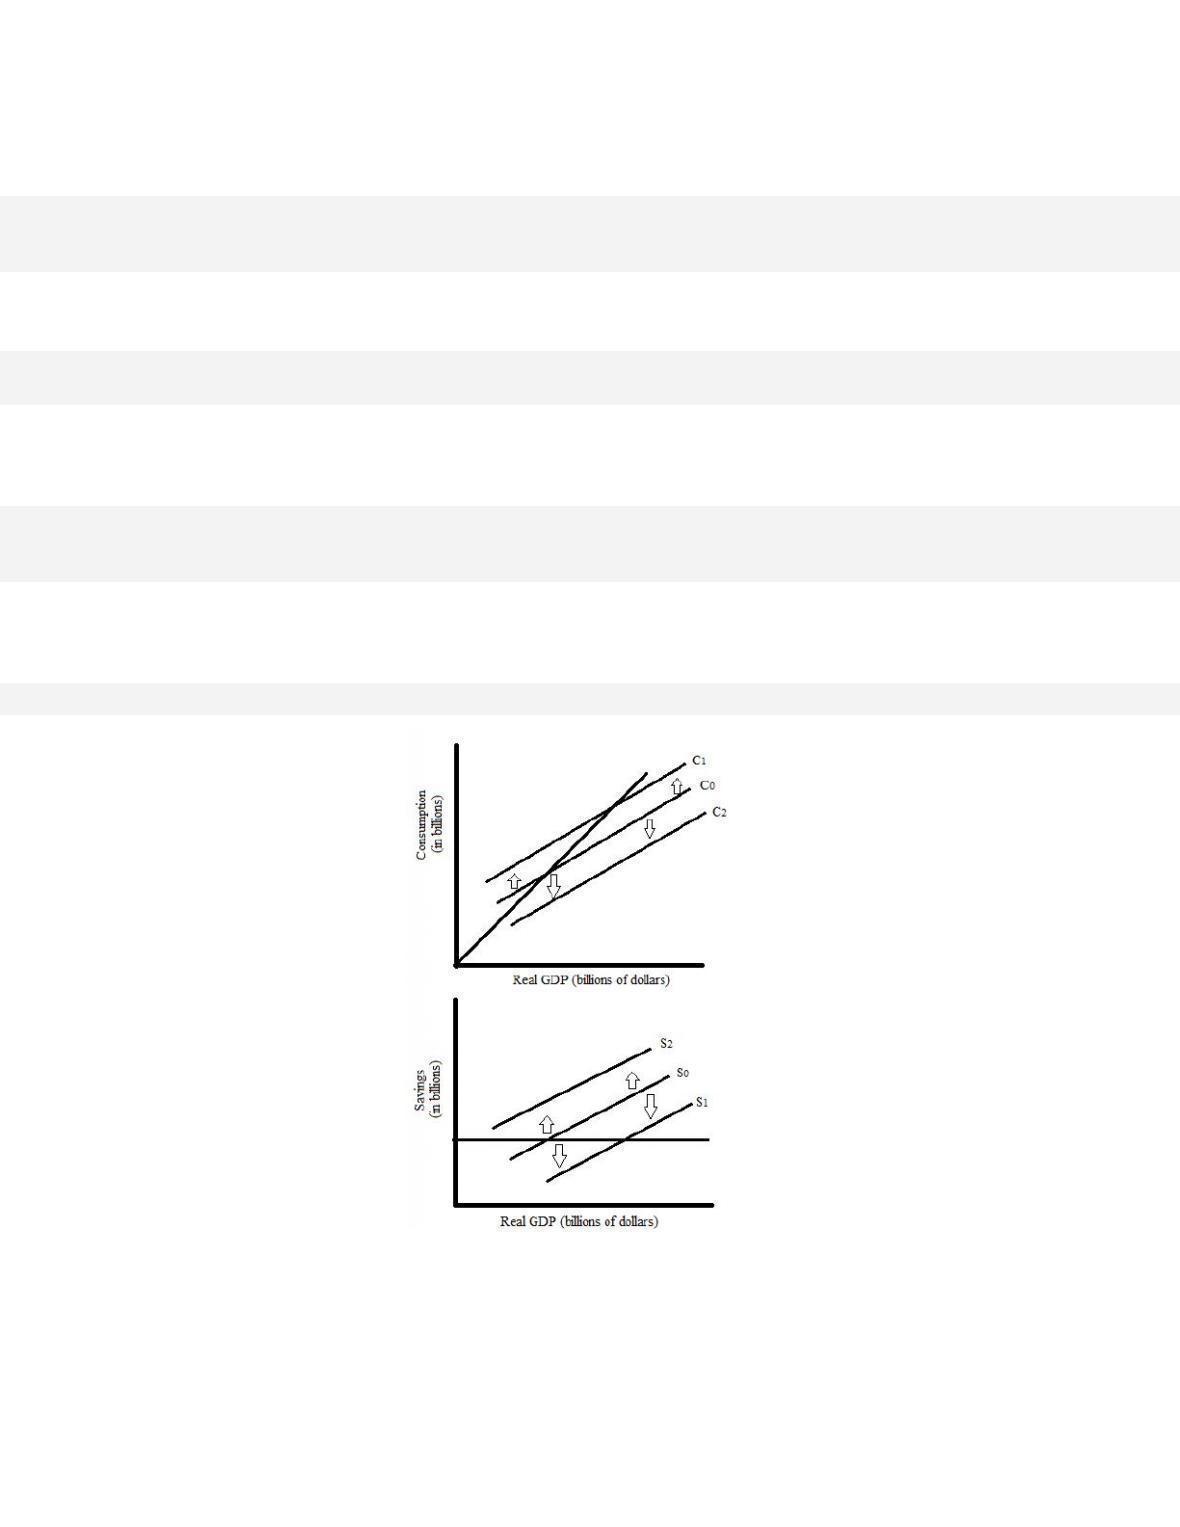
27. Use the graphs below to answer the following questions:
(a) What types of schedules do graphs A and B represent?
(b) If in graph A line A2 shifts to A3 because households consume more and this change is not due to
changing taxes, then in graph B, what would happen to line B2?
(c) If in graph B, line B2 shifts to B1 because households save less, then in graph A, what will happen to
line A2?
(d) In graph A, what has caused the movement from point A to point B on line A2?
(e) If there is a lump-sum tax increase causing line A2 to shift to A1, then in graph B, what will happen to
B2?
28. (Consider This) Use the Great Recession of 2007–2009 to describe the paradox of thrift.
29. Describe the relationship shown by the investment demand curve.

30. Consider the following investment situations.
(a) A local bookseller is considering expanding store space to increase his capacity for books. The rent for
the additional space would cost $3000 per year. The bookseller predicts that the added space will pull
in an additional profit of $4000 per year. The current interest rate is 12%. Should the bookseller
invest in the extra space?
(b) A baker is considering expanding her business by adding an additional oven to her kitchen. The new
oven would cost $700. The baker expects the new oven to bring in additional profits of $800. The
baker can borrow at a nominal interest rate of 15% and the current inflation rate is 4%. Should she
make the investment?
(c) A mechanic is considering expanding his garage. After a strong year last year, the mechanic is able to
finance the expansion from last year’s profits. The expansion itself is expected to cost $11,000. The
mechanic estimates that the additional garage will bring in revenue totaling $12,000. The mechanic is
currently receiving an interest rate of 8% on his saved profits. Should he make the investment?
31. Use the following data to answer the questions.
Expected rate
of return
Cumulative amount
of investment
(billions)
11%
$ 55
10
75
8
90
5
105
3
150
1
190
(a) Explain why this table is essentially an investment demand schedule.
(b) If the interest rate was 8%, how much investment would be undertaken?
(c) Why is there an inverse relationship between the rate of interest and the amount of investment?
32. What is the investment demand curve?

33. List six events that could cause a shift in the investment demand curve.
34. How will the following situations affect the investment demand curve?
(a) A new type of engine is developed that is more fuel efficient.
(b) To lessen the fiscal deficit, Congress increases corporate taxes.
(c) Unplanned inventories rise to new highs.
(d) A firm decides to increase its current inventory levels.
35. Contrast planned and unplanned inventory changes. What effect do these changes have on the investment
demand curve?
36. State four factors that explain why investment spending tends to be unstable.
Investment spending is based to a large extent on expectations about future profitability and this can vary
significantly from period to period. Technological changes affect investment spending and these changes

37. Which is the most volatile component of total spending? What four factors contribute to the volatility of
this component of total spending?
38. Compare the determinants of consumption with investment. Most economists regard investment as being
less stable than consumption. Looking at the determinants of each factor, support this contention.
The nonincome determinants of the consumption schedule are consumer wealth, expectations, real interest
rates, household borrowing, and taxation. The determinants of investment are price of investment goods
39. Discuss how investment, a percentage of GDP, varies across countries.

40. (Consider This) Why did the lowering of real interest rates during the Great Recession not boost investment
spending?
41. Whenever there is change in spending real GDP will change by a multiple of the initial change in spending.
Explain this multiplier effect.
42. Define the multiplier. How is it related to real GDP and the initial change in spending? How can the
multiplier have a negative effect?
43. What are two key facts that serve as the rationale for the multiplier effect?
44. Explain the economic impact of an increase in the multiplier.

45. Consider the effect of the following on the multiplier.
(a) As a recession ends and recovery begins consumers are feeling less cautious about spending.
(b) As the economy moves into an expansion, spending increases.
(c) Uncertainty about national security and political relations abroad causes the public to adjust by saving
more to use in case of an economic downturn worldwide.
46. What is the relationship between the multiplier and the marginal propensities?
47. Describe the relationship between the size of the MPC and the multiplier. How does it compare to the
relationship between the size of the MPS and the multiplier?
48. Calculate the multiplier when the MPC is .5, .75, .90. What is the relationship between MPC and the
multiplier?
49. Calculate the multiplier when the MPS is .5, .25, .10. What is the relationship between MPS and the
multiplier?
50. How large is the actual multiplier?

51. (Last Word) Describe the events “Squaring the Economic Circle” and explain how they illustrate the
multiplier.
Humorist Art Buchwald illustrates the multiplier with this funny essay that shows how the effect of one
economic event on one party has an effect on a second party. These effects on the second party, in turn,
have an effect on a third party, and so forth, creating a ripple throughout the economy. These related and