
CHAPTER 30
Basic Macroeconomic Relationships
A. Short-Answer, Essays, and Problems
1. What are the relationships among consumption, saving, and disposable income?
2. Define the consumption schedule.
3. Describe the saving schedule.
4. Explain how consumption and saving are related to disposable income in the aggregate expenditures model.
5. Fill in the table below. Describe your result.
Disposable Income
Consumption
Saving
$200
$210
$_____
$_____
$220
$0
$_____
$230
$10
$260
$_____
$20
$280
$_____
$30
$300
$260
$_____
6. Complete the following table assuming that (a) MPS = 1/5, (b) there is no government and all saving is
personal saving.
Level of output
and income
Consumption
Saving
$250
$260
$_____
275
_____
_____
300
_____
_____
325
_____
_____
350
_____
_____
375
_____
_____
400
_____
_____
7. Complete the following table assuming that (a) MPS = 1/3, (b) there is no government and all saving is
personal saving.
Level of output
and income
Consumption
Saving
$100
$120
$_____
130
_____
_____
160
_____
_____
190
_____
_____
220
_____
_____
250
_____
_____
8. Differentiate between the average propensity to consume and the marginal propensity to consume.
9. What are the marginal propensity to consume (MPC) and marginal propensity to save (MPS)? How are the
two concepts related? How are the two concepts related to the consumption and saving functions?

10. If you know the marginal propensity to consume you can determine the marginal propensity to save. How
is that possible?
11. If you know the average propensity to consume you can determine the average propensity to save. How is
that possible?
12. Suppose a family’s annual disposable income is $8000 of which it saves $2000.
(a) What is their APC?
(b) If their income rises to $10,000 and they plan to save $2800, what are their MPS and MPC?
(c) Did the family’s APC rise or fall with their increase in income?
13. Suppose a family’s annual disposable income is $10,000 of which it saves $2,500.
(a) What is their APC?
(b) If income falls to $8,000 and they plan to save $1500, what are MPS and MPC?
(c) Did the family’s APC rise or fall with their decrease in income?
14. How does the average propensity to consume (APC) in the United States compare to other advanced
countries?
15. Complete the accompanying table.
Level of output
and income
(GDP = DI)
Consumption
Saving
APC
APS
MPC
MPS
$100
$_____
−$5
_____
_____
_____
_____
125
_____
0
_____
_____
_____
_____
150
_____
5
_____
_____
_____
_____
175
_____
10
_____
_____
_____
_____
200
_____
15
_____
_____
_____
_____
225
_____
20
_____
_____
_____
_____
250
_____
25
_____
_____
_____
_____
275
_____
30
_____
_____
_____
_____
300
_____
35
_____
_____
_____
_____
(a) What is the break-even level of income? How is it possible for households to dissave at very low
income levels?
(b) If the proportion of total income consumed decreases and the proportion saved increases as income
rises, explain how the MPC and MPS can be constant at various levels of income.
16. Complete the accompanying table.
Level of output
and income
(GDP = DI)
Consumption
Saving
APC
APS
MPC
MPS
$480
$_____
−$8
_____
_____
_____
_____
520
_____
0
_____
_____
_____
_____
560
_____
8
_____
_____
_____
_____
600
_____
16
_____
_____
_____
_____
640
_____
24
_____
_____
_____
_____
680
_____
32
_____
_____
_____
_____
720
_____
40
_____
_____
_____
_____
760
_____
48
_____
_____
_____
_____
800
_____
56
_____
_____
_____
_____
(a) Using the below graphs, show the consumption and saving schedules graphically.
(b) Locate the break-even level of income. How is it possible for households to dissave at very low
income levels?
(c) If the proportion of total income consumed decreases and the proportion saved increases as income
rises, explain both verbally and graphically how the MPC and MPS can be constant at various levels of
income.
17. List four factors that could shift the consumption schedule.
18. Define wealth. What is the effect of increase in wealth on the consumption and saving schedules?
19. How does increased household borrowing affect present and future consumption?
20. How do expectations about future income effect current and future spending?
22. Suppose that real interest rates increase. What would be the likely effect on household consumption and
saving?
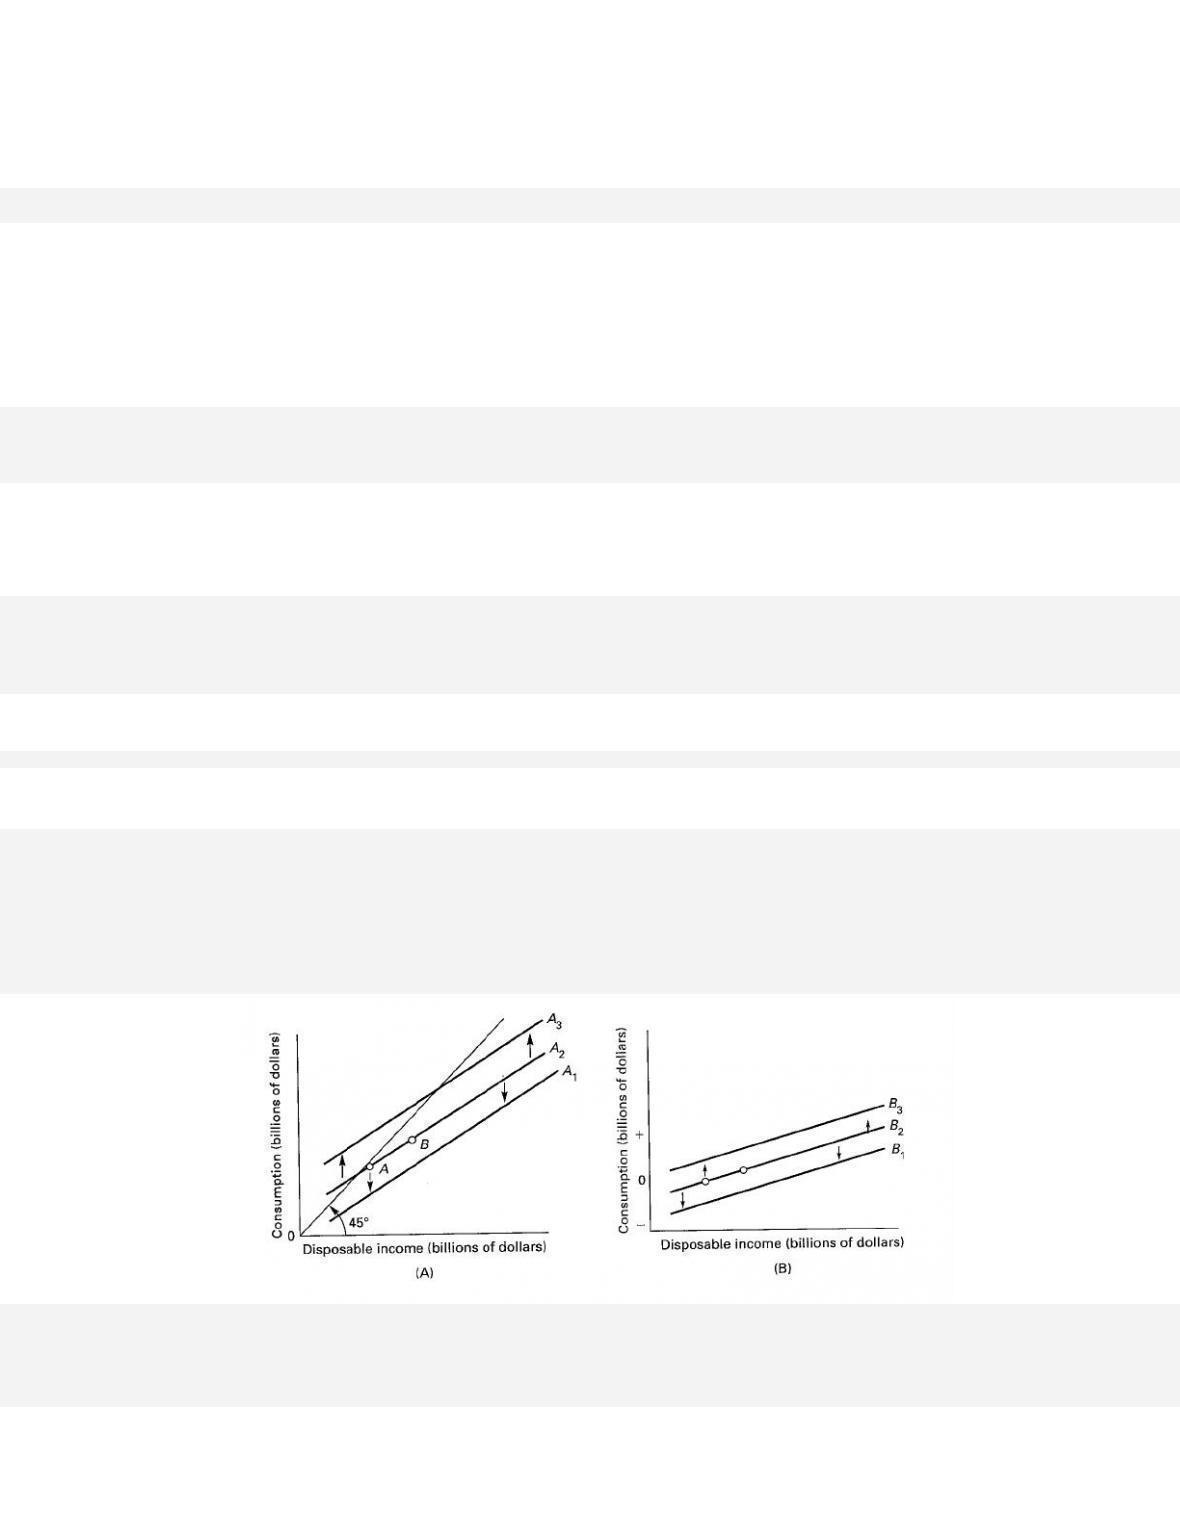
23. Discuss and show graphically how an increase in consumption at each level of GDP effects saving.
24. Other things being constant, what will be the effect of each of the following on disposable income (or
GDP)?
25. Other things being constant, what will be the effect of each of the following on consumption and saving
schedules?
26. Explain the difference between a movement along the consumption schedule and a shift in the consumption
27. Use the graphs below to answer the following questions:

30. Consider the following investment situations.
31. Use the following data to answer the questions.
Expected rate
of return
Cumulative amount
of investment
(billions)
11%
$ 55
10
75
8
90
5
105
3
150
1
190
32. What is the investment demand curve?
33. List six events that could cause a shift in the investment demand curve.
34. How will the following situations affect the investment demand curve?
35. Contrast planned and unplanned inventory changes. What effect do these changes have on the investment
36. State four factors that explain why investment spending tends to be unstable.
37. Which is the most volatile component of total spending? What four factors contribute to the volatility of
38. Compare the determinants of consumption with investment. Most economists regard investment as being
39. Discuss how investment, a percentage of GDP, varies across countries.
40. (Consider This) Why did the lowering of real interest rates during the Great Recession not boost
investment spending?
41. Whenever there is change in spending real GDP will change by a multiple of the initial change in spending.

42. Define the multiplier. How is it related to real GDP and the initial change in spending? How can the
multiplier have a negative effect?
43. What are two key facts that serve as the rationale for the multiplier effect?
44. Explain the economic impact of an increase in the multiplier.
45. Consider the effect of the following on the multiplier.
46. What is the relationship between the multiplier and the marginal propensities?
47. Describe the relationship between the size of the MPC and the multiplier. How does it compare to the
relationship between the size of the MPS and the multiplier?
48. Calculate the multiplier when the MPC is .5, .75, .90. What is the relationship between MPC and the
multiplier?
49. Calculate the multiplier when the MPS is .5, .25, .10. What is the relationship between MPS and the
multiplier?
50. How large is the actual multiplier?

B. Answers to Short-Answer, Essays, and Problems
1. What are the relationships among consumption, saving, and disposable income?
2. Describe the consumption schedule.
3. Describe the saving schedule.
4. Explain how consumption and saving are related to disposable income in the aggregate expenditures model.
Consumption and saving are directly related to disposable income in the aggregate expenditures model.
Consumption is positively related to disposable income, but is a proportionally greater part of low income
than of high income. In fact, at very low income levels it is probable that consumption exceeds income.

5. Fill in the table below. Describe your result.
Disposable Income
Consumption
Saving
$200
$210
$_____
$_____
$220
$0
$_____
$230
$10
$260
$_____
$20
$280
$_____
$30
$300
$260
$_____
Disposable Income
Consumption
Saving
$200
$210
−$20
$220
$220
$0
$240
$230
$10
$260
$240
$20
$280
$250
$30
$300
$260
$40
At the lowest levels of income, dissaving occurs as households spend more than they receive in disposable
income. This dissaving could occur with households liquidating their assets or borrowing money. As
income rises we see that savings increases by a greater and greater amount. This increase could occur
because higher incomes make households more able to save or the importance of saving to households
increases as income rises.
6. Complete the following table assuming that (a) MPS = 1/5, (b) there is no government and all saving is
personal saving.
Level of output
and income
Consumption
Saving
$250
$260
$_____
275
_____
_____
300
_____
_____
325
_____
_____
350
_____
_____
375
_____
_____
400
_____
_____
Level of output
and income
Consumption
Saving
$250
$260
−$10
275
280
−5
300
300
0
325
320
5
350
340
10
375
360
15
400
380
20

7. Complete the following table assuming that (a) MPS = 1/3, (b) there is no government and all saving is
personal saving.
Level of output
and income
Consumption
Saving
$100
$120
$_____
130
_____
_____
160
_____
_____
190
_____
_____
220
_____
_____
250
_____
_____
Level of output
and income
Consumption
Saving
$100
$120
−$20
130
140
−10
160
160
0
190
180
10
220
200
20
250
220
30
8. Differentiate between the average propensity to consume and the marginal propensity to consume.
9. What are the marginal propensity to consume (MPC) and marginal propensity to save (MPS)? How are the
two concepts related? How are the two concepts related to the consumption and saving functions?
10. If you know the marginal propensity to consume you can determine the marginal propensity to save. How
is that possible?
11. If you know the average propensity to consume you can determine the average propensity to save. How is
that possible?

12. Suppose a family’s annual disposable income is $8000 of which it saves $2000.
(a) What is their APC?
(b) If income rises to $10,000 and they plan to save $2800, what are MPS and MPC?
(c) Did the family’s APC rise or fall with their increase in income?
13. Suppose a family’s annual disposable income is $10,000 of which it saves $2,500.
(a) What is their APC?
(b) If income falls to $8,000 and they plan to save $1500, what are MPS and MPC?
(c) Did the family’s APC rise or fall with their decrease in income?
14. How does the Average propensity to consume (APC) in the United States compare to other advanced
countries?

15. Complete the accompanying table.
Level of output
and income
(GDP = DI)
Consumption
Saving
APC
APS
MPC
MPS
$100
$_____
−$5
_____
_____
_____
_____
125
_____
0
_____
_____
_____
_____
150
_____
5
_____
_____
_____
_____
175
_____
10
_____
_____
_____
_____
200
_____
15
_____
_____
_____
_____
225
_____
20
_____
_____
_____
_____
250
_____
25
_____
_____
_____
_____
275
_____
30
_____
_____
_____
_____
300
_____
35
_____
_____
_____
_____
(a) What is the break-even level of income? How is it possible for households to dissave at very low
income levels?
(b) If the proportion of total income consumed decreases and the proportion saved increases as income
rises, explain how the MPC and MPS can be constant at various levels of income.
Level of output
and income
(GDP = DI)
Consumption
Saving
APC
APS
MPC
MPS
$100
$105
−$5
1.05
−.05
0.8
0.2
125
125
0
1.00
.00
0.8
0.2
150
145
5
0.97
.03
0.8
0.2
175
165
10
0.94
.06
0.8
0.2
200
185
15
0.925
.075
0.8
0.2
225
205
20
0.91
.09
0.8
0.2
250
225
25
0.90
.10
0.8
0.2
275
245
30
0.89
.11
0.8
0.2
300
265
35
0.88
.12
0.8
0.2
(a) The break-even level of income is 125 where saving equals zero. Households dissave by borrowing or
by dipping into accumulated savings.
(b) The MPC and MPS represent the slopes of the consumption and savings schedules, respectively. The
fact that MPC and MPS are constant means that the schedules will be straight-line graphs. However,
the slope can be constant and still not be a constant proportion of income as represented on the
horizontal axis. In fact, the only time the MPC and the APC would be the same would be along the
45-degree line where the slope is equal to 1 and the ratio of spending to income is equal to 1 at all
levels.

16. Complete the accompanying table.
Level of output
and income
(GDP = DI)
Consumption
Saving
APC
APS
MPC
MPS
$480
$_____
−$8
_____
_____
_____
_____
520
_____
0
_____
_____
_____
_____
560
_____
8
_____
_____
_____
_____
600
_____
16
_____
_____
_____
_____
640
_____
24
_____
_____
_____
_____
680
_____
32
_____
_____
_____
_____
720
_____
40
_____
_____
_____
_____
760
_____
48
_____
_____
_____
_____
800
_____
56
_____
_____
_____
_____
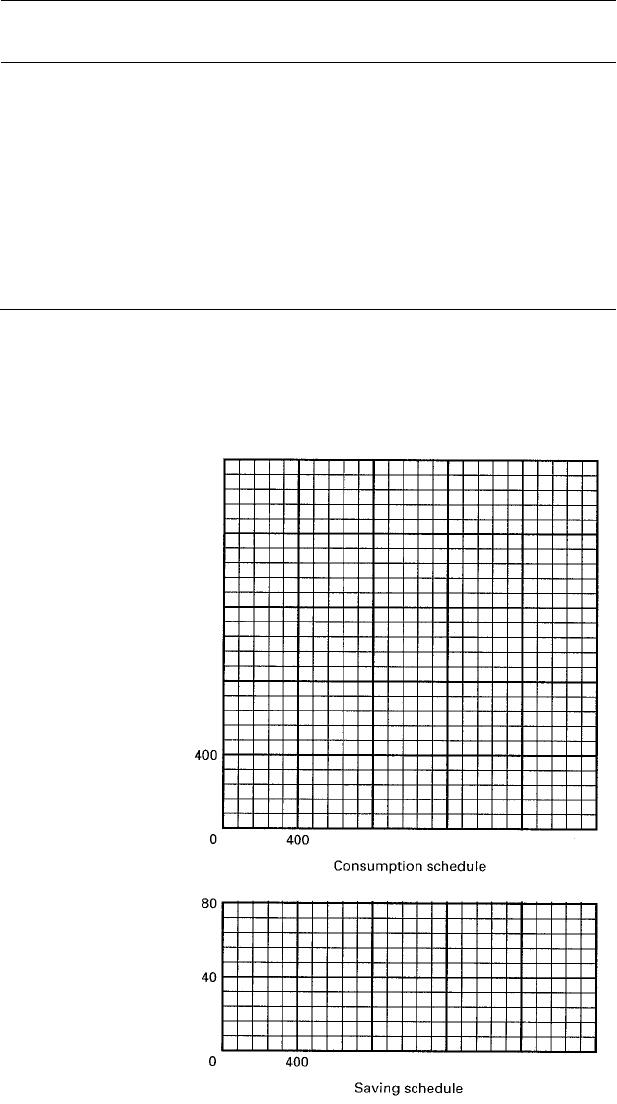
(a) Using the below graphs, show the consumption and saving schedules graphically.
(b) Locate the break-even level of income. How is it possible for households to dissave at very low
income levels?
(c) If the proportion of total income consumed decreases and the proportion saved increases as income
rises, explain both verbally and graphically how the MPC and MPS can be constant at various levels of
income.
Level of output
and income
(GDP = DI)
Consumption
Saving
APC
APS
MPC
MPS
$480
$488
−$8
1.02
−0.2
0.8
0.2
520
520
0
1.00
0.0
0.8
0.2
560
552
8
0.99
0.1
0.8
0.2
600
584
16
0.99
0.3
0.8
0.2
640
616
24
0.96
0.4
0.8
0.2
680
648
32
0.95
0.5
0.8
0.2
720
680
40
0.94
0.6
0.8
0.2
760
712
48
0.94
0.6
0.8
0.2
800
744
56
0.93
0.7
0.8
0.2