Unlock document.
This document is partially blurred.
Unlock all pages and 1 million more documents.
Get Access
20-431
CHAPTER 20
Public Finance: Expenditures and Taxes
A. Short-Answer, Essays, and Problems
1. Discuss how the government can use their influence to decide which goods and services are produced and
who consumes them.
2. Define proprietary income. List some examples.
3. Define public finance. What are the main sources of income and expenditures for the federal government?
4. Briefly describe the role of government in the economy. How are these government activities financed?
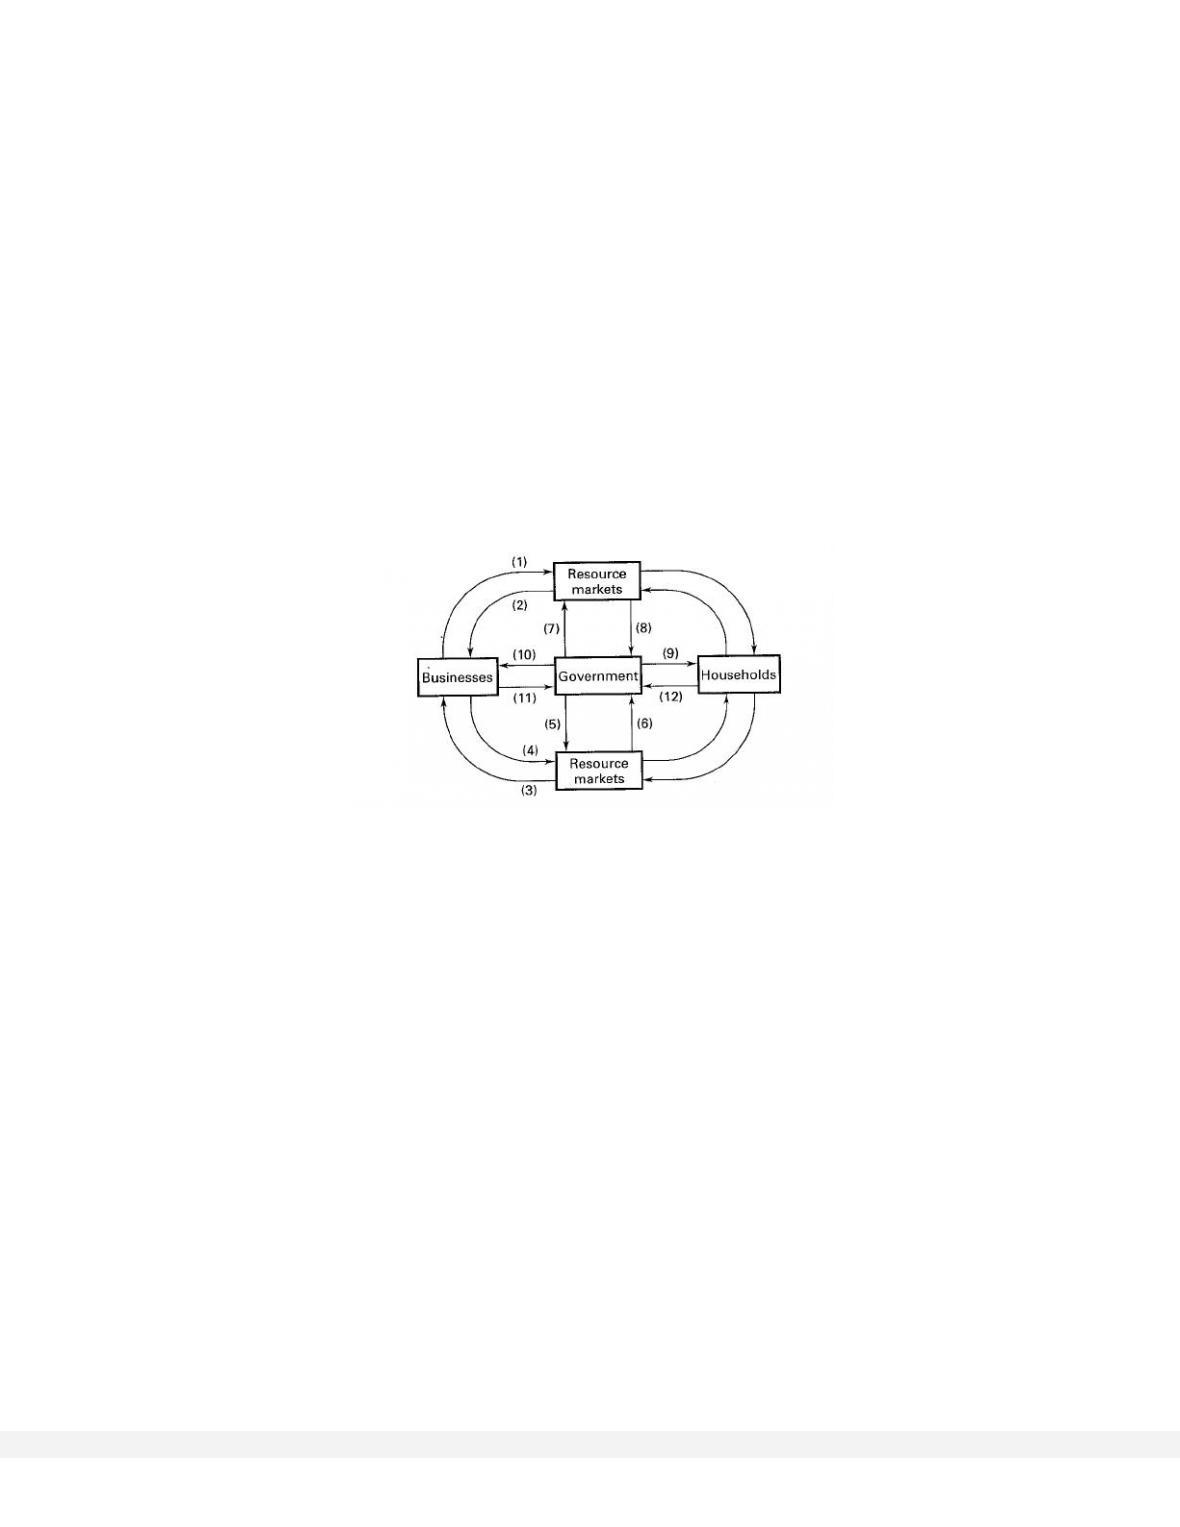
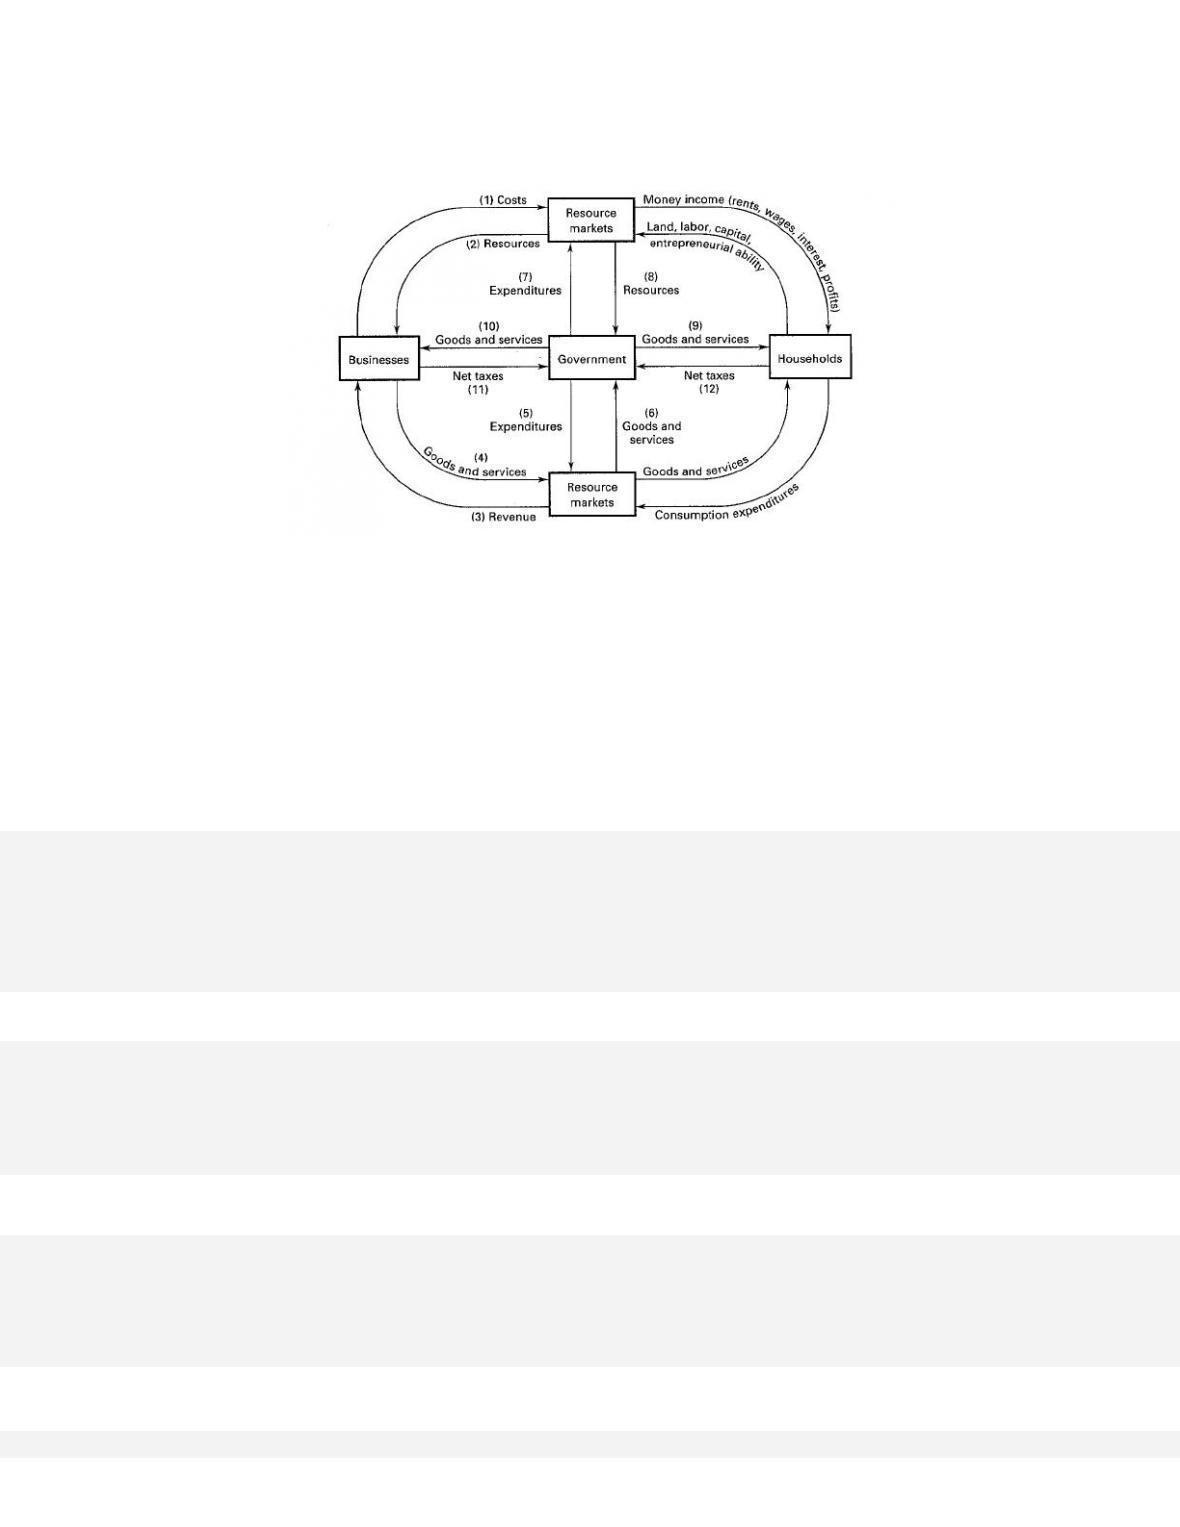
5. The circular flow diagram below includes business, household, and government sectors. Also shown are
the product and resource markets. Supply a label or an explanation for each of the twelve flows in the
model.
(1) ________________________
(2) ________________________
(3) ________________________
(4) ________________________
(5) ________________________
(6) ________________________
(7) ________________________
(8) ________________________
(9) ________________________
(10) ________________________
(11) ________________________
(12) ________________________
6. In which market does the following take place:
(a) Wages of farm workers
(b) The price of corn
(c) Rent on a plot of farm land
(d) The price of new farm equipment
(e) The price of milk
7. Differentiate between government purchases of goods and services and government transfer payments.
8. How is total government spending defined? What is its size in the economy?
9. List the four main categories of Federal spending.
10. List the four major sources of Federal revenues.

Public Finance: Expenditures and Taxes
11. Explain the difference between marginal and average tax rates.

12. Given the following information on the tax paid for different levels of taxable income, fill in the average
and the marginal tax rates for each income level. Also explain how to calculate the average tax rate and the
marginal tax rate. Is this tax progressive?
Taxable
income
Tax
Average
tax rate,
(in %)
Marginal
tax rate,
(in %)
$10,000
$1000
_____
_____
15,000
1750
_____
_____
20,000
2750
_____
_____
25,000
5000
_____
_____
13. Given the following information on the tax paid for different levels of taxable income, fill in the average
and the marginal tax rates for each income level. Also explain how to calculate the average tax rate and the
marginal tax rate. Is this tax progressive?
Taxable
income
Tax
Average
tax rate,
(in %)
Marginal
tax rate,
(in %)
$10,000
$ 1,000
_____
_____
15,000
3,000
_____
_____
20,000
7,000
_____
_____
25,000
12,000
_____
_____
14. What are the major expenditures of state governments? What are the major sources of tax revenue?
15. (Consider This) Discuss the arguments for and against state lotteries.
16. Give the most important source of revenue for local governments and their most important expenditure.
17. Describe the major sources of revenue and major types of expenditures at each level of government.
18. Describe the size of government employment as a percentage of the labor force. What are three major
types of government employment at the state and local levels and at the Federal level?
19. What are the problems encountered in any strict application of benefits-received and ability-to-pay
principles of taxation?
20. Explain and evaluate this statement: “No tax on income can be a just tax unless it leaves individuals in the
same relative condition in which it found them.”
21. Explain and evaluate this statement: “Because there is no sure definition of the limits to progression, no
firm basis of its ‘reasonable’ use, and no protection against its unconscionable abuse, those who uphold the
system as a revenue device are playing into the hands of the group that would use progressive taxation as
the means of destroying private capitalism and ushering in the collectivist state.”
22. Why are payroll taxes regressive?

20-433
23. Answer the next three questions on the basis of the following data:
Taxable
income
Total tax
$10,000
$ 0
20,000
1,000
30,000
3,000
40,000
6,000
50,000
10,000
60,000
15,000
(a) What type of tax is represented by the tax schedule?
(b) What will your average tax rate be if your taxable income is $50,000?
(c) If your taxable income increases from $30,000 to $40,000, what will your marginal tax rate be?
24. Answer the next three questions on the basis of the following data:
Taxable
income
Total tax
$ 5,000
$ 0
10,000
500
15,000
1000
20,000
2000
25,000
4000
30,000
8000
(a) What type of tax is represented by the tax schedule?
(b) What will your average tax rate be if your taxable income is $25,000?
(c) If your taxable income increases from $15,000 to $20,000, what will your marginal tax rate be?
25. In the following table are five levels of taxable income and the amount that would be paid at each of the
five levels under three tax laws: X, Y, and Z. compute for each of the three tax laws the average rate of
taxation at each of the four remaining income levels and indicate whether the tax is regressive,
proportional, or progressive.
Tax X
Tax Y
Tax Z
Income
Tax paid
Average tax
rate %
Tax paid
Average tax
rate %
Tax paid
Average tax
rate %
$10,000
$ 400
4%
$ 500
5%
$ 300
3%
20,000
800
_____
700
_____
800
_____
30,000
1200
_____
900
_____
1500
_____
40,000
1600
_____
1100
_____
2400
_____
50,000
2000
_____
1300
_____
3500
_____
Type of tax:
____________________
____________________
____________________
26. Assume a state government levies a 5% sales tax on all consumption expenditures. Consumption
expenditures at six income levels are shown in the table below. compute the sales tax paid and the average
tax rate at these incomes in the table.
Income
Consumption
expenditures
Sales tax
paid
Average
tax rate, %
$16,000
$15,000
$750
4.7
20,000
17,000
850
4.3
24,000
20,000
_____
_____
28,000
22,000
_____
_____
32,000
25,000
_____
_____
36,000
27,000
_____
_____
What type of tax is the sales tax in this case? Why?
27. (Consider This) What are the advantages and disadvantages to the value-added tax (VAT)?
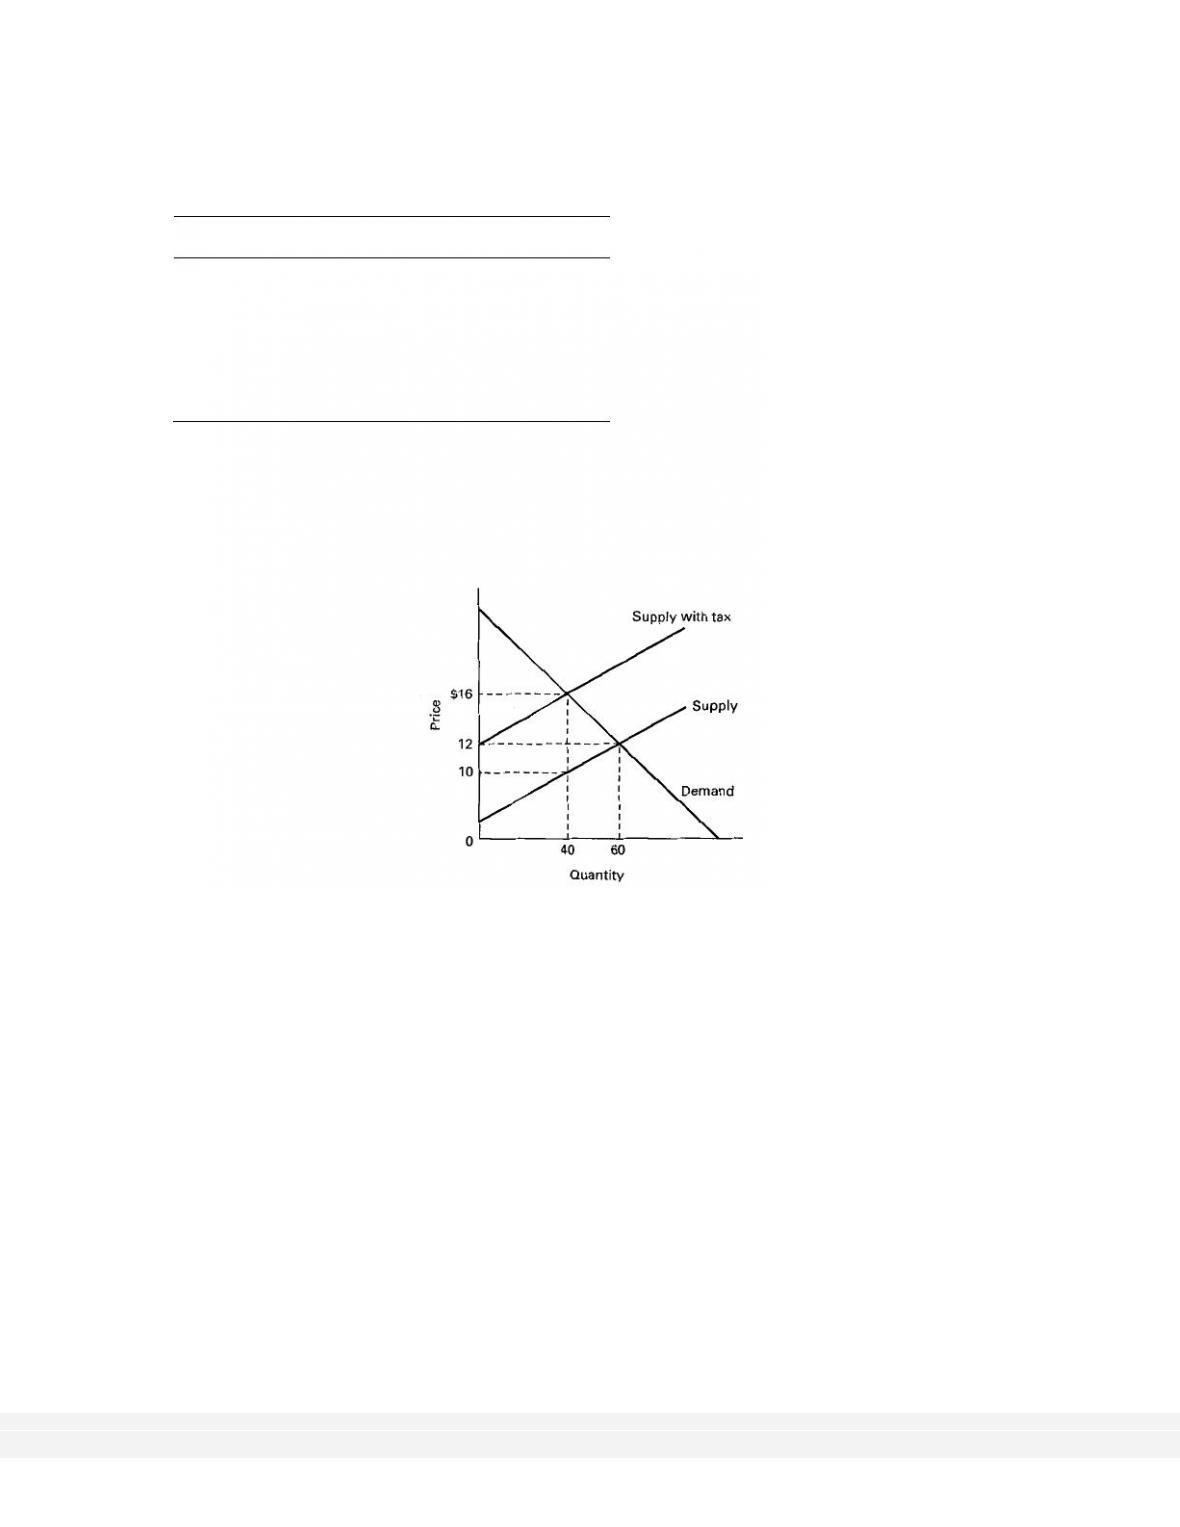
28. In the graph below, if the government imposes an excise tax as shown, what is the tax burden to the seller?
And to the buyer? Explain.
20-435
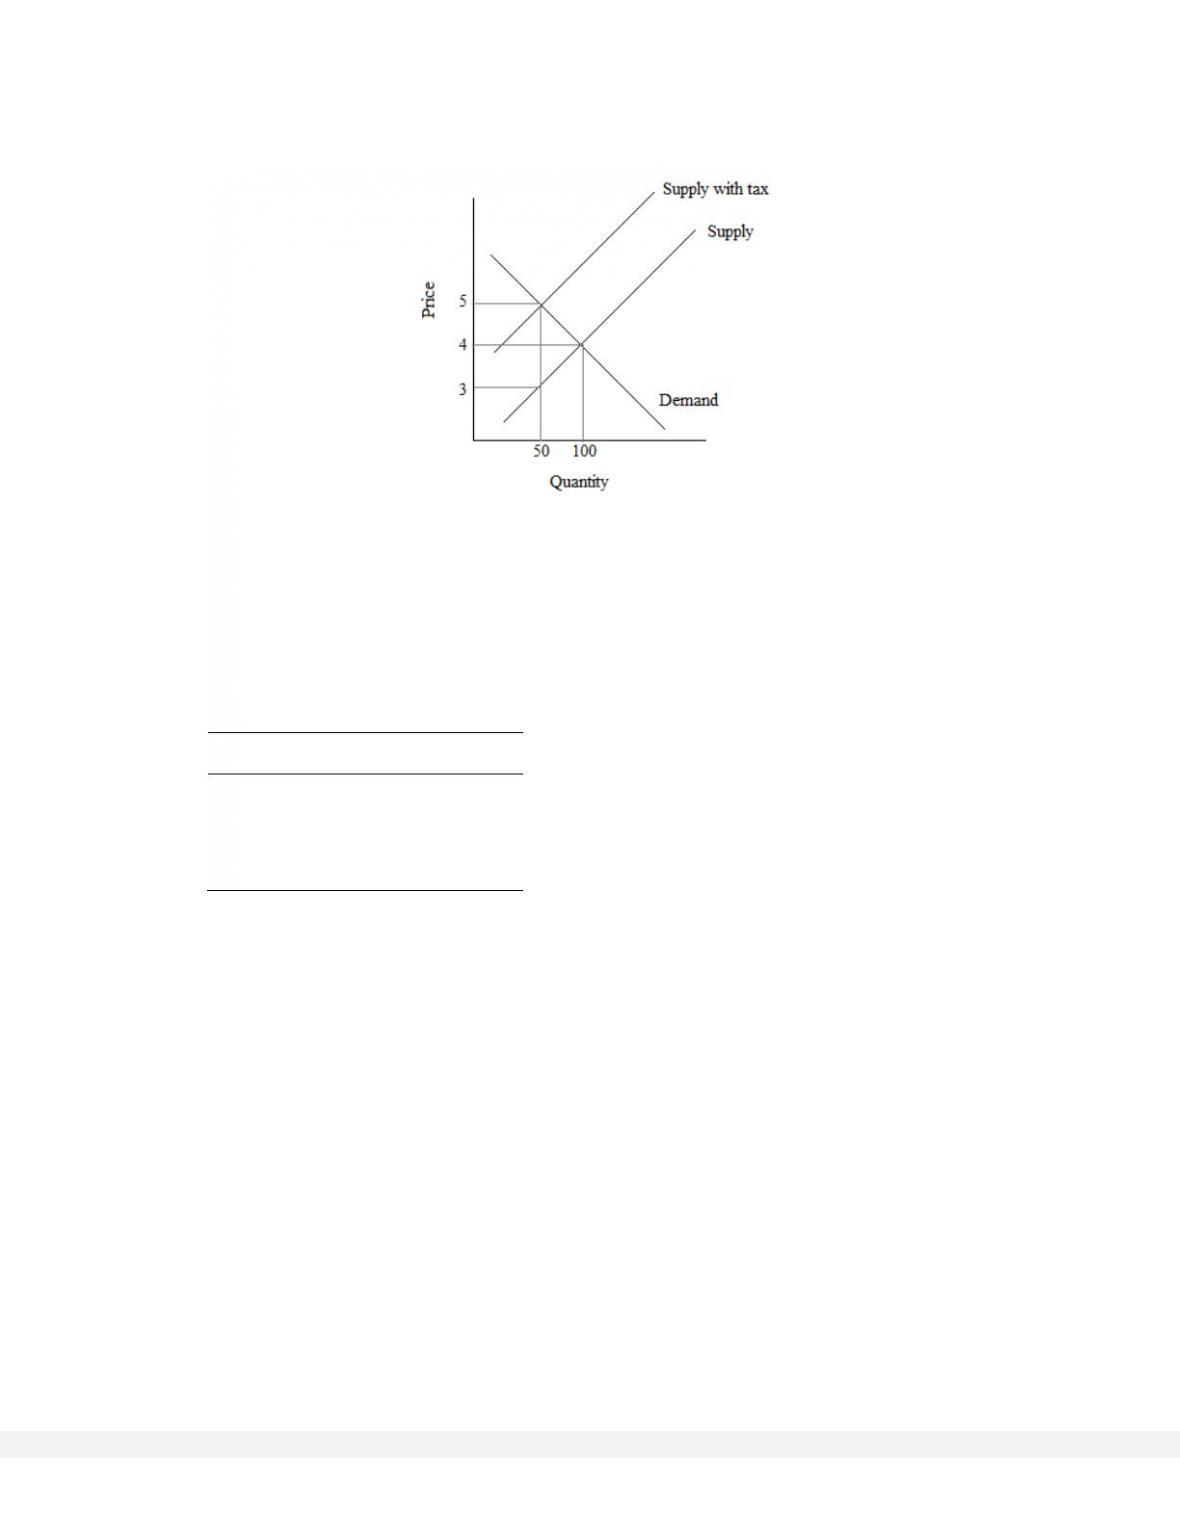
29. Answer the following questions based on the graph below.
(a) What is the equilibrium price and quantity in the market without the tax?
(b) What is the amount of the tax per unit?
(c) What amount of the tax is paid by consumers? By producers?
(d) What amount does the consumer pay for the product? What does the producer receive?
(e) What is the total tax revenue for government?
(f) What is the efficiency loss (deadweight loss) of the tax?
30.Answer the next two questions on the basis of the following demand and supply data for a competitive
market:
Quantity
demanded
Price
Quantity
supplied
3000
$7
7000
4000
6
6000
5000
5
5000
6000
4
4000
7000
3
3000
(a) If government levies a per unit excise tax of $2 on suppliers of this product, what would the
equilibrium price and quantity be? How much tax will be paid?
(b) If government has instead provided a per unit subsidy of $2 to suppliers of this product, what would
the equilibrium price and quantity be?
20-436
31. In the table below are the demand and supply schedules for beer in thousands of cases in a state.
Quantity
demanded
(cases)
Price per
case
Before tax
quantity supplied
(cases)
After tax quantity
supplied
(cases)
250
$11.60
1000
_____
300
11.40
900
_____
350
11.20
800
_____
400
11.00
700
_____
450
10.80
600
_____
500
10.60
500
_____
550
10.40
400
0
600
10.20
300
0
650
10.00
200
0
(a) What is the equilibrium price and quantity before a tax is imposed?
(b) If state government now imposes an excise tax of $0.60 per case of beer, what is the after-tax supply
schedule?
(c) What is the equilibrium price of beer after the tax is imposed? How much of the $0.60 is borne by the
buyer and how much by the seller?
32. In the table below are the demand and supply schedules for rum in thousands of liters in a state.
Quantity
demanded
(liters)
Price per
liter
Before tax
quantity supplied
(liters)
After tax quantity
supplied
(liters)
100
$7.00
1100
_____
200
6.75
1000
_____
300
6.50
900
_____
400
6.25
800
_____
500
6.00
700
_____
600
5.75
600
_____
700
5.50
500
0
800
5.25
400
0
900
5.00
300
0
(a) What is the equilibrium price and quantity before a tax is imposed?
(b) If state government now imposes an excise tax of $1.00 per liter of rum, what is the after-tax supply
schedule?
(c) What is the equilibrium price of rum after the tax is imposed? How much of the $1.00 is borne by the
buyer and how much by the seller?
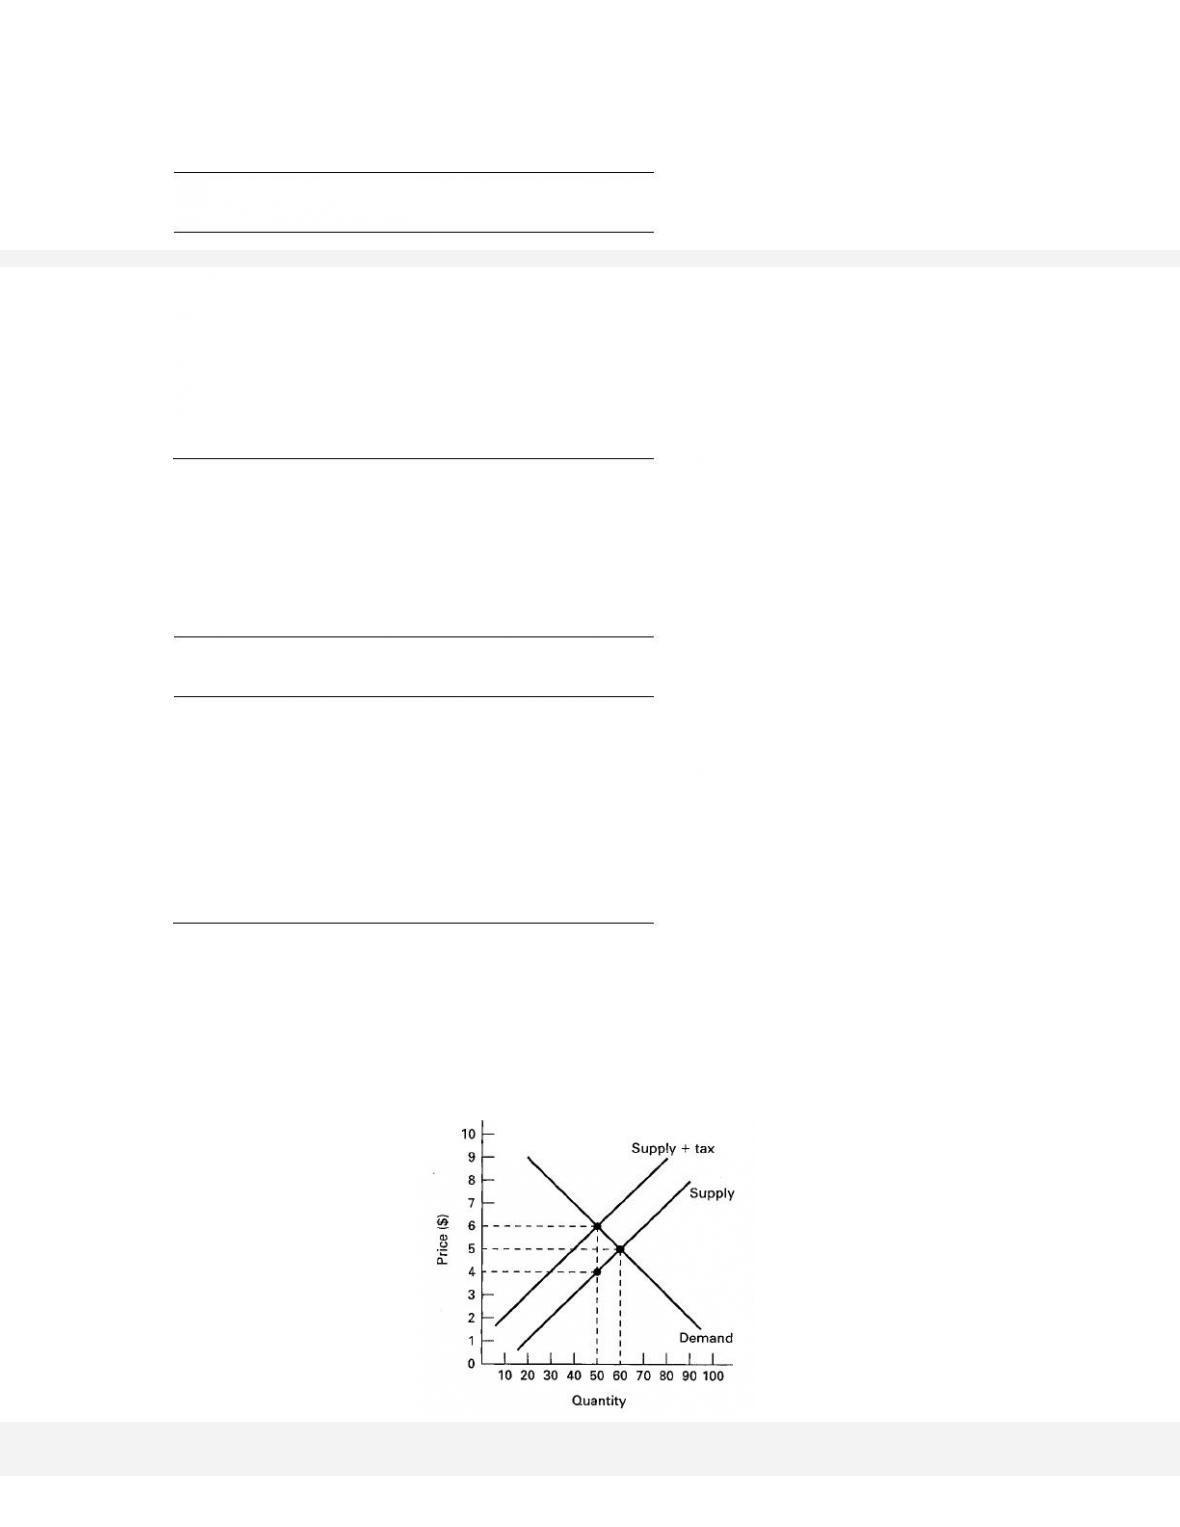
33. The next four questions refer to the below supply and demand graph for a product on which the
government imposes an excise tax.

(a) What is the amount of the tax per unit?
(b) What is the total amount of the excise tax paid by the consumer? By the producer?
(c) What is the total tax revenue for government?
(d) What is the efficiency loss of the tax?
34. Can you imagine graphically a case where the efficiency loss from a tax would equal zero? Explain.
35. Assuming the basic purpose is to raise additional revenue, should government levy an excise tax on
cigarettes whose demand is highly inelastic or on a product whose demand is highly elastic? Are there any
other reasons to levy such a tax?
36. In many large cities auto commuters are given quantity discounts on tickets to use bridges, tunnels, and toll
roads. Some argue that these discounts are a subsidy to traffic congestion and air pollution. Do you agree?
Explain.
37. What is the meaning of the incidence of a tax? Give an example using a landlord and tenants.
38. What is the probable incidence of the personal income tax?
39. Explain the probable incidence of a general sales tax imposed by a state.
40. A state decides to pass a new law raising the excise tax on cigarettes. What would be the probable
incidence of this new tax?
41. Discuss probable incidence of a local tax on business property.
42. Is the tax structure of the United States progressive at the Federal level, the state and local level, and
combined? How do transfer payments affect the distribution of income?
43. Compare the progressivity of the United States tax system compared to other OECD countries.
44. (Last Word) Who pays taxes and who receives government spending? Explain.

B. Answers to Short-Answer, Essays, and Problems
1. Discuss how the government can use their influence to decide which goods and services are produced and
who consumes them.
2. Define proprietary income. List some examples.
3. Define public finance. What are the main sources of income and expenditures for the federal government?
4. Briefly describe the role of government in the economy. How are these government activities financed?
20-439
5.The circular flow diagram below includes business, household, and government sectors. Also shown are the
product and resource markets. Supply a label or an explanation for each of the twelve flows in the model.
(1) ________________________
(2) ________________________
(3) ________________________
(4) ________________________
(5) ________________________
(6) ________________________
(7) ________________________
(8) ________________________
(9) ________________________
(10) ________________________
(11) ________________________
(12) ________________________
(1) Costs; (2) Resources; (3) Business revenue; (4) Goods and services; (5) Government expenditures on
goods and services; (6) Goods and services; (7) Government expenditures on resources; (8) Resource flows
to government; (9) Public goods and services; (10) Public goods and services; (11) Business taxes; (12)
Household taxes.
6. In which market does the following take place:
7. Differentiate between government purchases of goods and services and government transfer payments.
8. How is total government spending defined? What is its size in the economy?
20-440
9. List the four main categories of Federal spending.
10. List the four major sources of Federal revenues.
11. Explain the difference between marginal and average tax rates.
12. Given the following information on the tax paid for different levels of taxable income, fill in the average
and the marginal tax rates for each income level. Also explain how to calculate the average tax rate and the
marginal tax rate. Is this tax progressive?
Taxable
income
Tax
Average
tax rate,
(in %)
Marginal
tax rate,
(in %)
$10,000
$1000
_____
_____
15,000
1750
_____
_____
20,000
2750
_____
_____
25,000
5000
_____
_____
Taxable
income
Tax
Average
tax rate,
(in %)
Marginal
tax rate,
(in %)
$10,000
$1000
10
10
15,000
1750
11.67
15
20,000
2750
13.75
20
25,000
5000
20
45
To find the average figures divide total tax by total income. To find the marginal figures divide the change
in tax by the change in income. Note that the first marginal tax rate is often excluded because the
difference between no income and $10,000 here will produce the same results as the average tax rate is
progressive.


