10–234
14. Fill in the following table for a product in a purely competitive market. The market price for the good is
$32. Use the total revenue–total cost approach to evaluate at what quantity the firm can maximize its
profits.
Total
product
output
Total
fixed
cost
Total
variable
cost
Total
cost
Total
revenue
Profit / Loss
0
$50
$ 0
$_____
$_____
$_____
1
50
5
_____
_____
_____
2
50
15
_____
_____
_____
3
50
30
_____
_____
_____
4
50
50
_____
_____
_____
5
50
75
_____
_____
_____
6
50
105
_____
_____
_____
7
50
140
_____
_____
_____
8
50
185
_____
_____
_____
Total
product
output
Total
fixed
cost
Total
variable
cost
Total
cost
Total
revenue
Profit / Loss
0
$50
$ 0
$ 50
$ 0
$−50
1
50
5
55
32
−23
2
50
15
65
64
−1
3
50
30
80
96
16
4
50
50
100
128
28
5
50
75
125
160
35
6
50
105
155
192
37
7
50
140
190
224
34
8
50
185
235
256
21
Using the total revenue–total cost approach, the profit is maximized at a quantity of 6 when the price is $32
with a total profit of $37.
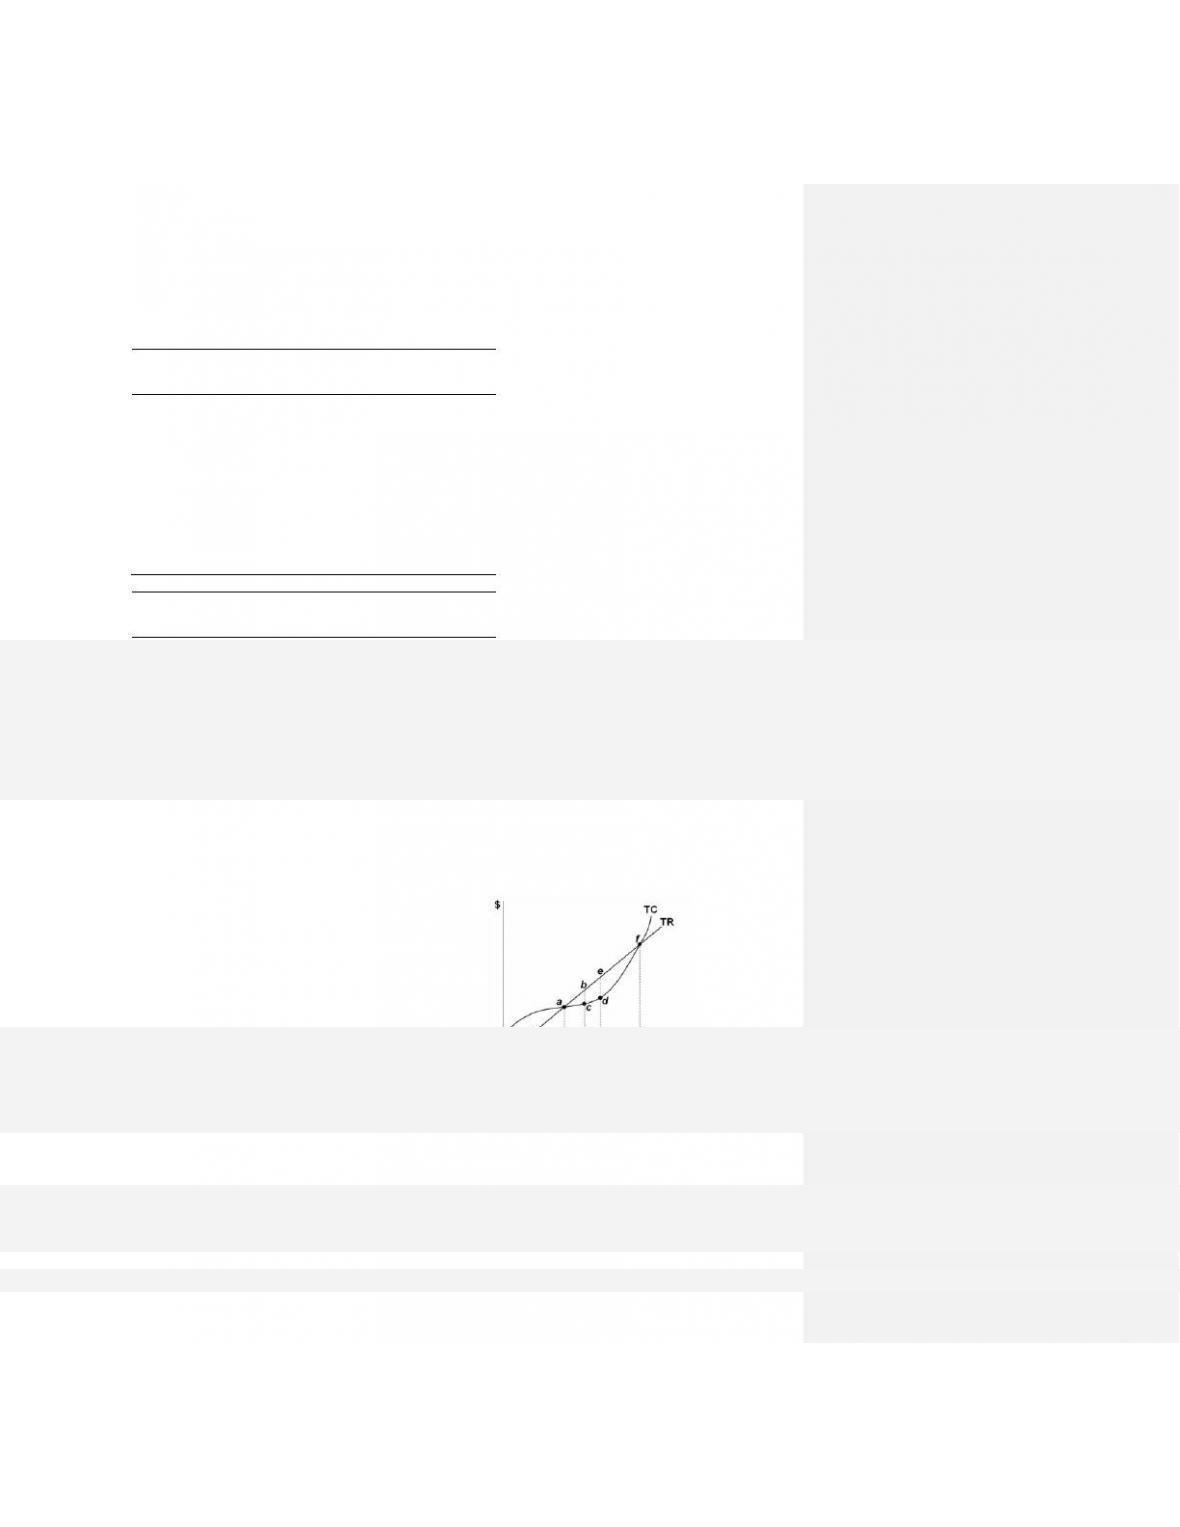
15. Use the graph below to identify: (a) break-even points; (b) the profit-maximizing level of output; and, (c)
letters showing largest difference between total revenue and total costs and the output level.
16. What conditions are necessary to determine if the purely competitive firm should produce in the short run?
State the marginal revenue and marginal cost conditions and the total revenue and total cost conditions.

17. What quantity should the purely competitive firm produce to maximize profits? Analyze from a total
revenue and total cost perspective and a marginal revenue and marginal cost perspective.
18. Under what conditions will a purely competitive firm realize an economic profit? Give a response from a
marginal revenue and marginal cost perspective and from a total revenue and total cost perspective.
19. Why is the level of output at which marginal revenue equals marginal cost the profit-maximizing output?
20. Suppose a bridge for automobiles was constructed across a river and all the costs associated with its
construction have been paid. The amount of traffic is such that there are no foreseeable problems of
overcrowding in the use of the bridge. Assume, also, that the extra cost associated with traffic crossing the
bridge is for all practical purposes equal to zero. What toll should be charged to achieve the most efficient
use of the bridge?
21. Explain the marginal revenue and marginal cost approach to profit maximization and use it to describe
profit, loss, and shut down situations for the purely competitive firm.
22. Tomato Farms is selling tomatoes in a purely competitive market. Its output is 5000 bushels, which sell for
$15 a bushel. At this level of output, the marginal cost is $15 a bushel and average total cost is $14.50 a
bushel. Should the firm increase output, decrease output, or not produce? Why?

23. Good Grapes is selling grapes in a purely competitive market. Its output is 5000 pounds, which it sells for
$5 a pound. At the 5000-pound level of output, the average variable cost is $4.00, the marginal cost is
$4.25, and the average total cost is $4.50 a pound. Should the firm increase output, decrease output, or not
produce? Why? How should the firm determine the optimal level of output?
24. Doggy Treats is selling dog treats in a purely competitive market. Its output is 800 treats, which it sells for
$10 a treat. At the 800-treat level of output, the marginal cost is $11, the average variable cost is $9.00, and
the average variable cost is $8.00. Should the firm increase output, decrease output, or not produce? Why?
How should the firm determine that optimal level of output?
25. Shazam, a maker of magic wands, is selling in a purely competitive market. Its output is 500 wands, which
sell for $10 each. At this level of output, the marginal cost is $10 and the average variable cost is $12.
Should the firm increase output, decrease output, or not produce? Why?
27. Use the graph to answer these questions: (a) What is the profit-maximizing level of output? (b) What is
the economic profit? (c) What is the per-unit amount of profit at the profit-maximizing level of output? (d)
At what price would the firm decide to shut down?
28. (Consider This) Why might a business owner keep their business open but let it deteriorate, rather than
shut it down? Will this profitability last?
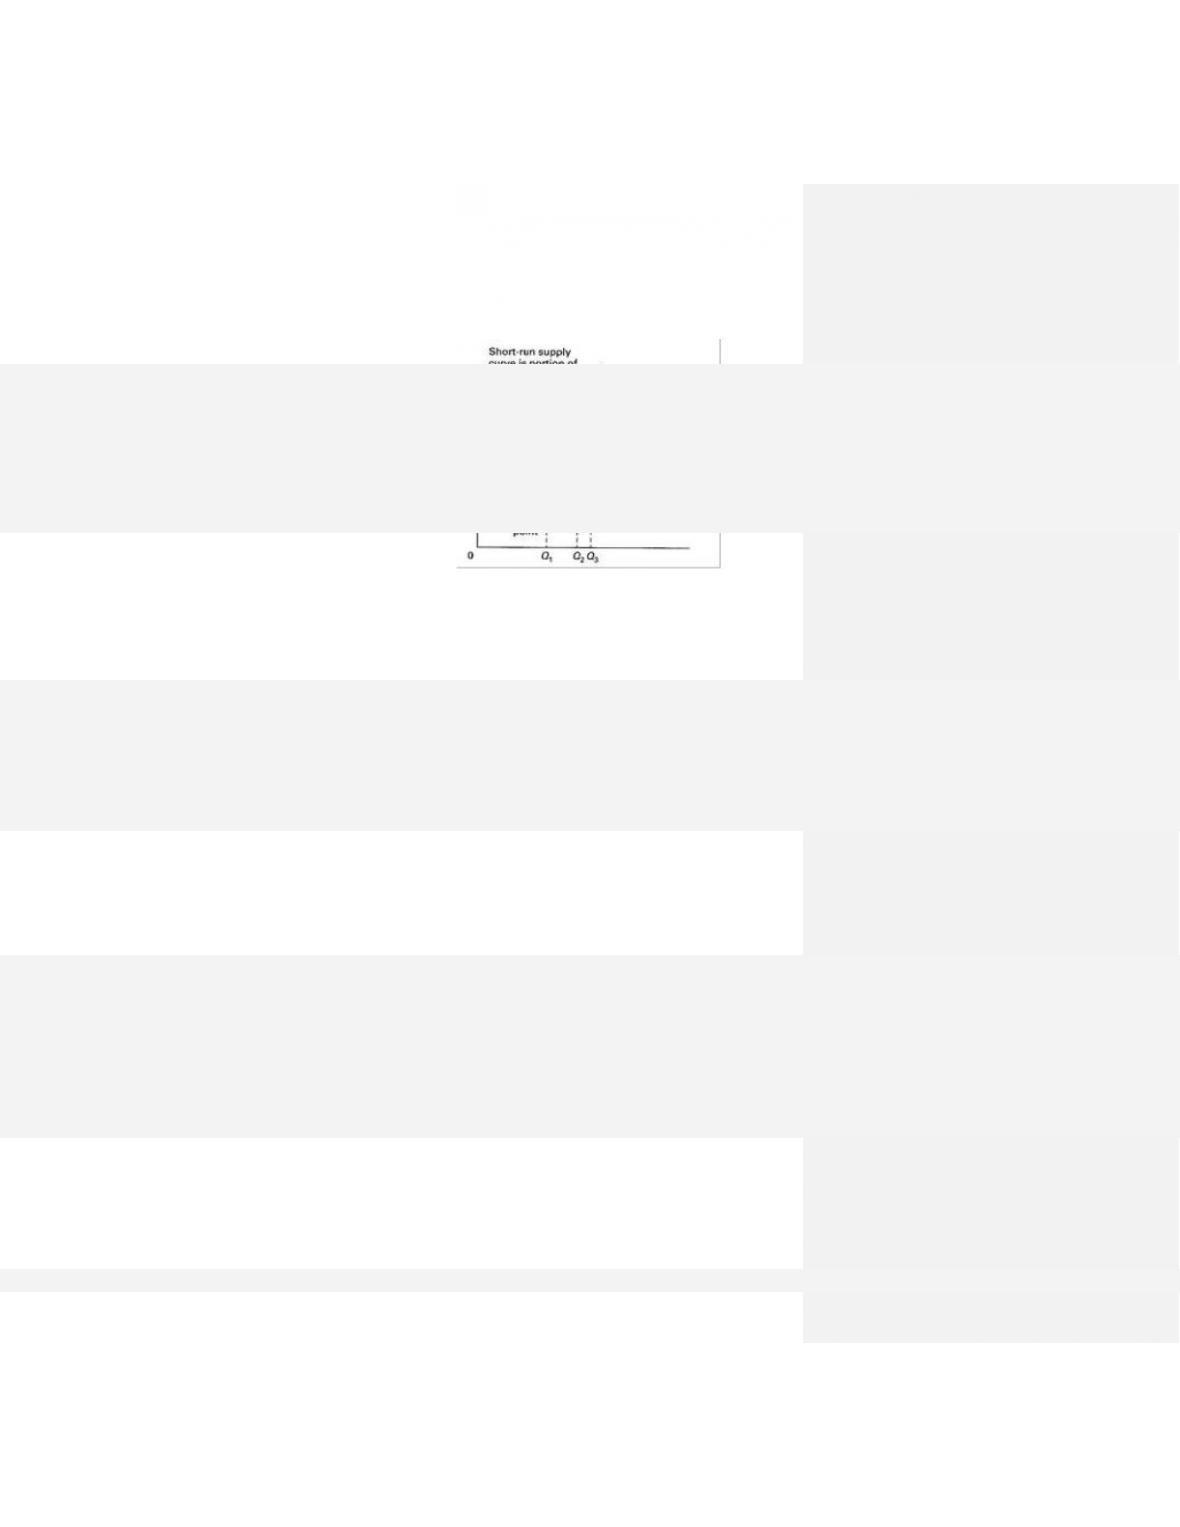
29. What is the relationship between marginal cost and the short-run supply curve for the purely competitive
firm?
10–238
30. Draw a graph of the short-run cost curves for a purely competitive firm that shows a short-run supply curve
for the individual firm. Identify the shutdown point, the break-even point, the profit-maximizing point, and
the levels of output associated with those points.
31. How will the marginal and average cost curves of the typical pure competitor shift or change as a result of
the following events: (a) an increase in wages of all labor; (b) an increase in the rental payments on office
machinery; (c) a technological advance; (d) an increase in sales taxes; (e) an increase in property taxes; and
(f) a decline in the price of a basic raw material?
32. The agricultural market for corn can be characterized as a purely competitive industry. How might the
following events affect the short-run cost curves and output for a firm in the industry?
(a) A reduction in the cost of fertilizer that is sold to corn farmers.
(b) The Internal Revenue Service (IRS) changes tax laws which increase the amount of depreciation that
farmers can deduct for equipment.
(c) The market price of corn falls.

10–239
33. The market for milk can be characterized as a purely competitive industry. How might the following
events affect the short-run cost curves and output for a firm in the industry? Discuss how this will affect the
profit of the individual firm.
(a) A reduction in the cost of corn that is sold to dairy farmers (the producers of milk).
(b) Property taxes for the land the cows graze on increases.
(c) The market price of milk increases.
10–240
34. Assume a single firm in a purely competitive industry has variable costs as indicated in the following table
in column 2. Complete the table and answer the questions.
(1)
Total
product
(2)
Total
var. cost
(3)
Total
cost
(4)
AFC
(5)
AVC
(6)
ATC
(7)
MC
0
$ 0
$ 40
$_____
$_____
$_____
1
55
_____
_____
_____
_____
$_____
2
75
_____
_____
_____
_____
_____
3
90
_____
_____
_____
_____
_____
4
110
_____
_____
_____
_____
_____
5
135
_____
_____
_____
_____
_____
6
170
_____
_____
_____
_____
_____
7
220
_____
_____
_____
_____
_____
8
290
_____
_____
_____
_____
_____
Product
price
Quantity
supplied
Profit (+)
or loss (−)
$72
_____
$_____
52
_____
_____
45
_____
_____
28
_____
_____
22
_____
_____
15
_____
_____
Assume there are 500 identical firms in this industry, that they have identical cost data as the firm above,
and that the industry demand schedule is as follows:
Price
Quantity
demanded
$72
2500
52
3500
45
4000
28
5200
22
5900
15
6700
(e) What will the equilibrium price be?
(f) What will the equilibrium output for each firm be?
(g) What will profit or loss be per unit?
(h) What will profit or loss be per firm?

10–241
(1)
Total
product
(2)
Total
var. cost
(3)
Total
cost
(4)
AFC
(5)
AVC
(6)
ATC
(7)
MC
0
$ 0
$ 40
—–
—–
—–
—–
1
55
95
$40.00
$55.00
$95.00
$55.00
2
75
115
20.00
37.50
57.50
20.00
3
90
130
13.33
30.00
43.33
15.00
4
110
150
10.00
27.50
37.50
20.00
5
135
175
8.00
27.00
35.00
25.00
6
170
210
6.67
28.33
35.00
35.00
7
220
260
5.71
31.43
37.14
50.00
8
290
330
5.00
36.25
41.25
70.00

35. Assume that a purely competitive firm has the schedule of costs given in the table below.
Output
TFC
TVC
TC
0
$500
$ 0
$ 500
1
500
150
650
2
500
200
700
3
500
260
760
4
500
340
840
5
500
450
950
6
500
590
1090
7
500
770
1270
8
500
1000
1500
9
500
1290
1790
10
500
1650
2150
_____
_____
_____
_____
_____
_____
_____
_____
_____
_____
_____
_____
_____
_____
_____
_____
_____
_____
_____
_____
_____
_____
_____
_____
100
200
1000
250
1250
300
1500
350
1050
1750
400
1200
2000

9
450
−1340
1350
−440
2250
+460
10
500
−1650
1500
−650
2500
+350
(b) See table.
Price
Quantity
supplied
Profit (+) or
loss (−)
$ 50
0
−$500
150
6
−190
250
8
+500
36. Assume that a purely competitive firm has the schedule of average and marginal costs given in the table
below.
Output
AFC
AVC
ATC
MC
0
1
$600
$200
$800
$200
2
300
150
450
100
3
200
140
340
120
4
150
145
295
160
5
120
160
280
220
6
100
180
280
280
7
86
205
291
360
8
76
232
314
460
9
66
276
342
580
10
60
320
380
720
$_____
460
_____
360
_____
280
_____
220
_____
160
_____
120
_____
460
360
220
1000
160

(a) See table.
Price
Quantity
supplied
Profit (+) or
loss (−)
$580
9
+$2142
460
8
+1168
360
7
+483
280
6
0
220
5
−300
160
4
−540
120
0
600
(b) See table. (1) The equilibrium price will be $360 and the equilibrium quantity will be 700 units. (2)
Each firm will make $483 in profit. (3) Firms will tend to enter the industry in the long run because
economic profits are being made.
Quantity
demanded
Price
Quantity
supplied
500
$580
900
600
460
800
700
360
700
800
280
600
900
220
500
1000
160
400
1100
120
0
37. Assume that a purely competitive firm has the schedule of total fixed and total variable costs given in the
table below. Fill in the total cost column.
Output
TFC
TVC
TC
0
$500
$ 0
$_____
2
500
200
_____
4
500
340
_____
6
500
590
_____
8
500
1000
_____
10
500
1650
_____
_____
_____
_____
_____
_____
_____
_____
_____
_____
_____
_____
_____
_____
_____
_____
_____
_____
_____
10
_____
_____
_____
_____
_____
_____

Price
Quantity
supplied
Profit (+)
or loss (−)
$ 50
_____
$_____
150
_____
_____
250
_____
_____
Output
TFC
TVC
TC
0
$500
$ 0
$500
2
500
200
700
4
500
340
840
6
500
590
1090
8
500
1000
1500
10
500
1650
2150
(a) See table.
Market price = $50
Market price = $150
Market price = $250
Output
Total
revenue
Profit (+) or
loss (−)
Total
revenue
Profit (+) or
loss (−)
Total
revenue
Profit (+) or
loss (−)
0
$ 0
$ −500
$ 0
$ −500
$ 0
$ −500
2
100
−600
300
−400
500
−200
4
200
−640
600
−240
1000
+160
6
300
−790
900
−190
1500
+410
8
400
−1100
1200
−300
2000
+500
10
500
−1650
1500
−650
2500
+350
Price
Quantity
supplied
Profit (+) or
loss (−)
$ 50
0
−$500
150
6
−190
250
8
+500
38. (Last Word) Why do high fixed costs force firms to shut down temporarily or shut down forever?