Unlock document.
This document is partially blurred.
Unlock all pages and 1 million more documents.
Get Access

1-20
37. Explain and evaluate: “If resources were infinitely abundant in relation to the demand for them, the
economizing problem would dissolve in a sea of affluence.”
38. “The relative scarcity of resources makes the operation of any economy a matter of choosing between
alternatives.” Explain.
39. “The two cornerstones of economics are the scarcity of resources and the multiplicity of wants. True
economy consists of deriving maximum want satisfaction from available resources.” Explain.
40. The production possibilities curve below show the hypothetical relationship between the production of food
and clothing in an economy.
Combination
Food
Clothing
A
0
4
B
7
3
C
13
2
D
18
1
E
22
0
(a) What is the marginal opportunity cost of producing the second unit of clothing?
(b) What is the total opportunity cost of producing the second unit of clothing?
(c) What is the marginal opportunity cost of producing the third unit of clothing?
(d) What is the total opportunity cost of producing the third unit of clothing?

1-21
41. The production possibilities curve below shows the hypothetical relationship between the production of
guns (national defense) and butter (social goods) in an economy.
Combination
Guns
Butter
A
0
4
B
14
3
C
26
2
D
36
1
E
44
0
(a) What is the marginal opportunity cost of producing the second unit of butter?
(b) What is the total opportunity cost of producing the second unit of butter?
(c) What is the marginal opportunity cost of producing the third unit of butter?
(d) What is the total opportunity cost of producing the third unit of butter?
42. A production possibilities table for two products, grain and airplanes, is found below. Usual assumptions
regarding production possibilities are implied. Grain is measured in metric tons and airplanes are measured
in units of 1,000.
Combination
Grain
(metric tons)
Airplanes
(1,000s)
A
0
7
B
14
6
C
26
5
D
36
4
E
44
3
F
50
2
G
54
1
H
56
0
(a) Using the below graph construct a production possibilities curve from this information placing grain on
the vertical axis and airplanes on the horizontal axis.
(b) What is the opportunity cost of producing the first unit of airplanes? The marginal opportunity cost of
producing the fourth unit of airplanes?

1-22
43. A production possibilities table for two products, corn and paper, is found below. Usual assumptions
regarding production possibilities are implied. Corn is measured in tons, and paper is measured per unit.
Combination
Corn
Paper
A
0
6
B
18
5
C
33
4
D
45
3
E
54
2
F
60
1
G
63
0
(a) Using the following graph construct a production possibilities curve from this information placing corn
on the vertical axis and paper on the horizontal axis.
(b) What is the marginal opportunity cost of producing the first unit of paper? The marginal opportunity
cost of producing the fourth unit of paper?
44. How are tradeoffs illustrated by the production possibilities curve? Consider the case of Federal
government spending on national defense and spending on social programs.
In the production possibilities model, an increase in government spending on national defense will come at
45. What is the economic rationale for the law of increasing opportunity costs?
Economic resources are not completely adaptable to alternative uses. In a two-product (A and B) economy,
an increase in the production of product A will cause a reduction in the quantity of product B that can be

1-23
46. Explain how increasing opportunity costs are reflected graphically in the production possibilities curve.
How would the curve appear if opportunity costs were constant? (Answer verbally or illustrate your
response with diagrams.)
47. How is the most-valued or optimal point on the production possibilities curve determined?
Full employment and productive efficiency allows a society to achieve any point on the production
1-24
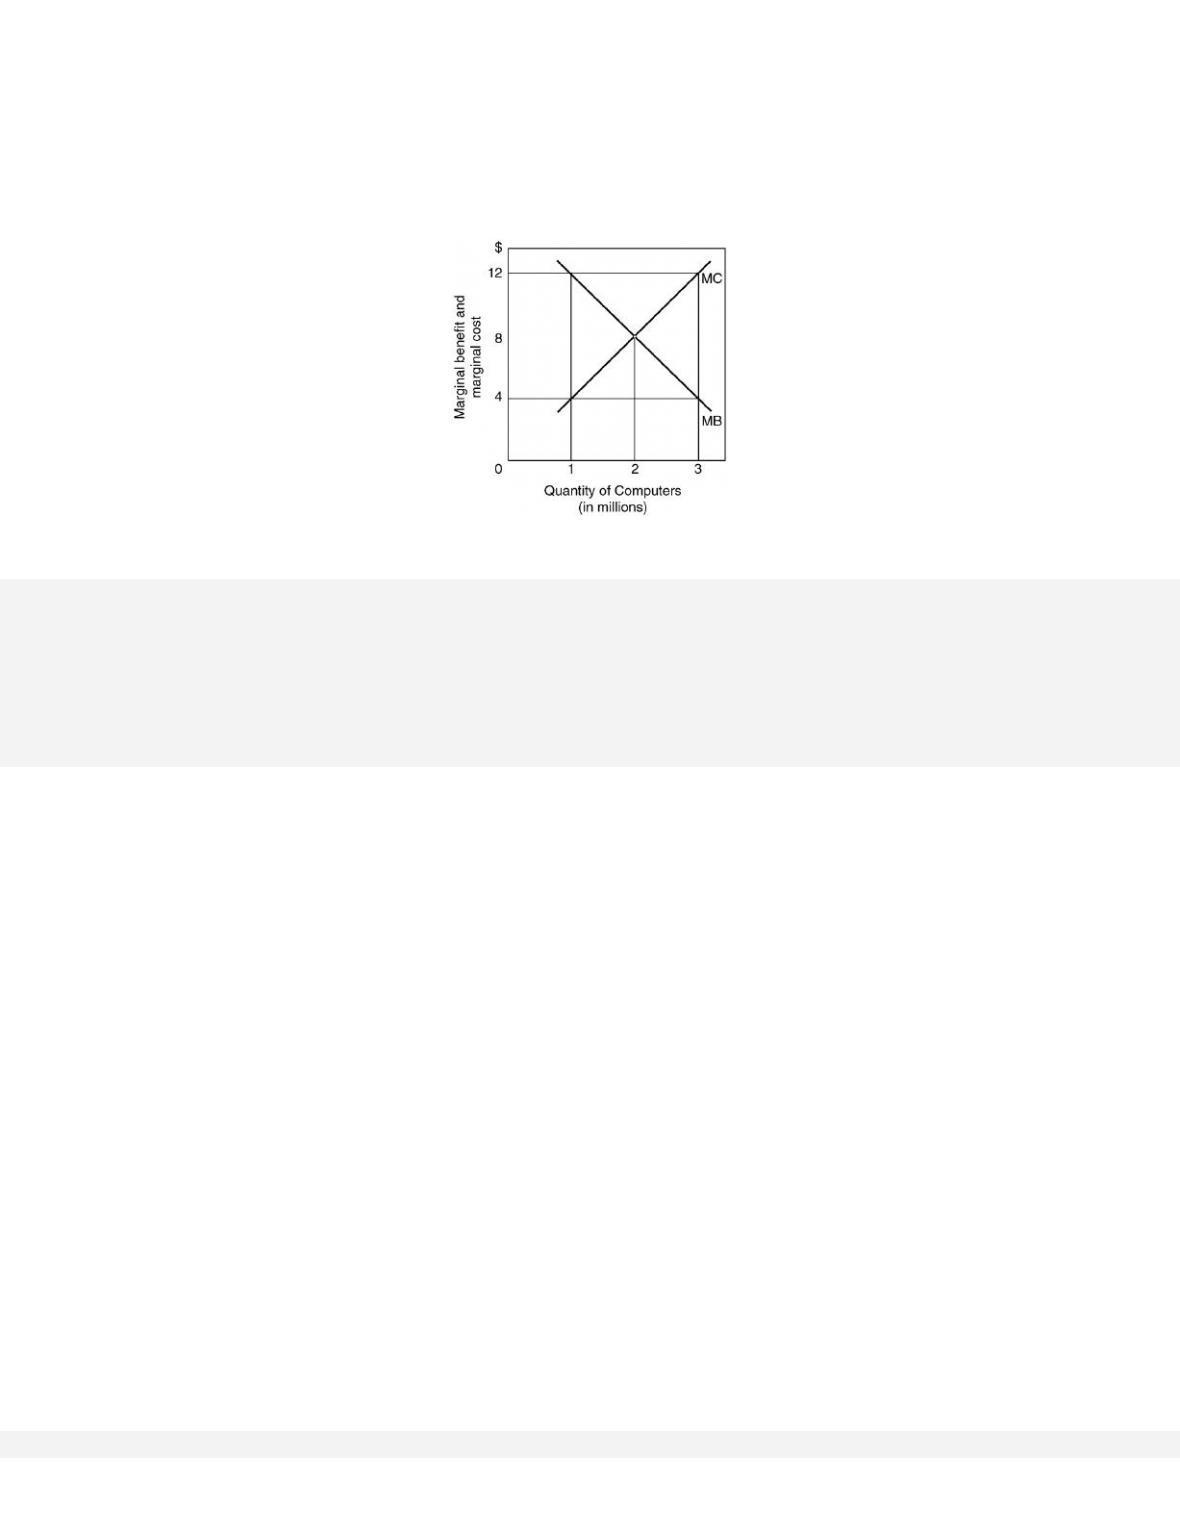
48. In the following graph, explain the relationship between marginal cost and marginal benefit at 1 million
units of output, 2 million units of output, and 3 million units of output for the production of computers. In
your explanation discuss the overallocation of resources, underallocation of resources, and optimal
allocation of resources for the production of computers.
At 1 million units of output, the marginal cost is $4 and the marginal benefit is $12. There is
underallocation of resources to computer production. For each additional computer produced up to 2
1-25
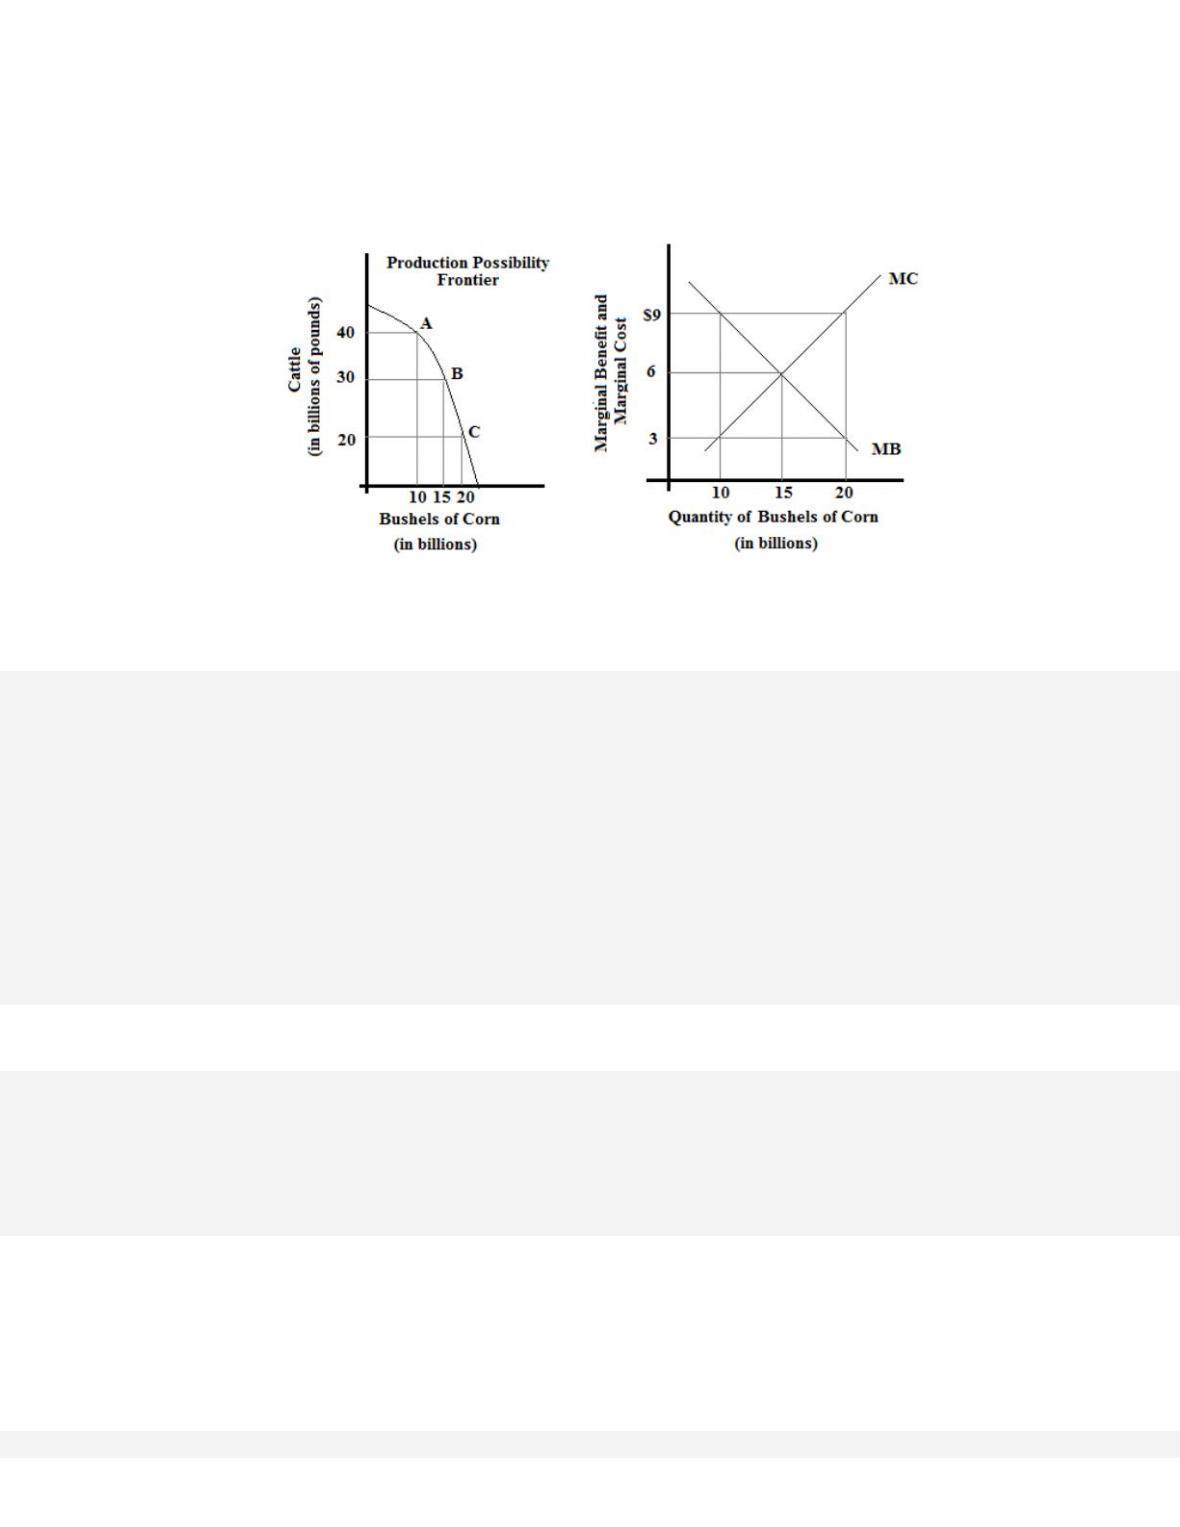
49.Suppose the United States can produce cattle or corn with a given amount of resources. Below is a graph
depicting the production possibility frontier for the United States and the marginal benefit and cost of a
bushel of corn. Discuss the relationship between the marginal cost and marginal benefit of corn and the
production of both corn and cattle.
(a) Discuss the overallocation of resources, underallocation of resources, and optimal allocation of
resources.
(b) When operating at the optimal level of corn production, what is the optimal level of cattle production?
Why is this the optimal amount (why not more or less cattle)?
50. Comment: “We could do a better job of solving the economizing problem by setting our consumption goals
lower rather than by setting our production goals higher.”
1-26
51. (Consider This) Explain what happened to Iraq’s production possibilities curve as a result of: (a) the war
with the United States in 2003; and (b) the rebuilding of the nation after the war.
52. What changes must occur for the potential total output of the economy to grow?
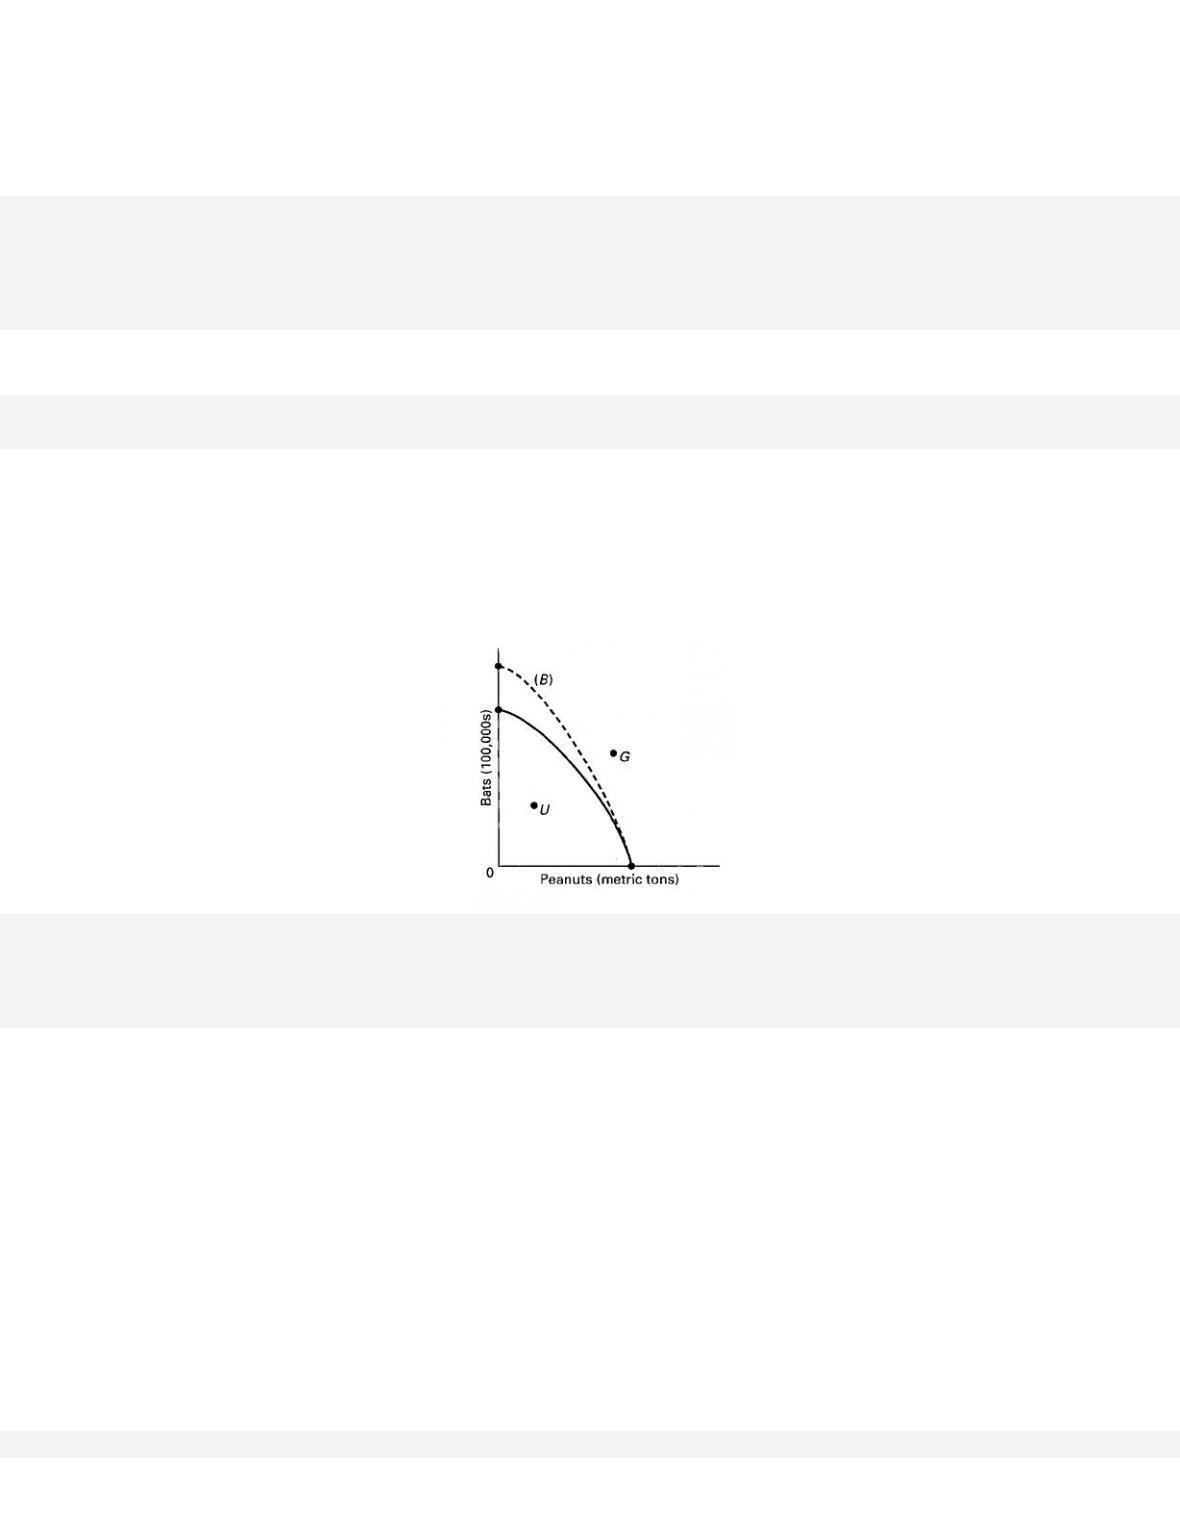
53. Look at the following production possibilities curve illustrating the possibilities in Sluggerville for
producing bats and/ or peanuts with the existing level of resources and technology.
(a) Show a point U that would indicate unemployed resources in Sluggerville.
(b) Draw a new curve B that illustrates the results of improved technology in the production of bats, but no
change in the production efficiency of peanuts.
(c) Show a point G that would indicate a point that is currently unattainable in the production of peanuts
and bats in Sluggerville.
1-27
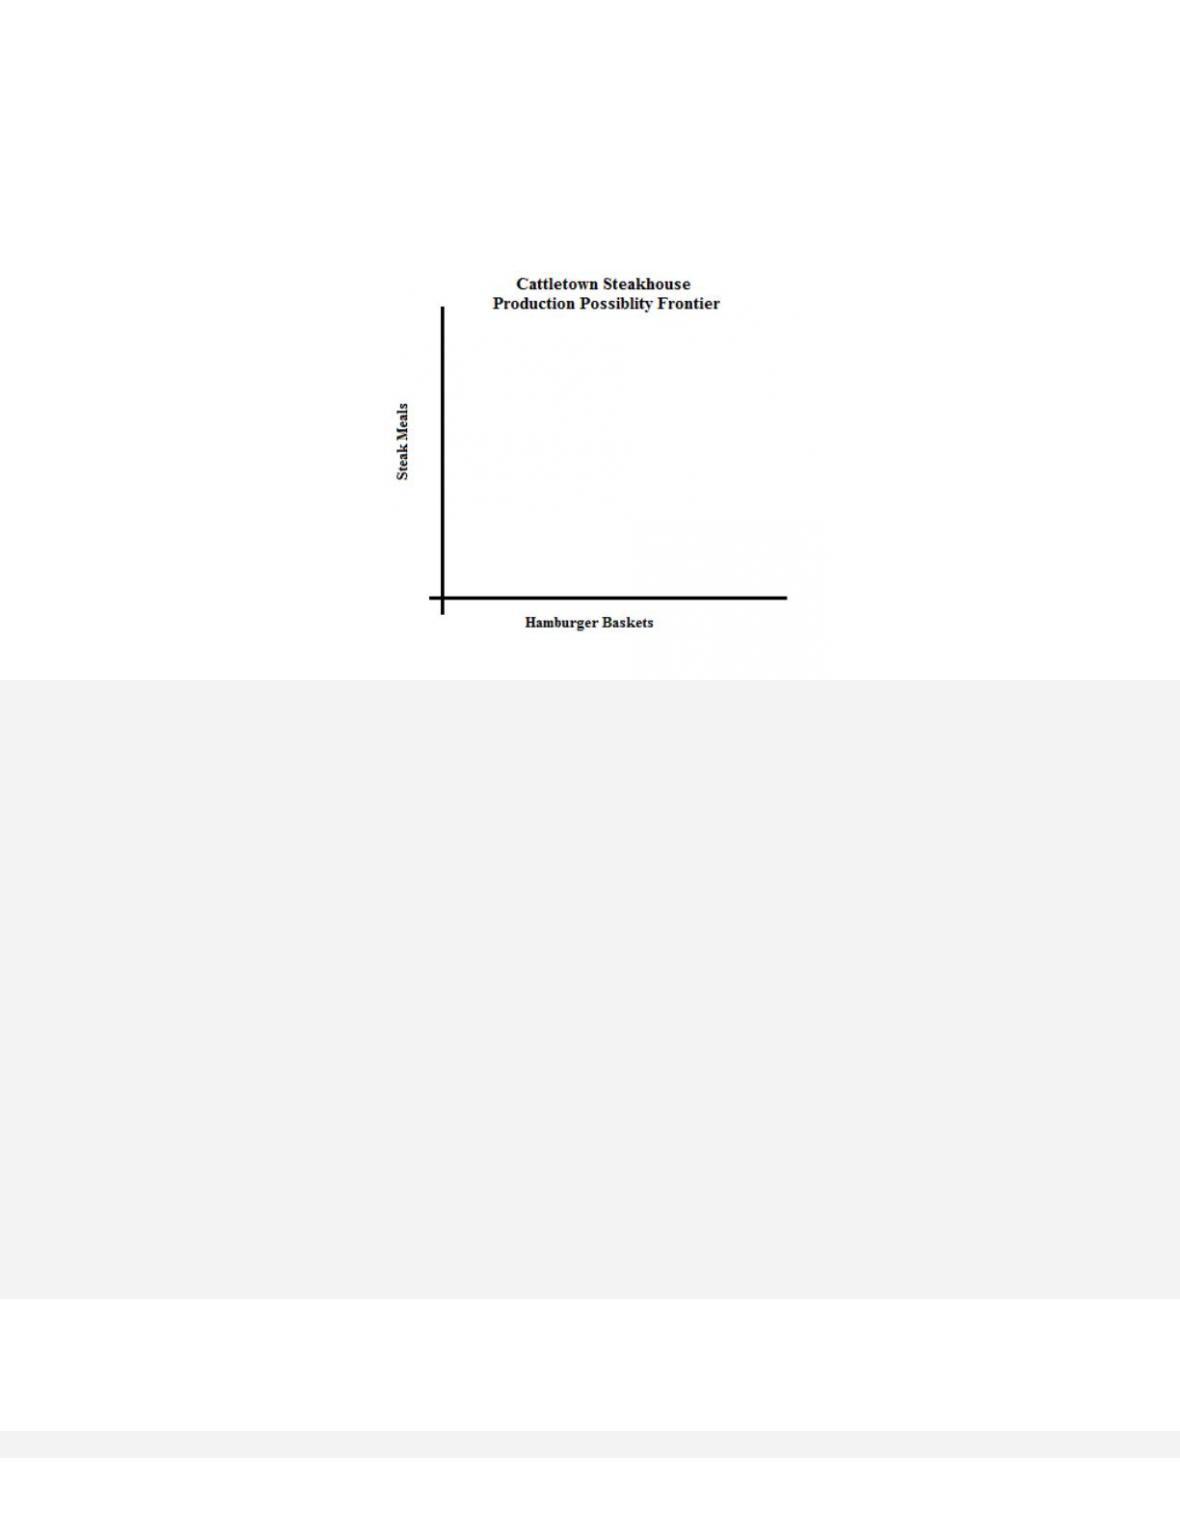
54. Cattletown Steakhouse is a restaurant known for its steak meal and hamburger basket.
(a) Using the below graph draw a production possibility frontier exhibiting increasing opportunity costs.
(b) On the graph label the areas that are attainable and unattainable.
(c) On the graph label a point where resources are fully employed and one where they are underemployed.
(d) Suppose the patty machine (used to produce hamburgers) breaks down, increasing the time it takes to
produce a hamburger basket. Depict this situation on the production possibility frontier.
(a) See graph below. Increasing opportunity costs reflects the bowed shape of the production possibilities

1-28
55. Economic growth is the result of what two factors?
56. What do economists mean when they state that investment is spending on “goods for the future”?
57. One application of the production possibilities concept has been to explain the difference in growth patterns
of a nation with a high level of investment (Alta) and an equivalent nation with a low level of investment
(Zorn). Use the concept to explain why Alta’s economic growth would be greater than that of Zorn over
time.
The application suggests the tradeoff illustrated by a production possibilities curve with consumption
58. The production possibilities curve suggests that a nation cannot live beyond its means or production
potential. Explain why international trade would cause this statement to be modified.

1-29
59. Explain how each event affects production possibilities.
(a) The population becomes more educated over time as the number of high school dropouts falls and the
number of college graduates rises.
(b) The unemployment rate declines from 7.3 to 4.5 percent of the labor force.
(c) Businesses and government are unable to solve a major computer problem, thus reducing economic
efficiency and national output.
(d) Advances in telecommunications and new technology significantly contribute to economic growth
over time.
(e) The Congress and the President decide to allocate more resources to national defense.
(f) A nation participates in increased international trade with other nations of the world.
60. Describe the adjustments in the production possibilities curves in each of the following situations for the
U.S. economy.
(a) the economy moves from full employment into a deep recession
(b) the economy makes great strides in eliminating discrimination
(c) the end of the cold war leads to cuts in military spending
(d) Congress significantly increases government spending for health and education
(a) The economy begins at a point on the curve but with recession there is unemployment and the
economy now operates at a point in the area inside the curve, indicating that production is less than

1-30
61. (Last Word) List and give examples of the five pitfalls to economic thinking.
First, bias and preconceptions can cloud economic thinking. An example would be the belief that “the only
reason people are unemployed is that they are too lazy to work.” Second, economic terminology in the
62. (Last Word) Below are four statements. Each of them is an example of one of the pitfalls often
encountered in the study of economics. Indicate following each statement the type of pitfall involved.
(a) “July is the month with the most ice cream sales and also the month with the most drownings.
Therefore, the more ice cream people eat, the more likely they are to drown.”
(b) “Dry weather in the county where Farmer Brown lives decreased his income because his crop was so
poor. Therefore, when there is dry weather in the nation as a whole all farm incomes will suffer.”
(c) “I have to live within my income. Therefore, governments should not be allowed to borrow money.”
(d) “National health insurance plans are socialistic.”
(a) Causation is confused with correlation. (“Post hoc” fallacy.)
63. (Last Word) What is the fallacy of composition? Give an economic and a non-economic example.
It is the incorrect reasoning that what is true for an individual (or part of a group) is necessarily true for the
whole group. Or, what is true at the micro level of analysis may not be true at the macro level of analysis.
64. (Last Word) Explain the economic fallacy in the statement: “If the Jones family would just cut up their
credit cards and live within their means, they’d be better off. And if consumers in this nation cut up their
credit cards and lived within their means, the nation would be better off.”
This is an example of the fallacy of composition. Cutting up credit cards may be good for the Jones family

1-31
65. (Last Word) Explain what the post hoc fallacy is. Give an example.
66. (Last Word) Explain the difference between correlation and causation and give an example.
Correlation refers to a systematic association between two sets of data (two outcomes). Causation implies
that there is a cause-effect relationship between two events. Correlation does not imply causation. Just
because two events are related in a predictable manner does not necessarily mean that one causes the other.
More must be known about the cause-effect relationship before conclusions about causation can be drawn.
67. (Last Word) Suppose the following were facts relating years of education to average annual income of
individuals. Can you conclude that years of education cause income to increase?
Years of education
Income
0–10
$ 8,000
11–12
15,000
13–15
22,000
16–18
30,000
19–21
35,000
22 and over
52,000

1-32
C. Appendix Questions
68. Why do economists use graphs in their work?
69. In a two-dimensional graph showing the relationship between income and consumption in the economy,
what is shown on the vertical axis and what is shown on the horizontal axis?
70. Define what is meant by a positive or direct relationship between two variables and describe the line graph
depicting such a relationship.
71. Define what is meant by an inverse relationship between two variables and describe the line graph
depicting such a relationship.
72. Show graphically the relationships that you would expect to find between (a) student IQs and grade point
averages (GPAs); (b) the price of a product and the amount consumers will purchase; (c) the temperature
and the number of people at the swimming pool. Which of these are direct relationships and which are
inverse? What considerations might change the expected relationships?
73. Differentiate between the independent and dependent variables in an economic relationship.
74. Show graphically on the below graph the expected relationship between investment spending and interest
rates. Put investment expenditures on the horizontal axis and the rate of interest on the vertical axis;
connect the points and label the curve “Investment demand.” Describe this relationship between the rate of
interest and investment expenditures. Describe the slope of the investment curve.
75. State the definition for the slope of a straight line graph.
76. Use the following table to answer the next three questions.
Consumption
Income
$15,000
$ 20,000
30,000
40,000
45,000
60,000
60,000
80,000
75,000
100,000
(a) What would be the slope of the line if you graphed the relationship between consumption and income?
(Consumption would be on the vertical axis and income on the horizontal axis.) Explain how the slope
is calculated.
(b) How does the slope of this line reflect marginal changes? Give a numerical explanation.
77. A graph shows the quantity for Product A on the vertical axis and the quantity for Product B on the
horizontal axis. What is the proper interpretation of a vertical line at a particular quantity for Product B
that is parallel to the vertical axis of the graph? What is the slope of the vertical line?
1-33
78. A graph shows the quantity of corn on the vertical axis and the quantity of steel on the horizontal axis.
What is the proper interpretation of a horizontal line at a particular quantity for corn that is parallel to the
horizontal axis of the graph? What is the slope of the horizontal line?
79. There are two sets of x, y points on a straight line in a two-variable graph with y on the vertical axis and x
on the horizontal axis. What would be the linear equation for the line if one set of points was (0, 9) and the
other set was (13, 61)?
80. The value of the vertical intercept is $150 and the slope is −25 in a linear equation for price and quantity
demanded. If price is $5.00, what is the quantity demanded? State the linear equation and show how you
found the answer.
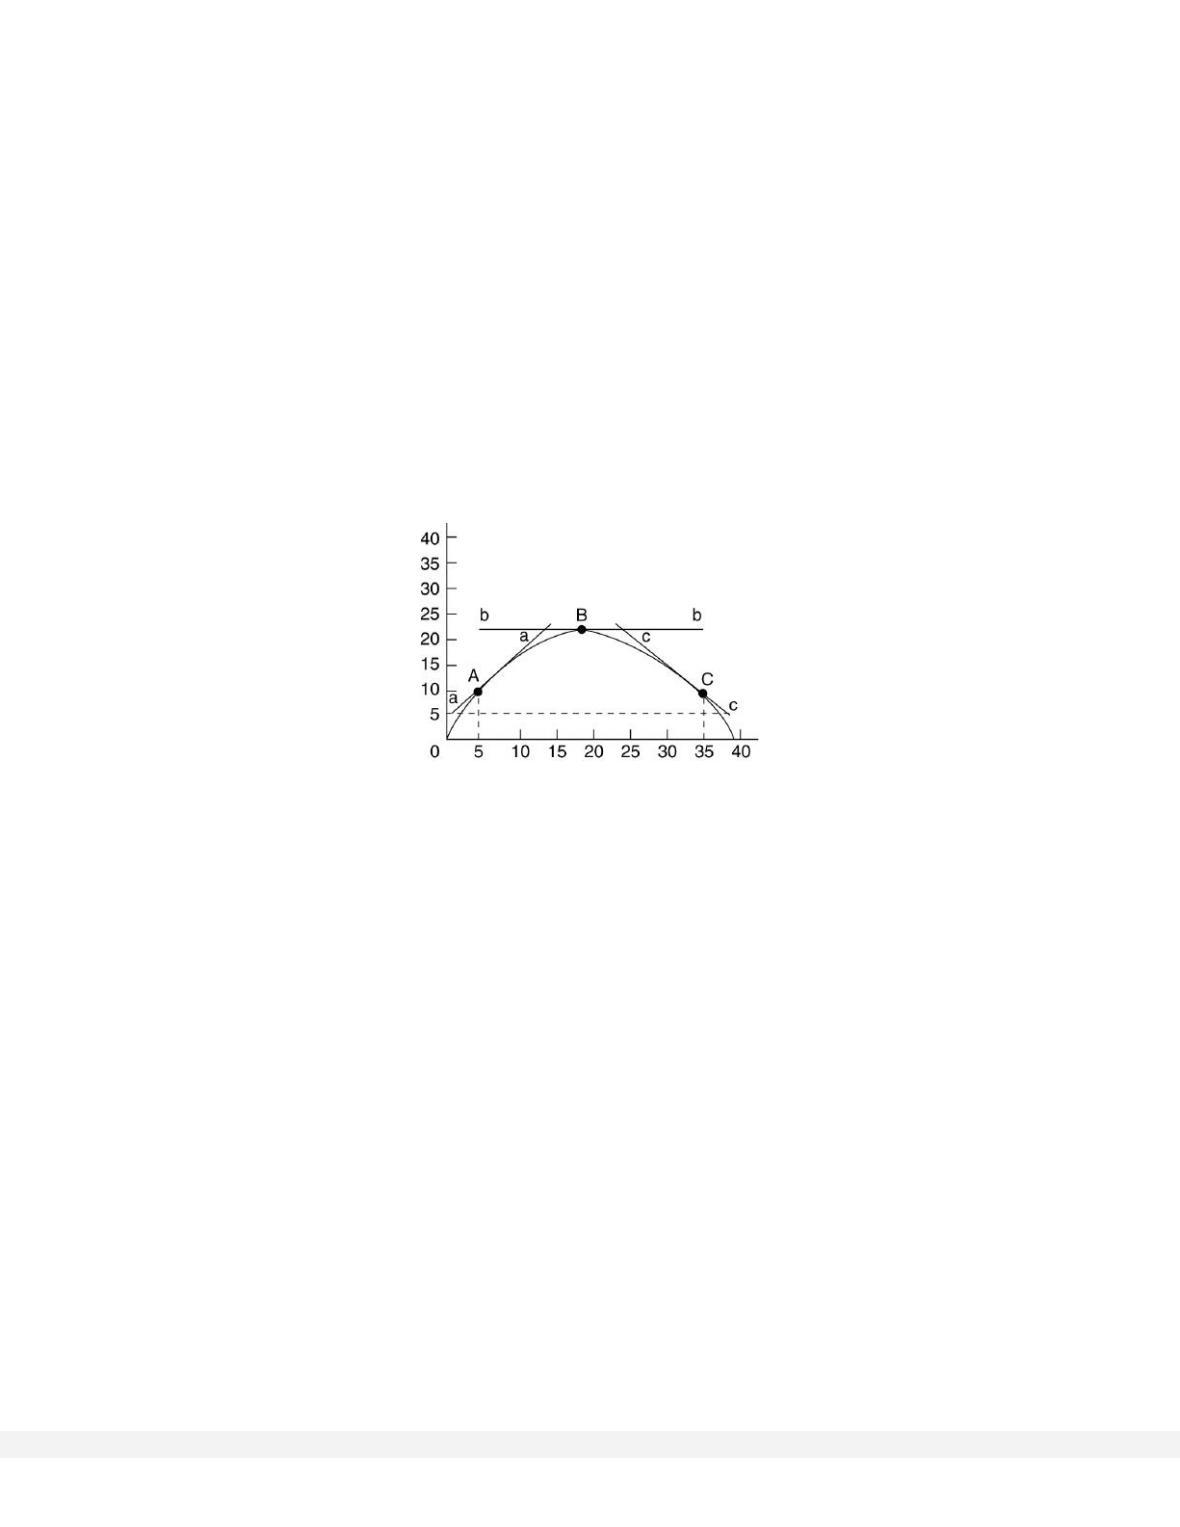
81. How do you determine the slope of a nonlinear curve? Will the slope be the same along the curve?
Explain.
82. Using the below graph give the slopes of the straight lines tangent to the curve at points A, B, and C.

1-34
D. Answers to Appendix Questions
68. Why do economists use graphs in their work?
69. In a two-dimensional graph showing the relationship between income and consumption in the economy,
what is shown on the vertical axis and what is shown on the horizontal axis?
70. Define what is meant by a positive or direct relationship between two variables and describe the line graph
depicting such a relationship.
71. Define what is meant by an inverse relationship between two variables and describe the line graph
depicting such a relationship.
1-35
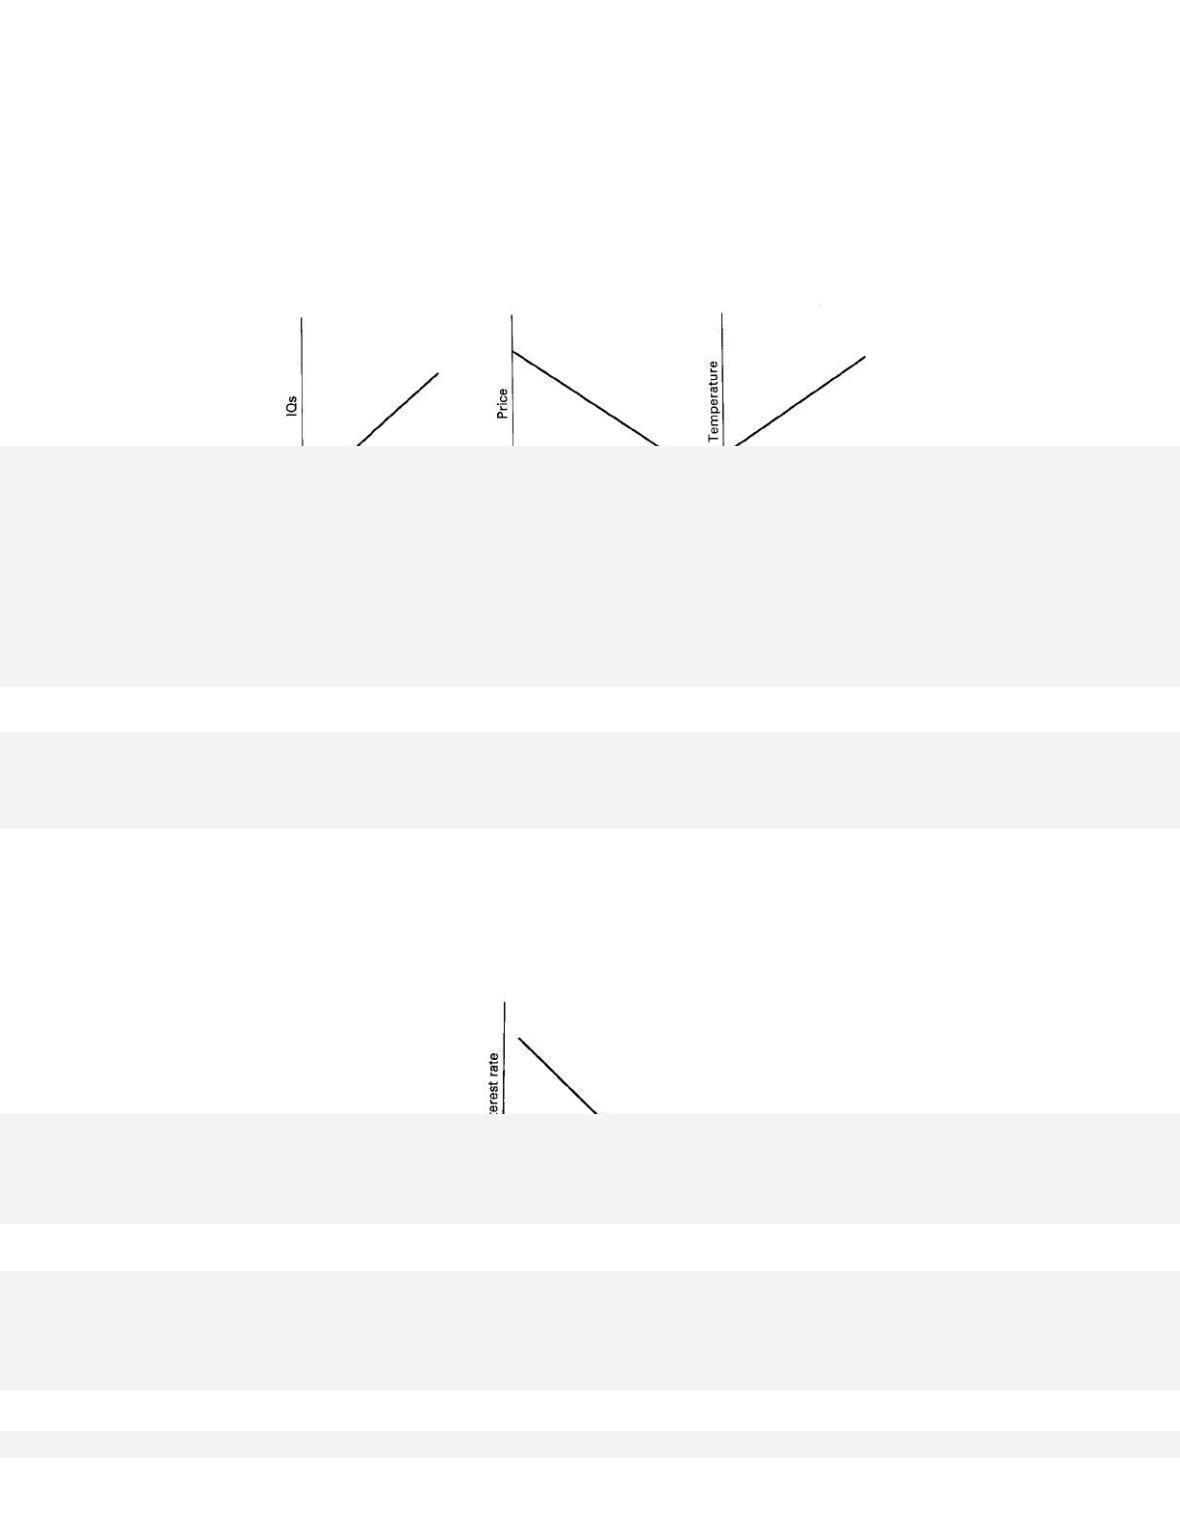
72. Show graphically the relationships that you would expect to find between (a) student IQs and grade point
averages (GPAs); (b) the price of a product and the amount consumers will purchase; (c) the temperature
and the number of people at the swimming pool. Which of these are direct relationships and which are
inverse? What considerations might change the expected relationships?
The direct relationships expected are (a) IQs and grade point averages, and (c) the temperature and the
number of people at the pool. The inverse relationship expected is between price and quantity purchased.
73. Differentiate between the independent and dependent variables in an economic relationship.
74. Show graphically on the below graph the expected relationship between investment spending and interest
rates. Put investment expenditures on the horizontal axis and the rate of interest on the vertical axis;
connect the points and label the curve “Investment demand.” Describe this relationship between the rate of
interest and investment expenditures. Describe the slope of the investment curve.
The relationship between the interest rate and investment expenditures is inverse. The slope of the
investment curve is downsloping or negative.
75. State the definition for the slope of a straight line graph.
Investment
demand

1-36
76. Use the following table to answer the next three questions.
Consumption
Income
$15,000
$ 20,000
30,000
40,000
45,000
60,000
60,000
80,000
75,000
100,000
(a) What would be the slope of the line if you graphed the relationship between consumption and income?
(Consumption would be on the vertical axis and income on the horizontal axis.) Explain how the slope
is calculated.
(b) How does the slope of this line reflect marginal changes? Give a numerical explanation.
77. A graph shows the quantity for Product A on the vertical axis and the quantity for Product B on the
horizontal axis. What is the proper interpretation of a vertical line at a particular quantity for Product B
that is parallel to the vertical axis of the graph? What is the slope of the vertical line?
78. A graph shows the quantity of corn on the vertical axis and the quantity of steel on the horizontal axis.
What is the proper interpretation of a horizontal line at a particular quantity for corn that is parallel to the
horizontal axis of the graph? What is the slope of the horizontal line?
79. There are two sets of x, y points on a straight line in a two-variable graph with y on the vertical axis and x
on the horizontal axis. What would be the linear equation for the line if one set of points was (0, 9) and the
other set was (13, 61)?
80. The value of the vertical intercept is $150 and the slope is −25 in a linear equation for price and quantity
demanded. If price is $5.00, what is the quantity demanded? State the linear equation and show how you
found the answer.
81. How do you determine the slope of a nonlinear curve? Will the slope be the same along the curve?
Explain.

1-37
82. Using the below graph give the slopes of the straight lines tangent to the curve at points A, B, and C.


