Chapter 2 Modeling a Business Key
1. Where the graphs of supply and demand functions intersect, the market is in equilibrium.
2. Jeff prepares meals in the home of his customers. His fixed cost for transportation and supplies is $14.50. The
labor and groceries needed for each family meal is $8.80, so the expense function is E = 5.7q + 8.8.
3. The dashed line represents the expense function, and the solid line represents the revenue function.
4. When a correlation coefficient is near 1, there is little or no correlation between corresponding variables.
5. A company manufactures and sells cutting boards for $7 wholesale and recommends a markup of $2.70 for a
selling price of $4.30.

7. A scatterplot is graphed with the time it takes a child to get dressed in the morning on the horizontal axis, and
the child’s age in years on the vertical axis. The graph shows a negative correlation because the time decreases
as the age of the child increases.
8. The Cacti company manufactures and sells succulent gardens. The gardens have an expense equation of E =
4.7q + 34,000. The average cost per garden is $12.50 when 2,500 are produced.
9. The price that a manufacturer charges a retailer for an item is the wholesale price.
10. The costs for postage and packaging are examples of fixed expenses.
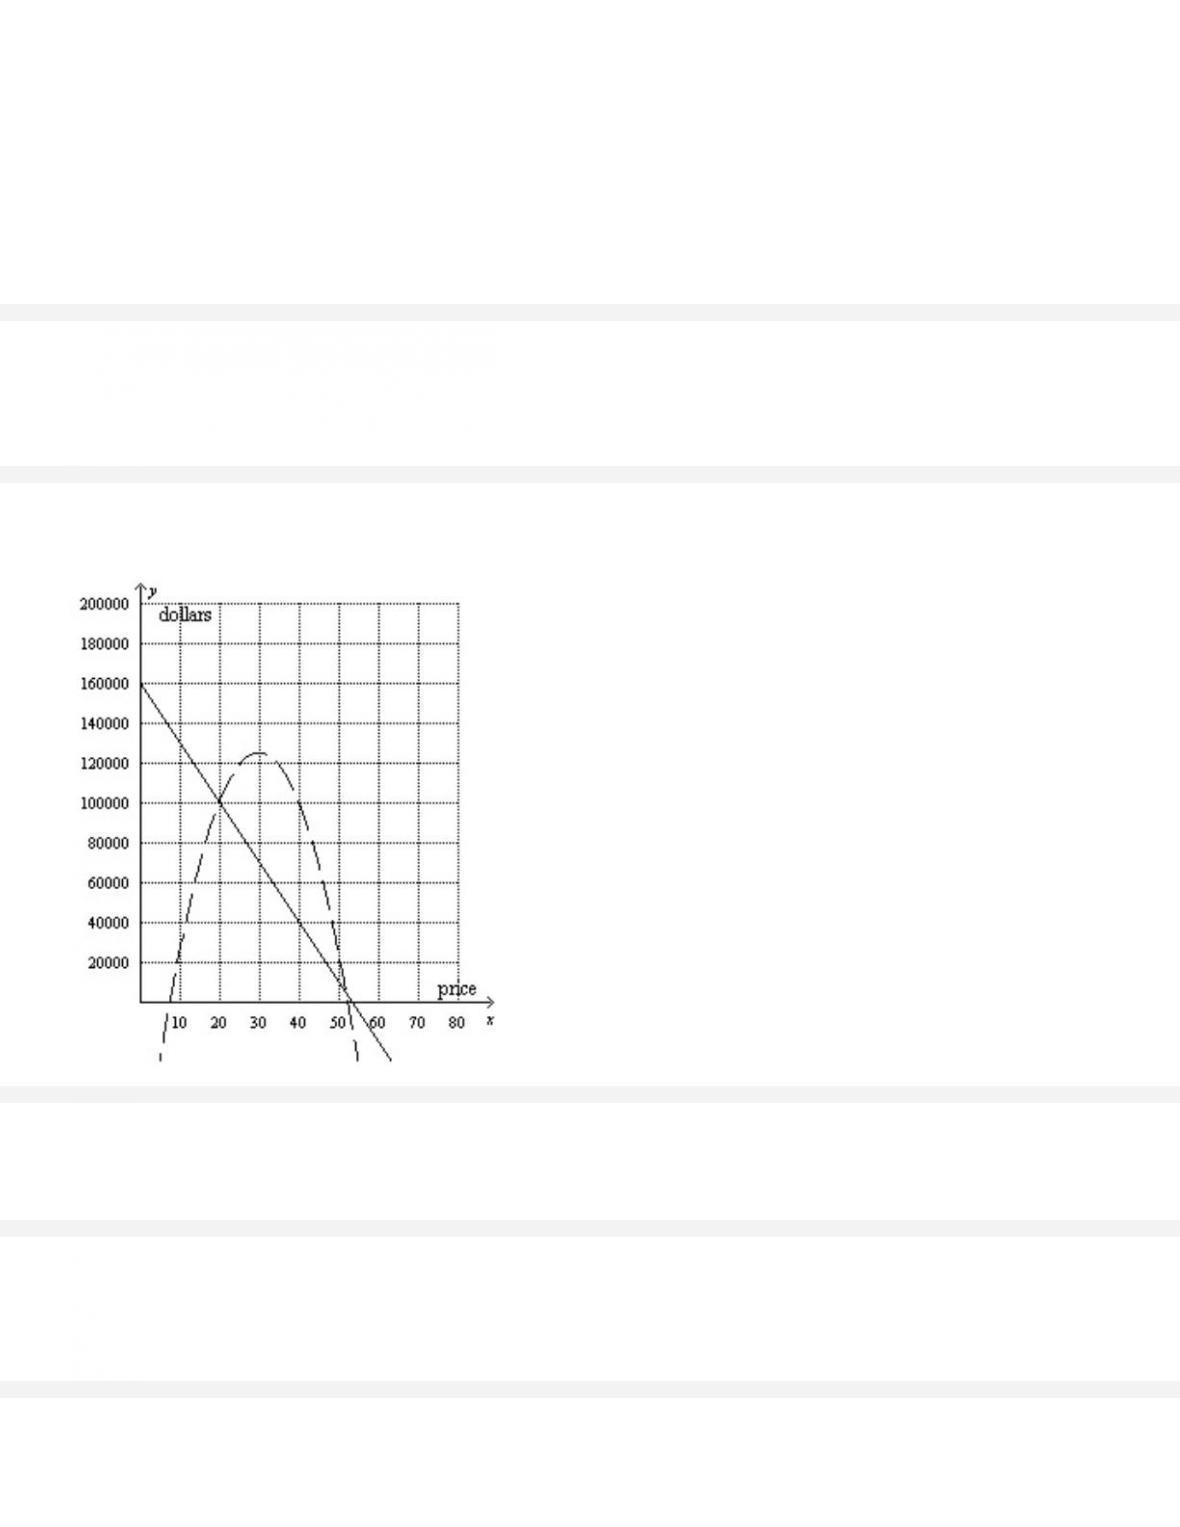
11. Marsha used a graphing calculator to graph an expense and a revenue function for her family’s printing
business. The graph looked like the one below. What are the approximate breakeven points?
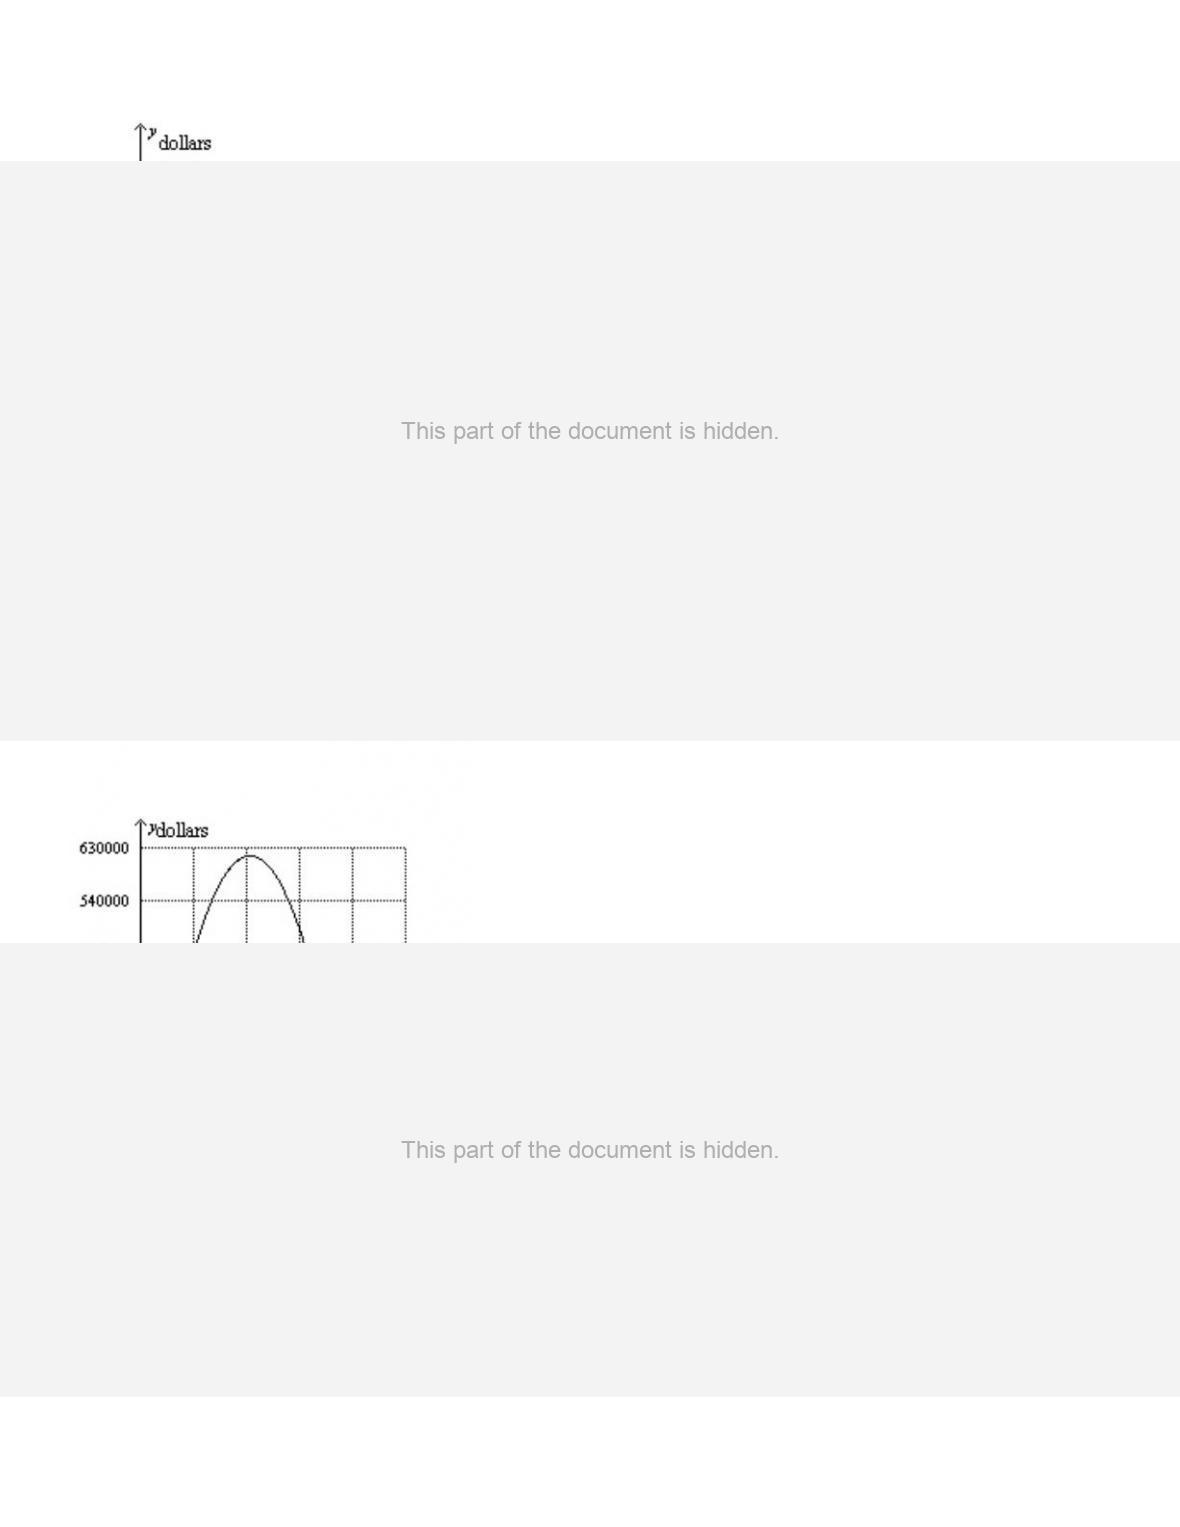
12. Examine the graph below. At what price is the maximum profit?
13. McKenzie found the correlation coefficient on a set of data to be –0.20. Which term best describes the
correlation?
14. The graph shows the supply and demand curves for a Cajun spice mix that Leroy manufactures in a home
business.
15. A new company manufactures tennis rackets. The fixed expenses are $78,490 and the variable expenses are
$14 per racket produced. What is the expense of producing 3,500 rackets?
16. A demand function for step stools manufactured by U-Step is q = –720p + 20,500. What is the revenue if
the price per step stool is $18?
17. In the ordered pairs, the first coordinate is the price, p, and the second is the quantity, q: (250, 5,000), (100,
8,500), (450, 2,000), (300, 5,000), ( 200, 4,750). When the points are plotted in a scatterplot, what is the
correlation coefficient?
18. Which is the regression equation for a scatterplot with these points rounded to the nearest tenth: (4, 35),
(6.5, 92), (2, 10), (5, 50), (6, 85), (10, 110)?
19. A company that produces lawn chairs uses market surveys and linear regression to develop a demand
function based on the wholesale price. The demand function is q = –110p + 7,500. At a price of $45, how many
lawn chairs are demanded?
20. Maxine works at an amusement park. She recorded the number of ice cream cones sold each day, along with
the high temperature in Fahrenheit degrees. Using her data, she wrote a linear regression equation of y = 9x –
487. If the temperature, or x, is 85F, how many ice cream cones could Maxine expect to sell?
21. What is it called when the expenses and the revenue are equal, so there is no profit or loss?
breakeven point
22. A company makes flower pots. The flower pots have an expense equation of E = 2.75q + $24,582. What is
the fixed cost in the expense function?
23. What kind of data does a scatterplot use?
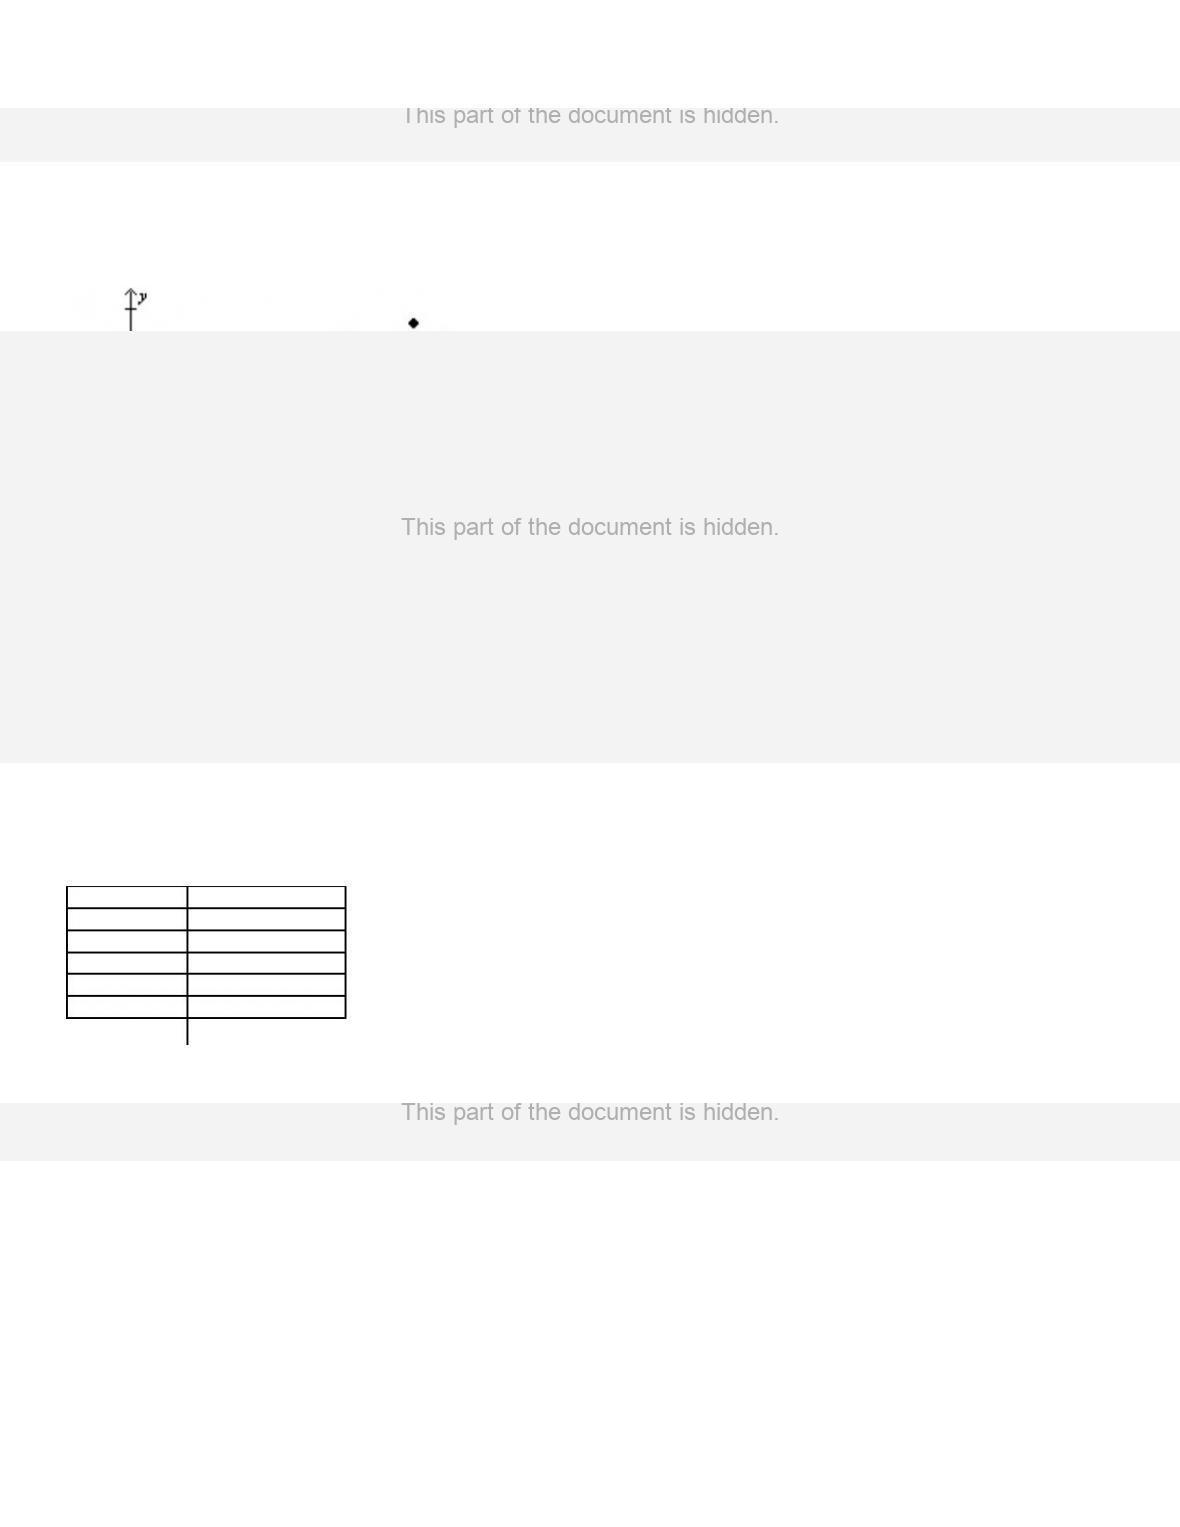
24. Does the graph below have a positive, negative, or no correlation?
25. Catalina’s mother recorded her height each year. The table below shows her height, in inches.
Age
Height (in.)
5
36
6
40
7
42
8
47
9
50
Find the equation of the regression line.
26. The graph shows the supply and demand for a widget. What happens if the price is set at $25?
27. Toby’s Tiny Toys have an expense equation of E = 12.45q + 53,900. Toby’s sell their toys for $16.50 a
piece, and their revenue equation is R = 16.5q. How many tiny toys do they have to sell to reach their breakeven
point?
28. AAA Dance Shoes makes dancing shoes with leather soles. The shoes cost $29 to manufacturer. The fixed
cost for the product line is $45,000. The company has determined their demand function to be q = –200p +
30,000, where p is the price for each pair of shoes. Write the expense and revenue functions in terms of price.
29. In what shape is the graph of a revenue function?

30. Nancy works at a health club. She notices that the clients that run on the track for a longer period of time go
a longer distance. If this is a causal relationship, explain the explanatory and response variables.