Chapter 3: Comparative Advantage
MULTIPLE CHOICE
1. The value of a good that is given up to produce another is:
a. Dollar cost
b. Opportunity cost
c. Relative cost
d. Absolute cost
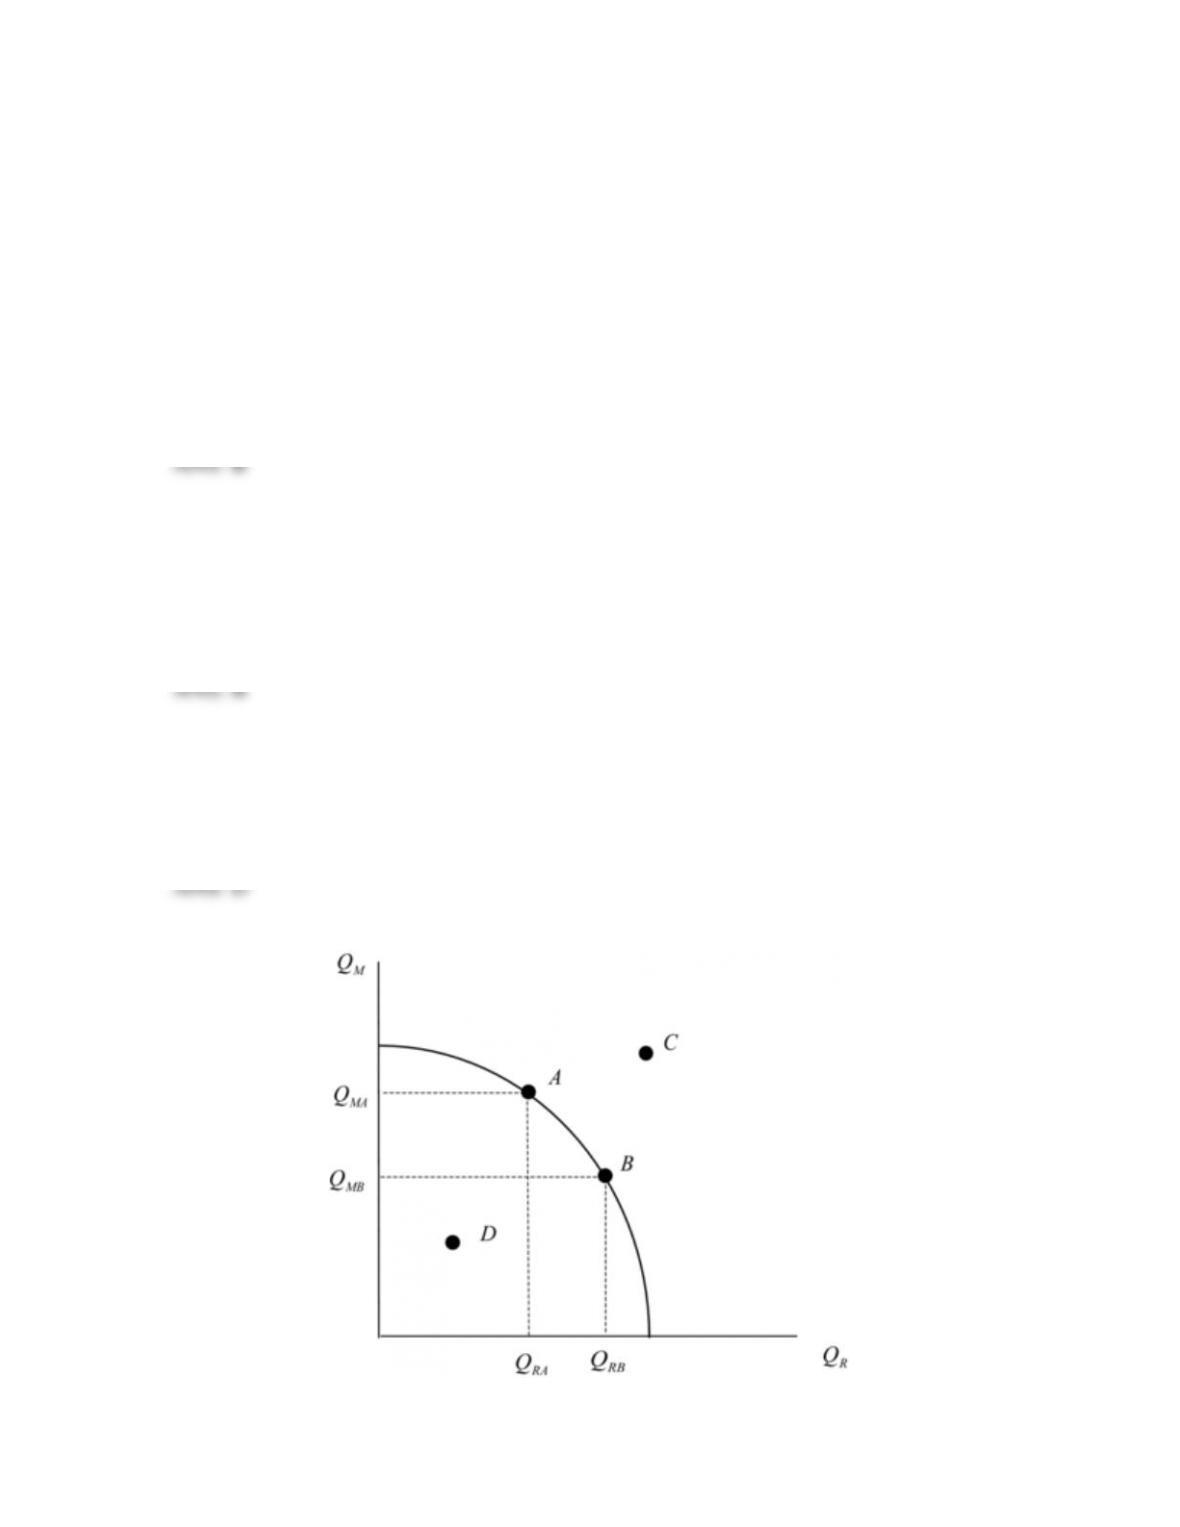
2. Any point on the production possibilities frontier (PPF) depicts:
a. Minimum cost of production
b. Maximum quantities of the two gods the economy can produce
c. Unemployment
d. High economic growth
3. The production possibilities frontier (PPF) demonstrates:
a. Opportunity cost
b. Scarcity of resources
c. Maximum production levels
d. All of the above

4. In the diagram above, movement between which two points signified an increase in
economic efficiency?
a. A to B
b. A to D
c. D to B
d. B to D
5. For this economy to move to point C, it must:
a. Achieve lower input costs
b. Introduce new technologies that increase productivity
c. Reduce trade barriers
d. a and b
TRUE/FALSE
1. Countries with absolute advantage in no products will not be able to engage in
international trade.
2. A country could have an absolute disadvantage in a product but still export this product
because of its comparative advantage.
3. Revealed comparative advantage is a measure of intra-industry trade.
4. International trade on the basis of comparative advantage is always damaging for the
environment.
5. In the comparative advantage model, the gains from trade appear as a movement of the
consumption point to the northeast in the production possibilities frontier (PPF) diagram.
SHORT ANSWER
1. What does Japan’s production possibilities frontier (PPF) for rice and motorcycles
depict?
2. Define opportunity cost of rice in terms of motorcycles.
3. In a two-country, two-product case of international trade, how can the two countries both
be better off?
4. Why are production possibilities frontiers (PPFs) concave to the origin?
5. How can we determine the relative price of the good on the horizontal axis of a
production possibilities frontier (PPF)?
6. In the comparative advantage model, how do we visualize the gains from trade?
7. Do the gains from trade imply that every individual or group in the country gains? Why
or why not?