NAME 75
tables below report total current consumption expenditures and expendi-
tures on certain major categories of goods for 5 different income groups
in the United States in 1961. People within each of these groups all had
similar incomes. Group Ais the lowest income group and Group Eis the
highest.
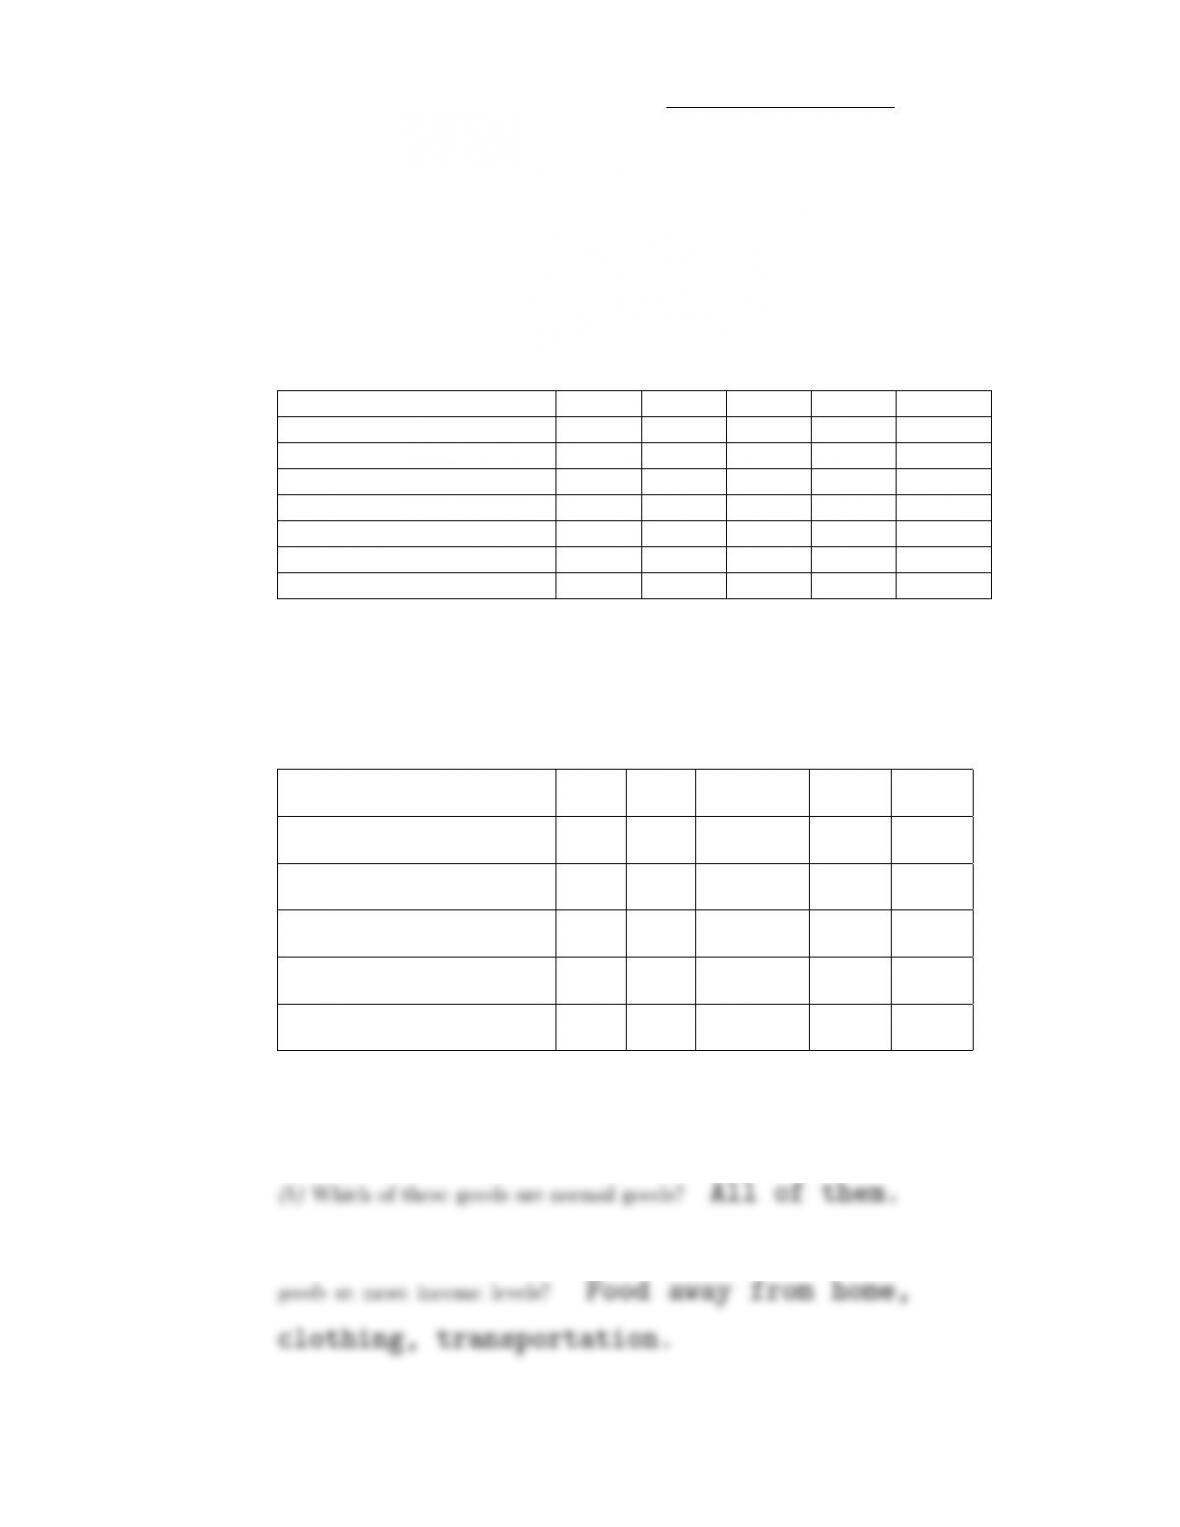
Table 6.1
Expenditures by Category for Various Income Groups in 1961
Income Group A B C D E
Food Prepared at Home 465 783 1078 1382 1848
Food Away from Home 68 171 213 384 872
Housing 626 1090 1508 2043 4205
Clothing 119 328 508 830 1745
Transportation 139 519 826 1222 2048
Other 364 745 1039 1554 3490
Total Expenditures 1781 3636 5172 7415 14208
Table 6.2
Percentage Allocation of Family Budget
Income Group A B C D E
Food Prepared at Home 26 22 21 19 13
Food Away from Home 3.8 4.7 4.1 5.2 6.1
Housing 35 30 29 28 30
Clothing 6.7 9.0 9.8 11 12
Transportation 7.8 14 16 17 14
(a) Complete Table 6.2.
(c) Which of these goods satisfy your textbook’s definition of luxury
76 DEMAND (Ch. 6)
(d) Which of these goods satisfy your textbook’s definition of necessity
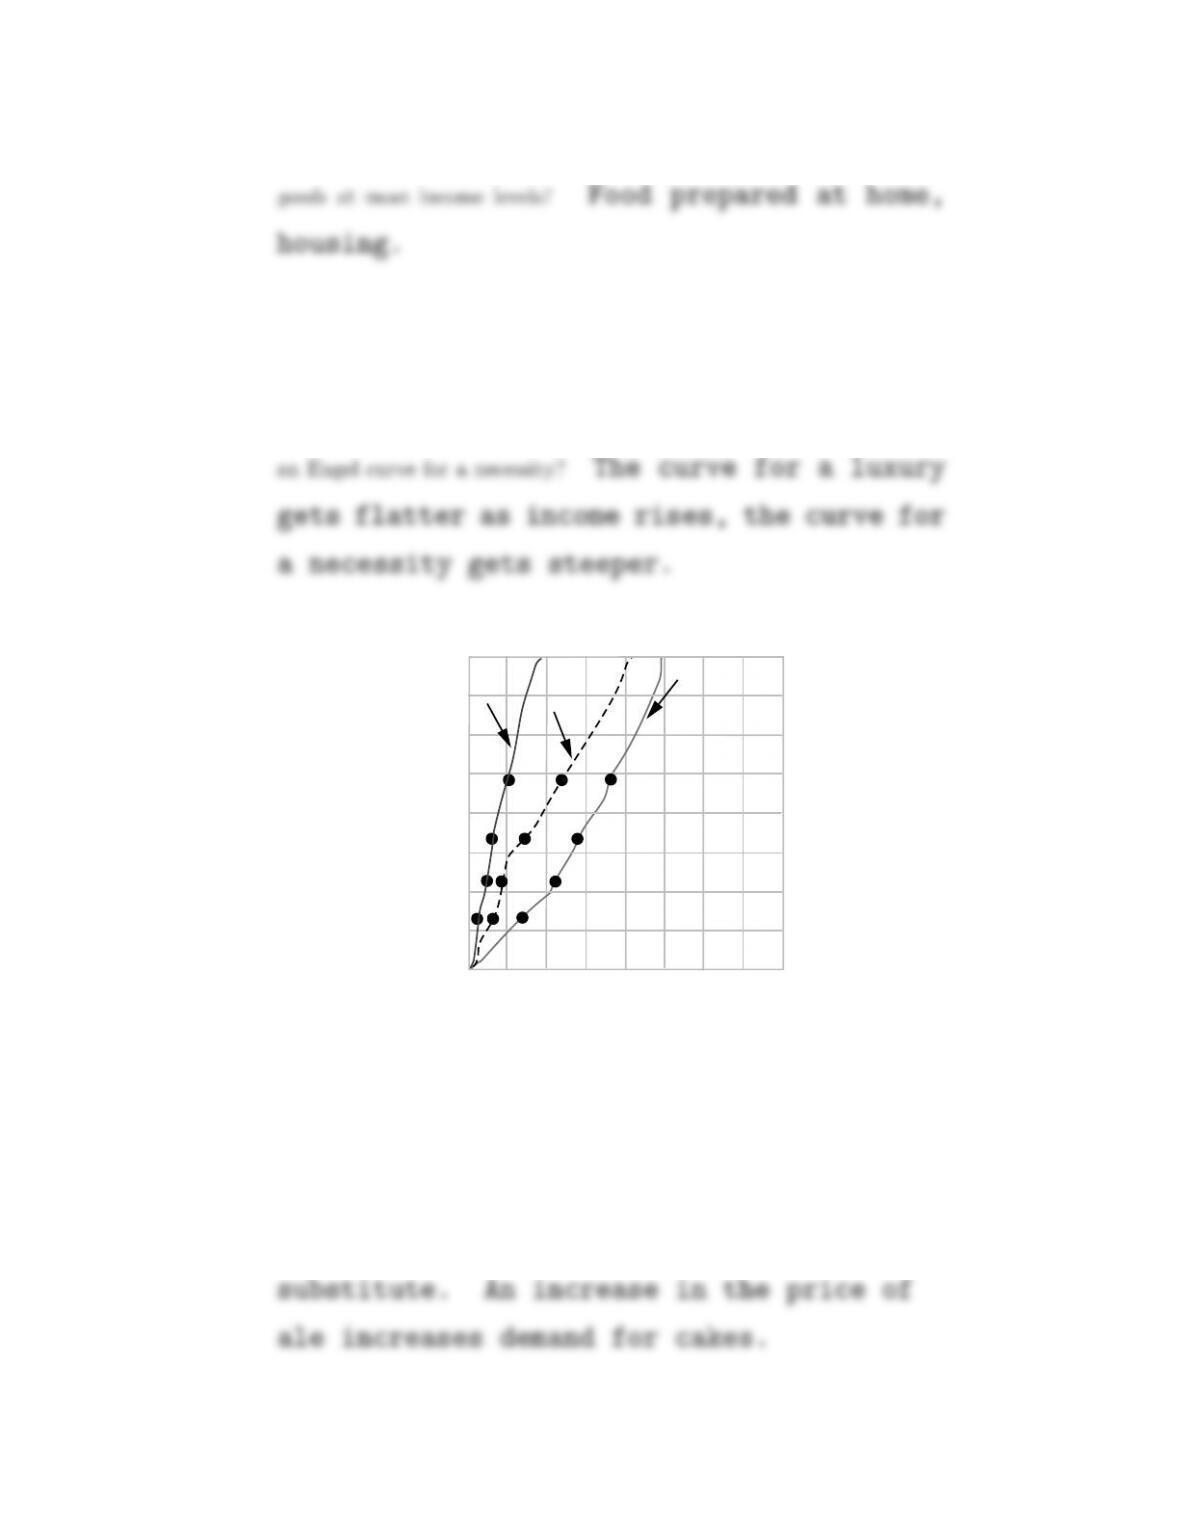
(e) On the graph below, use the information from Table 6.1 to draw
“Engel curves.” (Use total expenditure on current consumption as income
for purposes of drawing this curve.) Use red ink to draw the Engel curve
for food prepared at home. Use blue ink to draw an Engel curve for food
away from home. Use pencil to draw an Engel curve for clothing. How
does the shape of an Engel curve for a luxury differ from the shape of
0 750 1500 2250 3000
3
6
9
Total expenditures (thousands of dollars)
12
Expenditure on specific goods
Red line
Blue
line Pencil
line
6.10 (0) Percy consumes cakes and ale. His demand function for cakes
is qc=m−30pc+20pa,wheremis his income, pais the price of ale, pc
is the price of cakes, and qcis his consumption of cakes. Percy’s income
is $100, and the price of ale is $1 per unit.
(a) Is ale a substitute for cakes or a complement? Explain. A
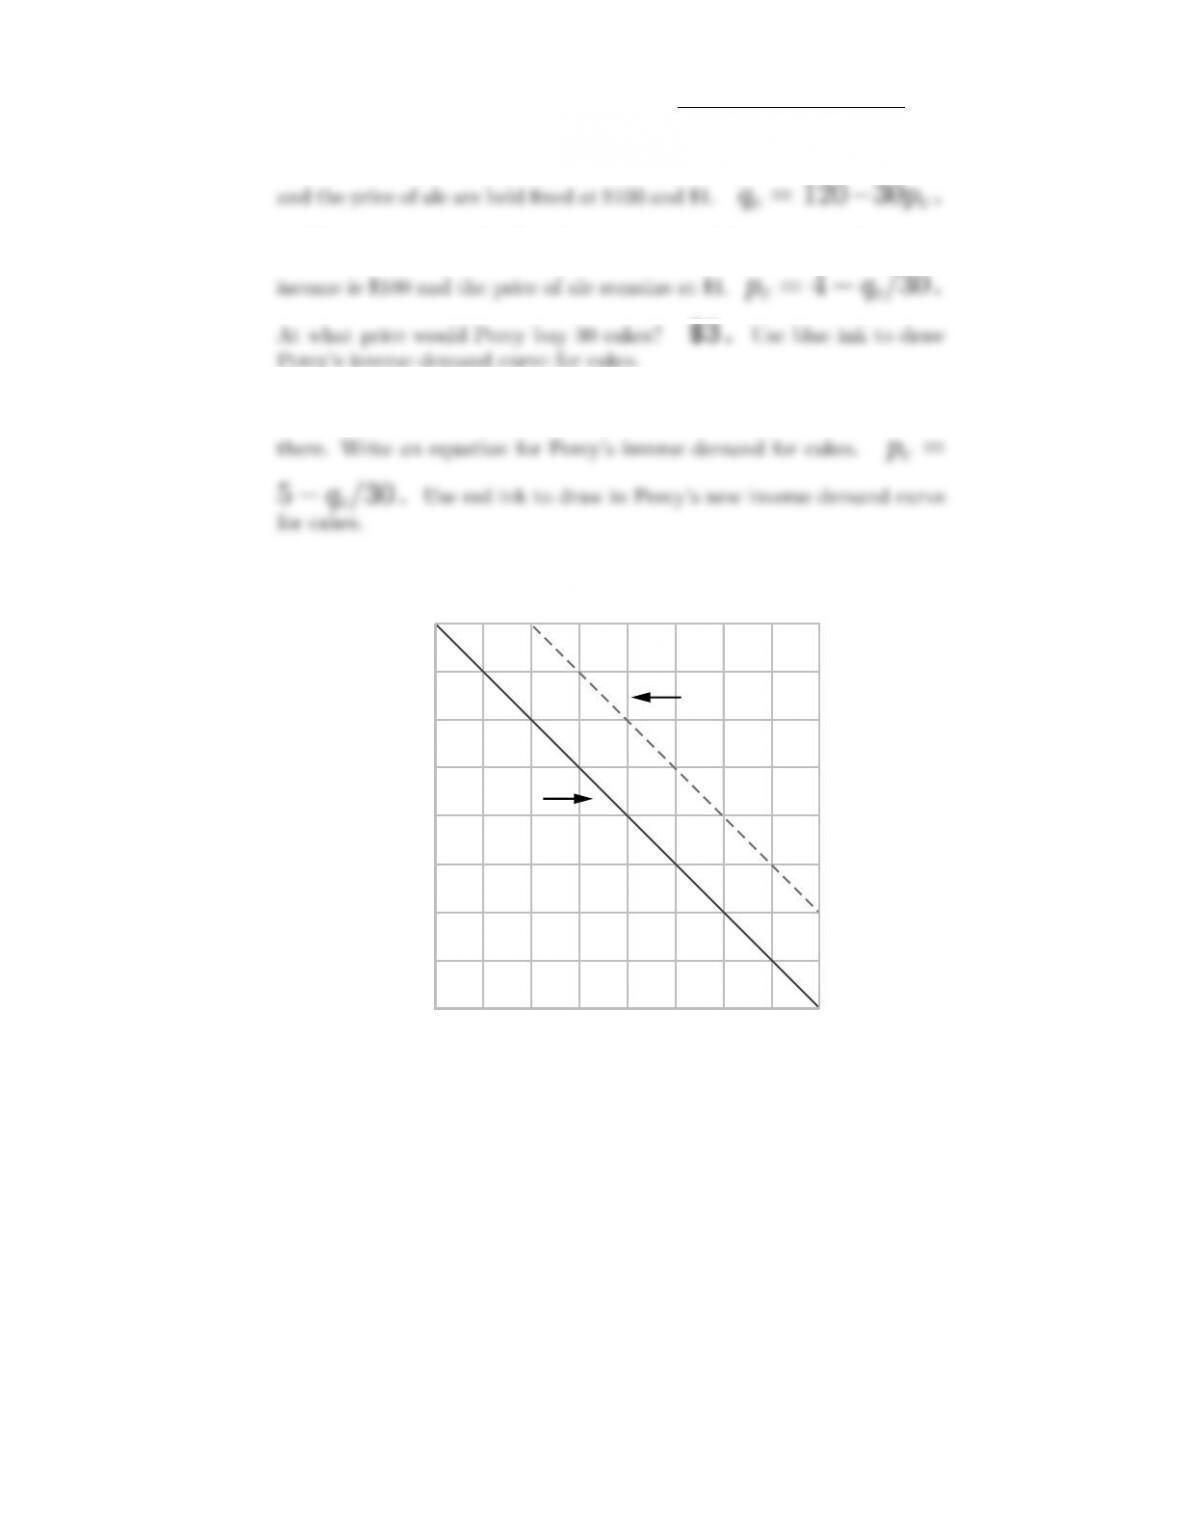
NAME 77
(b) Write an equation for Percy’s demand function for cakes where income
(c) Write an equation for Percy’s inverse demand function for cakes where
Percy’s inverse demand curve for cakes.
(d) Suppose that the price of ale rises to $2.50 per unit and remains
0306090
120
1
2
3
Number of cakes
Price
4
Blue Line
Red Line
6.11 (0) Richard and Mary Stout have fallen on hard times, but remain
rational consumers. They are making do on $80 a week, spending $40 on
food and $40 on all other goods. Food costs $1 per unit. On the graph
below, use black ink to draw a budget line. Label their consumption
bundle with the letter A.
(a) The Stouts suddenly become eligible for food stamps. This means
that they can go to the agency and buy coupons that can be exchanged
for $2 worth of food. Each coupon costs the Stouts $1. However, the
maximum number of coupons they can buy per week is 10. On the graph,
draw their new budget line with red ink.
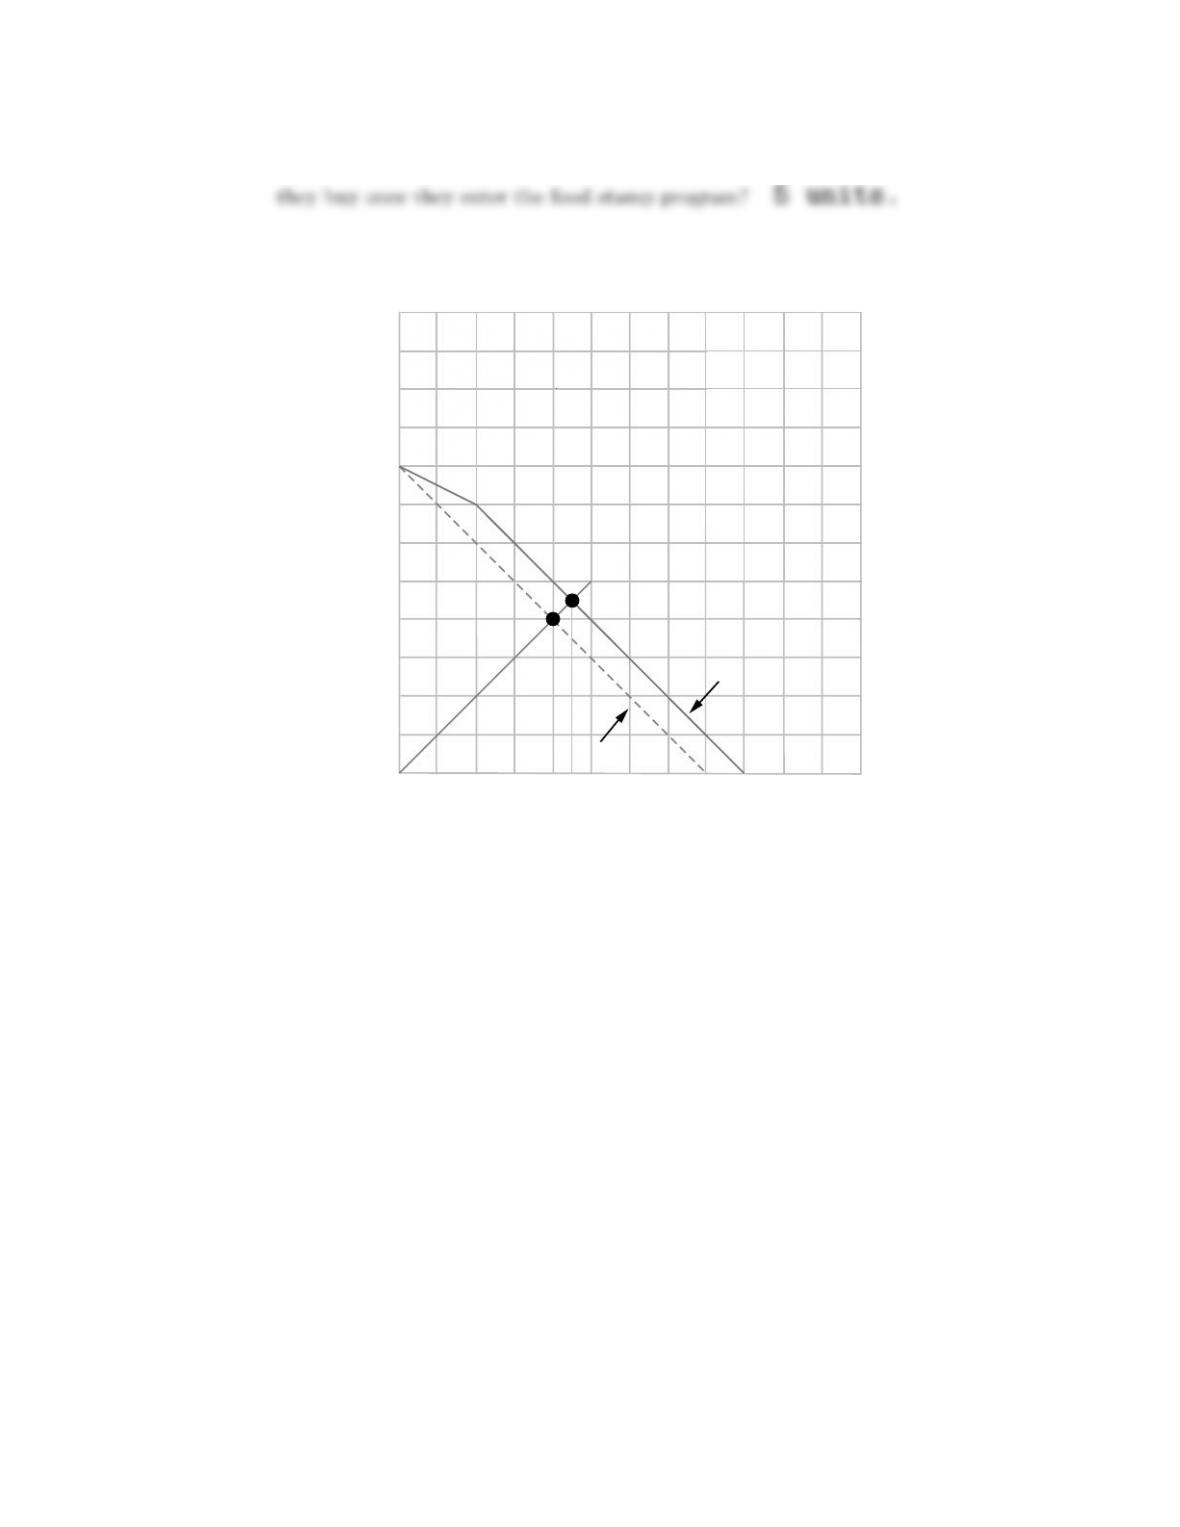
78 DEMAND (Ch. 6)
(b) If the Stouts have homothetic preferences, how much more food will
0 40 60 80 100 120
20
40
60
80
100
Dollars worth of other things
120
20
aNew consumption point
45
Red budget line
Black budget line
Food
Calculus 6.12 (2) As you may remember, Nancy Lerner is taking an economics
course in which her overall score is the minimum of the number of correct
answers she gets on two examinations. For the first exam, each correct
answer costs Nancy 10 minutes of study time. For the second exam, each
correct answer costs her 20 minutes of study time. In the last chapter,
you found the best way for her to allocate 1200 minutes between the two
exams. Some people in Nancy’s class learn faster and some learn slower
than Nancy. Some people will choose to study more than she does, and
some will choose to study less than she does. In this section, we will find
a general solution for a person’s choice of study times and exam scores as
a function of the time costs of improving one’s score.
(a) Suppose that if a student does not study for an examination, he or
she gets no correct answers. Every answer that the student gets right
on the first examination costs P1minutes of studying for the first exam.
Every answer that he or she gets right on the second examination costs
P2minutes of studying for the second exam. Suppose that this student
spends a total of Mminutes studying for the two exams and allocates
the time between the two exams in the most efficient possible way. Will
the student have the same number of correct answers on both exams?
NAME 79
course as a function of the three variables, P1,P2,andM:S=M
If this student wants to get an overall score of S, with the smallest pos-
(b) Suppose that a student has the utility function
U(S, M)=S−A
2M2,
where Sis the student’s overall score for the course, Mis the number
of minutes the student spends studying, and Ais a variable that reflects
how much the student dislikes studying. In Part (a) of this problem, you
found that a student who studies for Mminutes and allocates this time
wisely between the two exams will get an overall score of S=M
P1+P2.
Substitute M
P1+P2for Sin the utility function and then differentiate with
respect to Mto find the amount of study time, M, that maximizes the
student’s utility. M=1
A(P1+P2).Your answer will be a function of
the variables P1,P2,andA. If the student chooses the utility-maximizing
amount of study time and allocates it wisely between the two exams, he
or she will have an overall score for the course of S=1
A(P1+P2)2.
(c) Nancy Lerner has a utility function like the one presented above. She
chose the utility-maximizing amount of study time for herself. For Nancy,
P1=10andP2= 20. She spent a total of M=1,200 minutes studying
for the two exams. This gives us enough information to solve for the
variable Ain Nancy’s utility function. In fact, for Nancy, A=1
36,000.
(d) Ed Fungus is a student in Nancy’s class. Ed’s utility function is just
like Nancy’s, with the same value of A. But Ed learns more slowly than
Nancy. In fact it takes Ed exactly twice as long to learn anything as it
takes Nancy, so that for him, P1=20andP2= 40. Ed also chooses his
amount of study time so as to maximize his utility. Find the ratio of the
amount of time Ed spends studying to the amount of time Nancy spends
6.13 (1) Here is a puzzle for you. At first glance, it would appear that
there is not nearly enough information to answer this question. But when
you graph the indifference curve and think about it a little, you will see
that there is a neat, easily calculated solution.
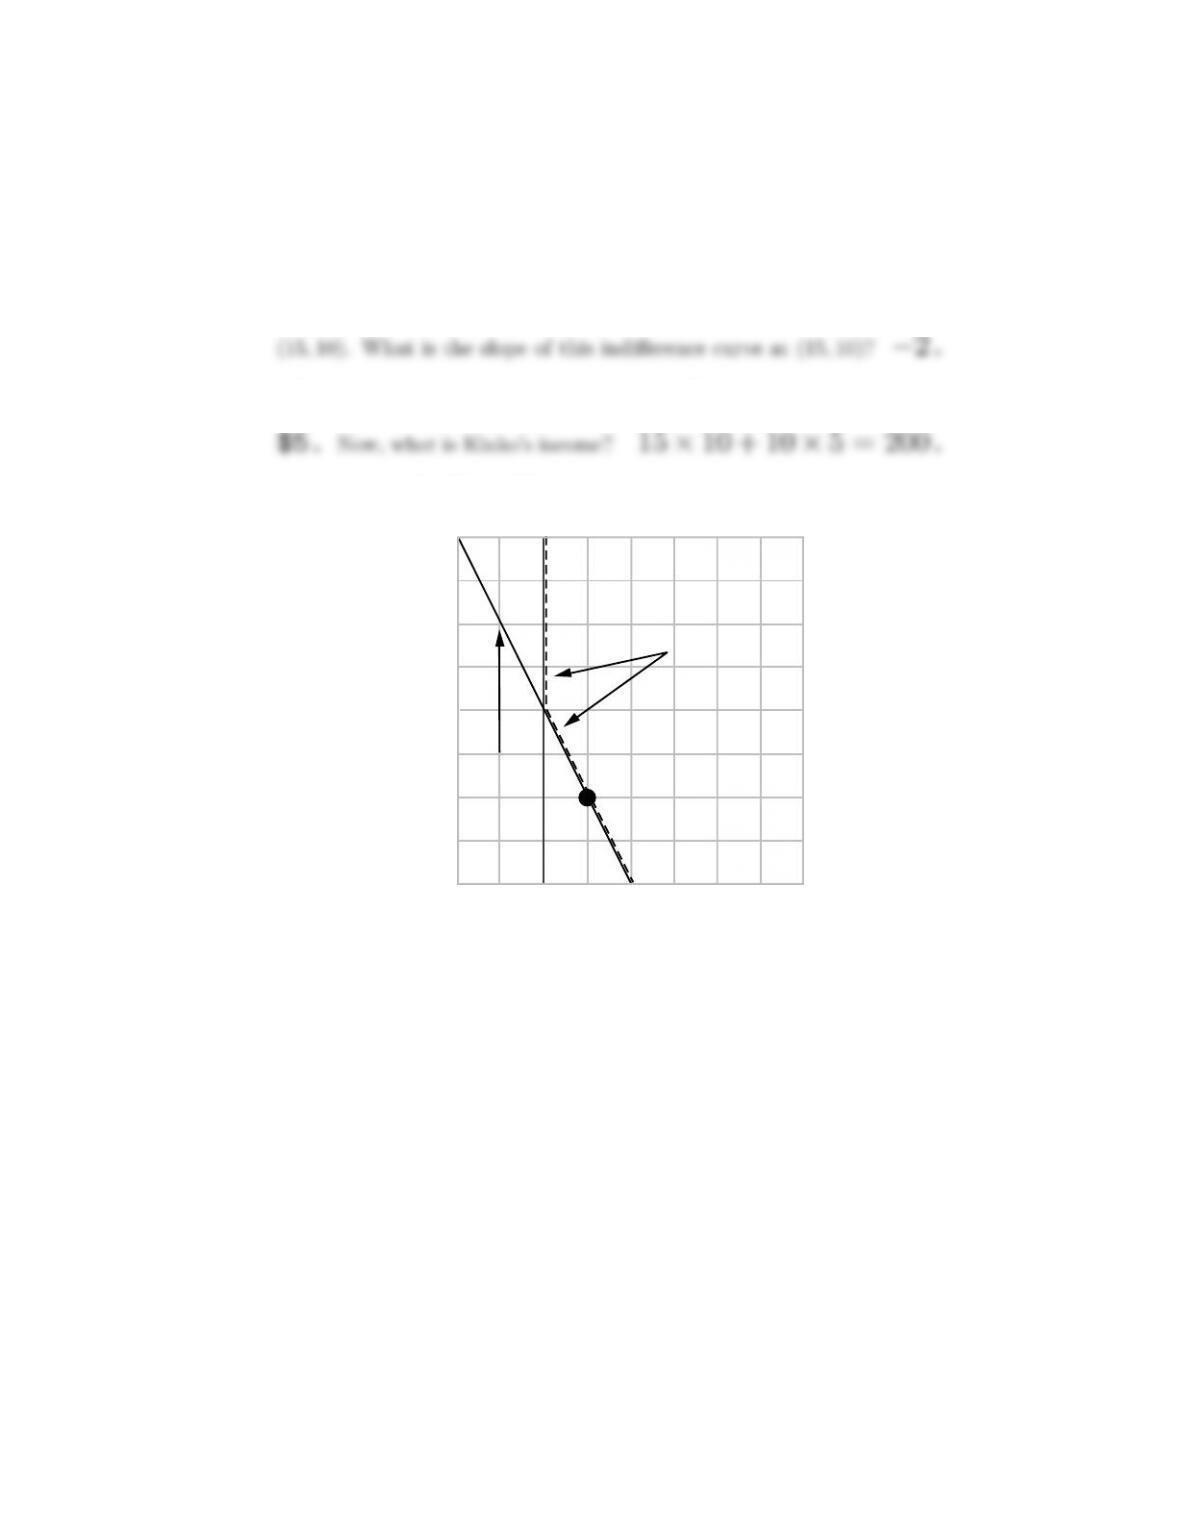
80 DEMAND (Ch. 6)
Kinko spends all his money on whips and leather jackets. Kinko’s
utility function is U(x, y)=min{4x, 2x+y},wherexis his consumption
of whips and yis his consumption of leather jackets. Kinko is consuming
15 whips and 10 leather jackets. The price of whips is $10. You are to
find Kinko’s income.
(a) Graph the indifference curve for Kinko that passes through the point
What must be the price of leather jackets if Kinko chooses this point?
0102030
40
10
20
30
Whips
Leather jackets
40
(15,10)
Indifference
curve
2x + y = 40
4x = 40