10 Chapter Highlights
Chapter 4
Utility
In this chapter, the level of abstraction kicks up another notch. Students often
have trouble with the idea of utility. It is sometimes hard for trained economists
to sympathize with them sufficiently, since it seems like such an obvious notion
to us.
Here is a way to approach the subject. Suppose that we return to the idea of
the “heavier than” relation discussed in the last chapter. Think of having a big
balance scale with two trays. You can put someone on each side of the balance
scale and see which person is heavier, but you don’t have any standardized
weights. Nevertheless you have a way to determine whether xis heavier than y.
Now suppose that you decide to establish a scale. You get a bunch of
stones, check that they are all the same weight, and then measure the weight of
individuals in stones. It is clear that xis heavier than yif x’s weight in stones
is heavier than y’s weight in stones.
Somebody else might use different units of measurements—kilograms, pounds,
or whatever. It doesn’t make any difference in terms of deciding who is heavier.
At this point it is easy to draw the analogy with utility—just as pounds give
a way to represent the “heavier than” order numerically, utility gives a way
to represent the preference order numerically. Just as the units of weight are
arbitrary, so are the units of utility.
This analogy can also be used to explore the concept of a positive monotonic
transformation, a concept that students have great trouble with. Tell them that
a monotonic transformation is just like changing units of measurement in the
weight example.
However, it is also important for students to understand that nonlinear
changes of units are possible. Here is a nice example to illustrate this. Suppose
that wood is always sold in piles shaped like cubes. Think of the relation “one
pile has more wood than another.” Then you can represent this relation by
looking at the measure of the sides of the piles, the surface area of the piles, or
the volume of the piles. That is, x,x2,orx3gives exactly the same comparison
between the piles. Each of these numbers is a different representation of the
utility of a cube of wood.
Be sure to go over carefully the examples here. The Cobb-Douglas example
is an important one, since we use it so much in the workbook. Emphasize that
it is just a nice functional form that gives convenient expressions. Be sure to
Chapter 4 11
elaborate on the idea that xa
1xb
2is the general form for Cobb-Douglas preferences,
but various monotonic transformations (e.g., the log) can make it look quite
different. It’s a good idea to calculate the MRS for a few representations of
the Cobb-Douglas utility function in class so that people can see how to do
them and, more importantly, that the MRS doesn’t change as you change the
representation of utility.
The example at the end of the chapter, on commuting behavior, is a very
nice one. If you present it right, it will convince your students that utility is an
operational concept. Talk about how the same methods can be used in marketing
surveys, surveys of college admissions, etc.
The exercises in the workbook for this chapter are very important since they
drive home the ideas. A lot of times, students think that they understand some
point, but they don’t, and these exercises will point that out to them. It is
a good idea to let the students discover for themselves that a sure-fire way to
tell whether one utility function represents the same preferences as another is to
compute the two marginal rate of substitution functions. If they don’t get this
idea on their own, you can pose it as a question and lead them to the answer.
Utility
A. Two ways of viewing utility
1. old way
a) measures how “satisfied” you are
2. new way
a) summarizes preferences
b) a utility function assigns a number to each bundle of goods so that more
B. Utility functions are not unique
1. if u(x1,x
2) is a utility function that represents some preferences, and f(·)is
any increasing function, then f(u(x1,x
2)) represents the same preferences
C. Constructing a utility function
1. can do it mechanically using the indifference curves. Figure 4.2.
D. Examples
1. utility to indifference curves
a) easy — just plot all points where the utility is constant
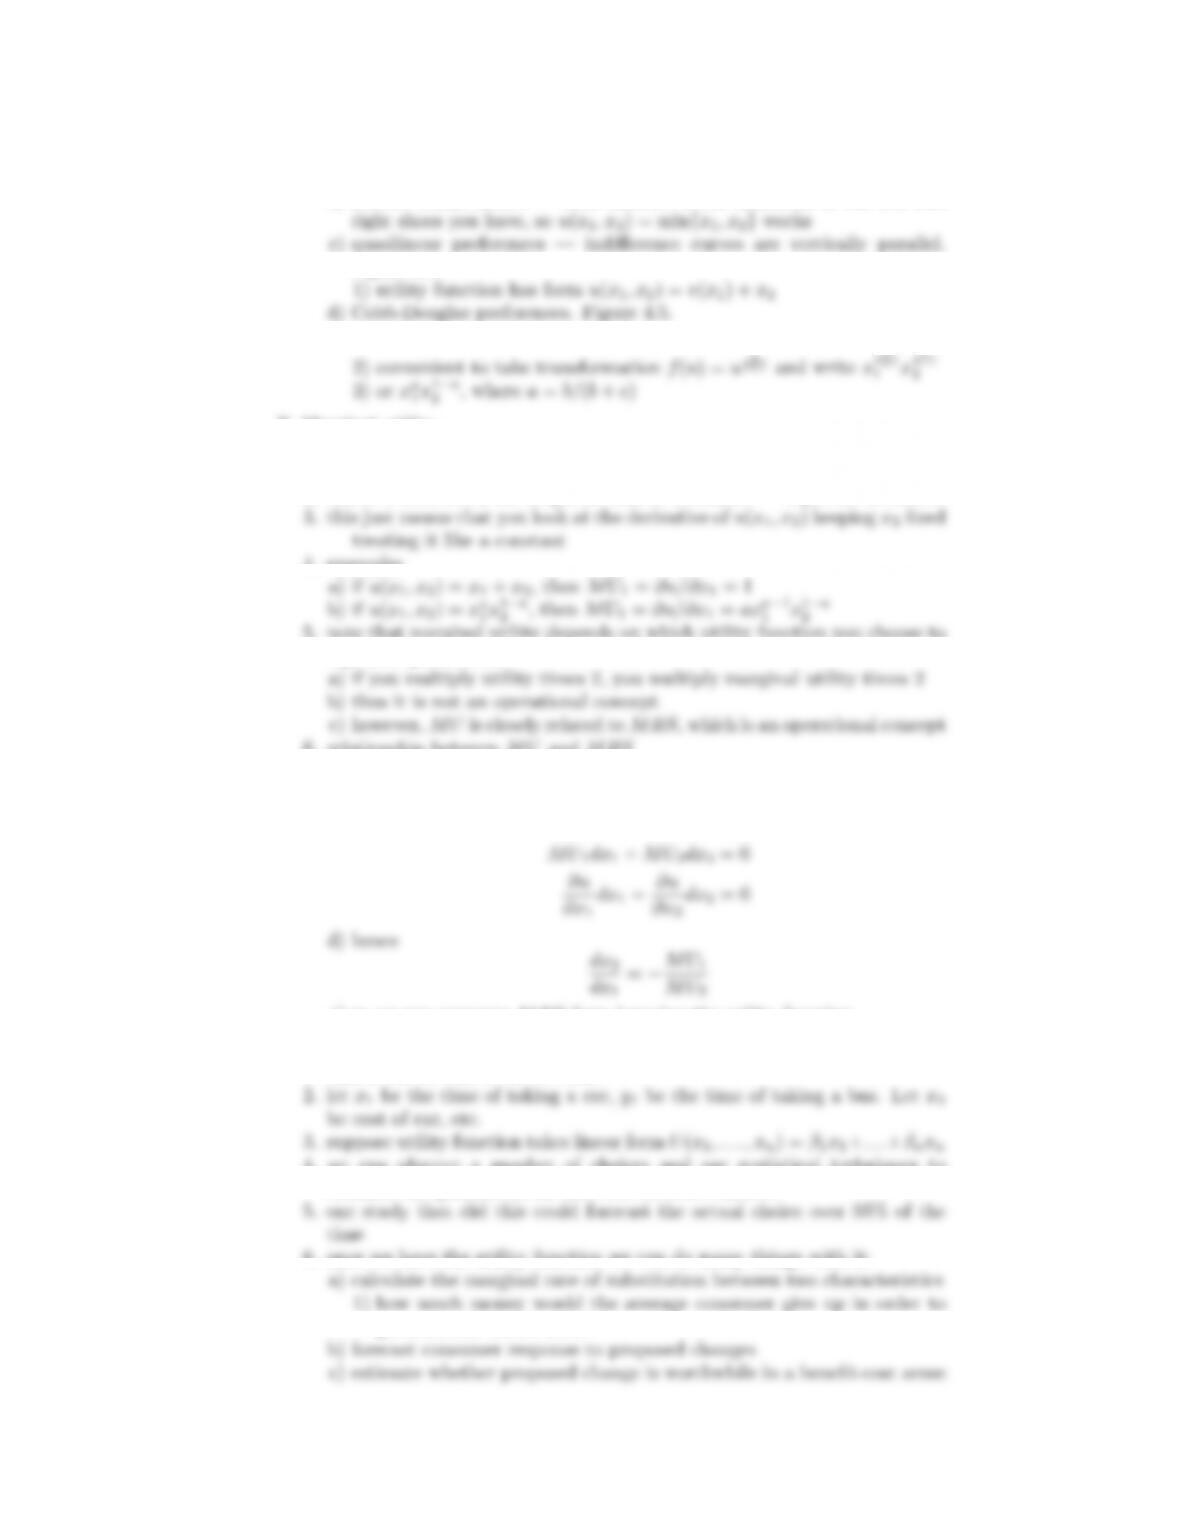
12 Chapter Highlights
1) can use any monotonic transformation of this as well, such as
log (x1+x2)
b) perfect complements — what matters is the minimum of the left and
c) quasilinear preferences — indifference curves are vertically parallel.
Figure 4.4.
d) Cobb-Douglas preferences. Figure 4.5.
1) utility has form u(x1,x
2)=xb
1xc
2
b
b+c
c
b+c
E. Marginal utility
1. extra utility from some extra consumption of one of the goods, holding the
other good fixed
2. this is a derivative, but a special kind of derivative — a partial derivative
4. examples
5. note that marginal utility depends on which utility function you choose to
represent preferences
6. relationship between MU and MRS
a) u(x1,x
2)=k,wherekis a constant, describes an indifference curve
b) we want to measure slope of indifference curve, the MRS
c) so consider a change (dx1,dx
2) that keeps utility constant. Then
e) so we can compute MRS from knowing the utility function
F. Example
1. take a bus or take a car to work?
4. we can observe a number of choices and use statistical techniques to
estimate the parameters βithat best describe choices
6. once we have the utility function we can do many things with it:
1) how much money would the average consumer give up in order to
get a shorter travel time?