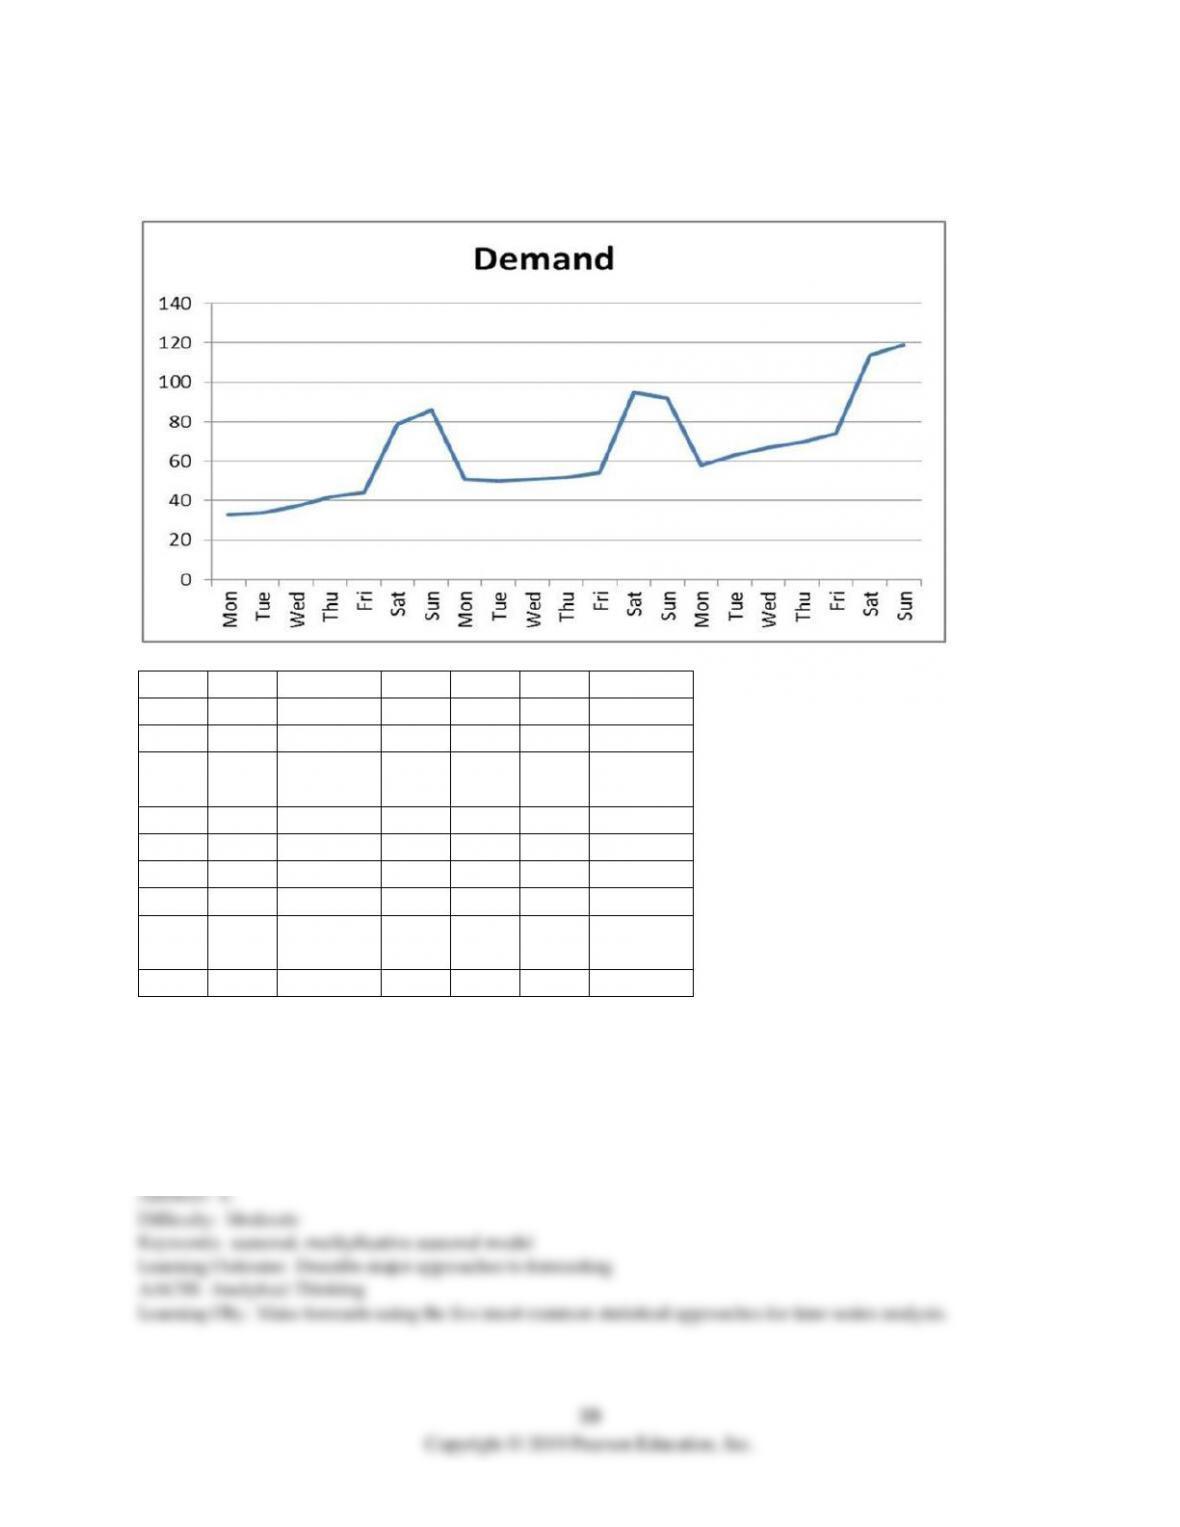
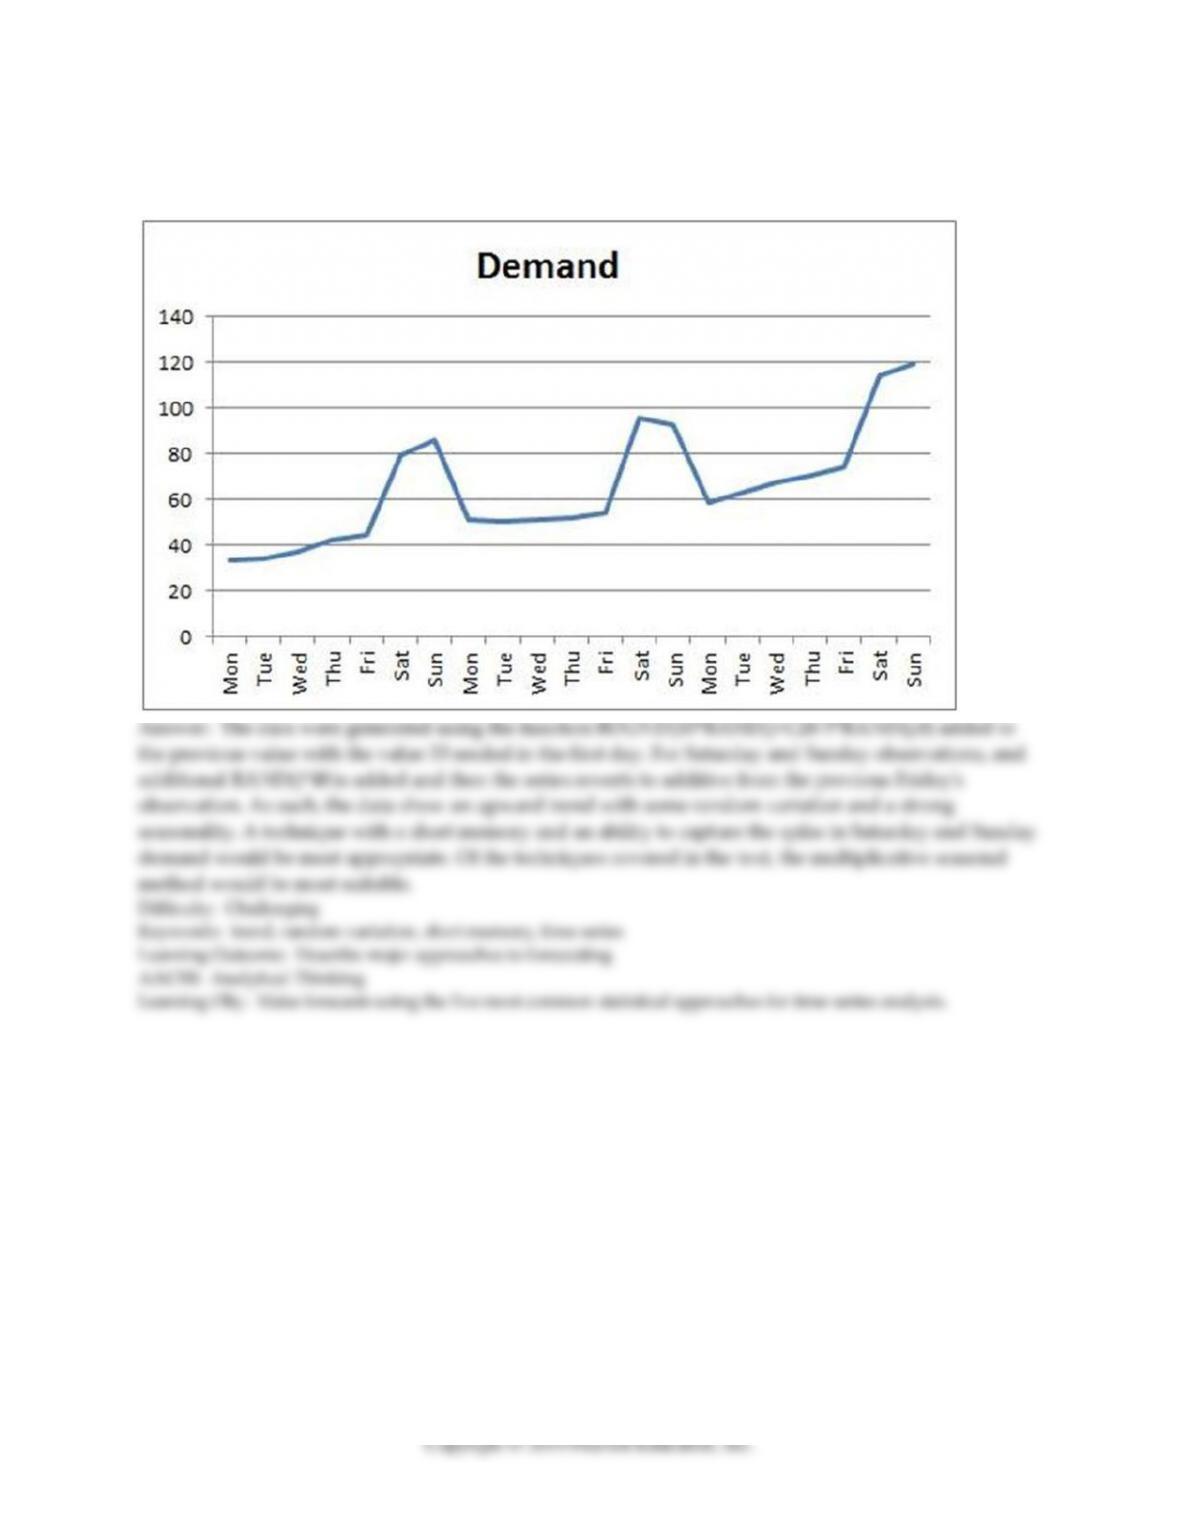
Graph 8.1
Data plotted in the graph appear in the table below.
Obs #
Day
Demand
Obs #
Day
Demand
1
Mon
33
12
Fri
54
2
Tue
34
13
Sat
95
3
Wed
37
14
Sun
92
4
Thu
42
15
Mon
58
5
Fri
44
16
Tue
63
6
Sat
79
17
Wed
67
7
Sun
86
18
Thu
70
8
Mon
51
19
Fri
74
9
Tue
50
20
Sat
114
10
Wed
51
21
Sun
119
11
Thu
52
25) Refer to Graph 8.1. Which term most accurately describes the data points associated with Saturdays
and Sundays?
A) nonbase data
B) outliers
C) seasons
D) erroneous
26) Refer to Graph 8.1. What is the average demand for the second period?
A) 63.57
B) 50.71
C) 82.5
D) 93.5
27) Refer to Graph 8.1. What is the seasonal index for the first Saturday in the data set?
A) 1.69
B) 1.56
C) 0.64
D) 0.58
28) Refer to Graph 8.1. What is the average seasonal index for the Sundays in the data set?
A) 0.65
B) 0.67
C) 1.49
D) 1.54
29) Refer to Graph 8.1. Use a trend projection to forecast the next week‘s demand. Then apply seasonal
indices to determine the demand on Saturday of the fourth week. What is the demand projected to be?
A) 141.4
B) 146.2
C) 151.3
D) 158.9

30) If forecast errors are normally distributed with a mean of 0, the relationship between σ and MAD is:
A) 1.25MAD ≈ σ
B) MAD ≈ 1.25σ
C) MAD ≈ 0.5σ
D) 0.8MAD ≈ σ
Table 8.9
Consider the following results from the last ten periods of student enrollment forecast by the Operations
Management department chairman.
Period
Forecast
Actual
1
25
26
2
32
31
3
42
45
4
53
50
5
64
70
6
70
72
7
81
78
8
88
90
9
95
93
10
102
105
31) Use Table 8.9 to determine the tracking signal for period 4 for the department chairman’s forecast.
A) 0.6
B) -0.6
C) 0.0
D) -1.8
32) Use Table 8.9 to determine the MAD for period 5 for the department chairman’s forecast.
A) 2.0
B) 2.8
C) 2.67
D) 2.42
33) Use Table 8.9 to determine the cumulative sum of forecast errors as of period 6 for the department
chairman’s forecast.
A) -10
B) -6
C) -8
D) -4
34) In an exponential smoothing model a ________ value for alpha results in greater emphasis being
placed on more recent periods.
35) A(n) ________ forecast is a time-series method whereby the forecast for the next period equals the
demand for the current period.
36) A(n) ________ is a portion of data from more recent time periods that is used to test different models
developed from earlier time period data.
37) ________ is a time-series method used to estimate the average of a demand time series by averaging
the demand for the n most recent time periods.
38) Explain how the value of alpha affects forecasts produced by exponential smoothing.
44
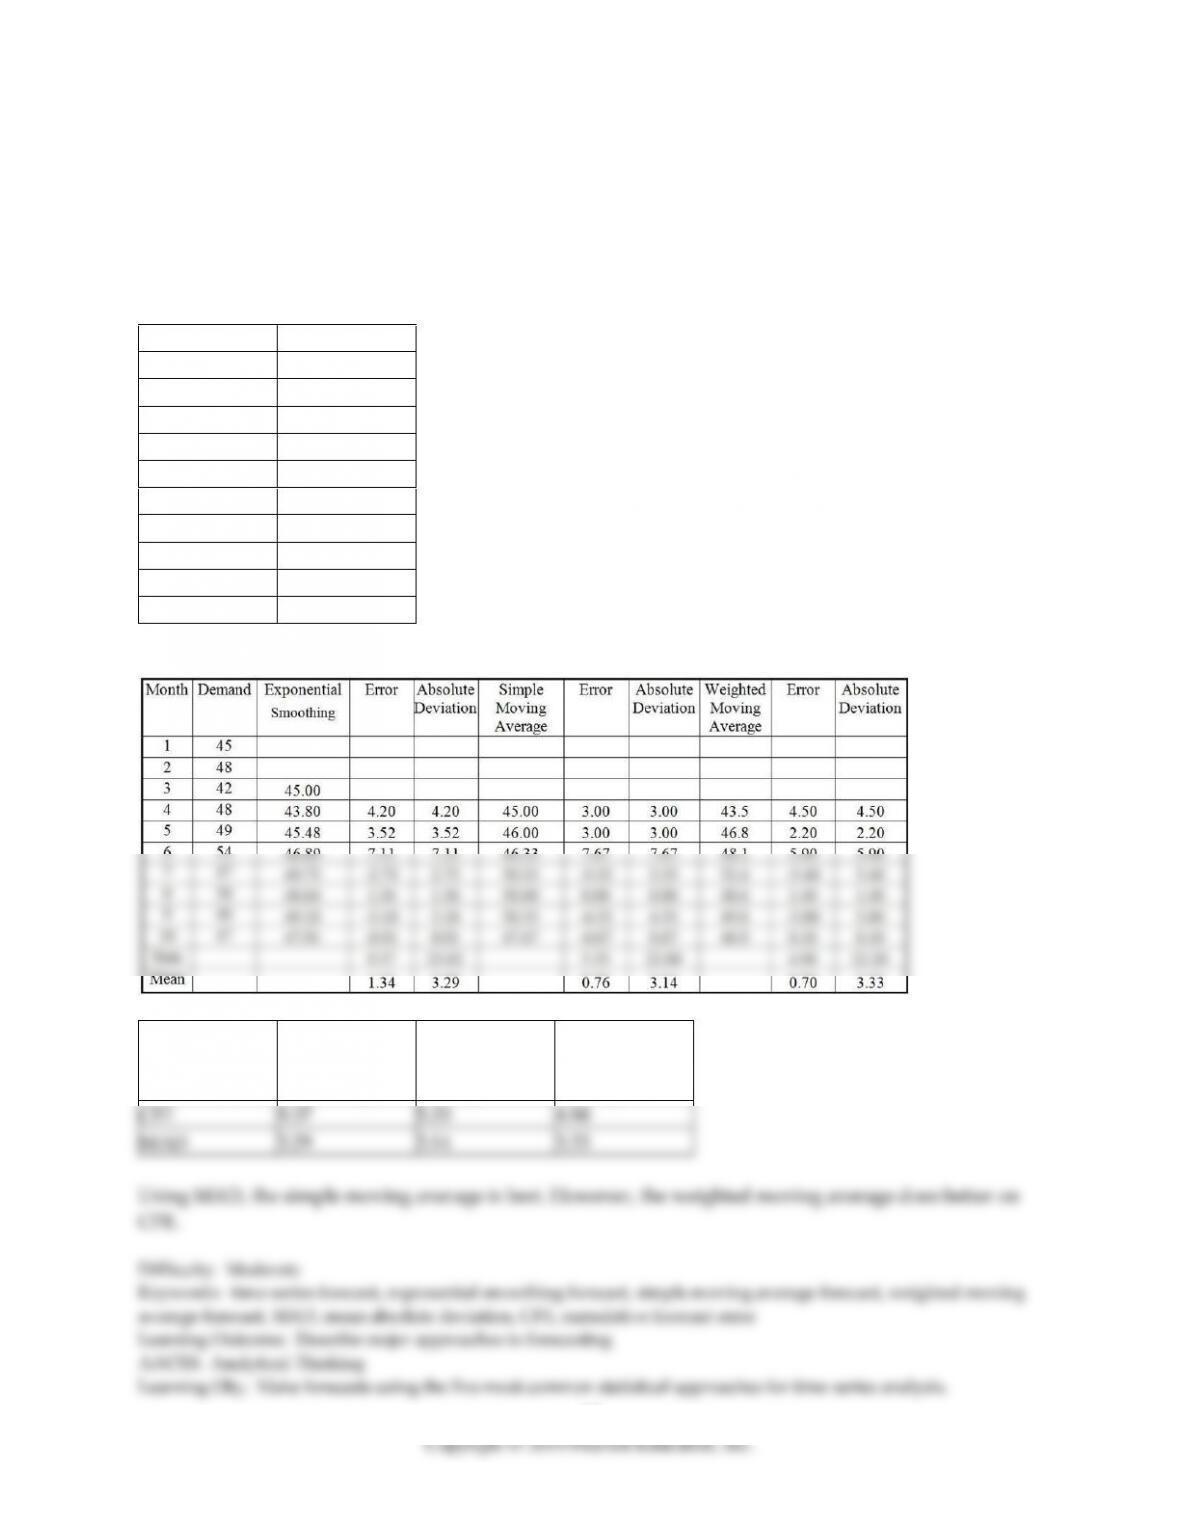
39) Calculate three forecasts using the following data. First, for periods 4 through 10, develop the
exponentially smoothed forecasts using a forecast for period 3 (F3) of 45.0 and an alpha of 0.4. Second,
calculate the three-period moving-average forecast for periods 4 through 10. Third, calculate the
weighted moving average for periods 4 through 10, using weights of .70, .20, and .10, with 0.70 applied to
the most recent data. Calculate the mean absolute deviation (MAD) and the cumulative sum of forecast
error (CFE) for each forecasting procedure. Which forecasting procedure would you select? Why?
Month
Demand
1
45
2
48
3
43
4
48
5
49
6
54
7
47
8
50
9
46
10
47
Answer:
Exponential
Smoothing
Simple Moving
Average
Weighted
Moving
Average
CFE
9.37
5.33
4.90
MAD
3.29
3.14
3.33
Using MAD, the simple moving average is best. However, the weighted moving average does better on
CFE.
Difficulty: Moderate
Keywords: time-series forecast, exponential smoothing forecast, simple moving average forecast, weighted moving
average forecast, MAD, mean absolute deviation, CFE, cumulative forecast error
Learning Outcome: Describe major approaches to forecasting
AACSB: Analytical Thinking
Learning Obj.: Make forecasts using the five most common statistical approaches for time-series analysis.
45
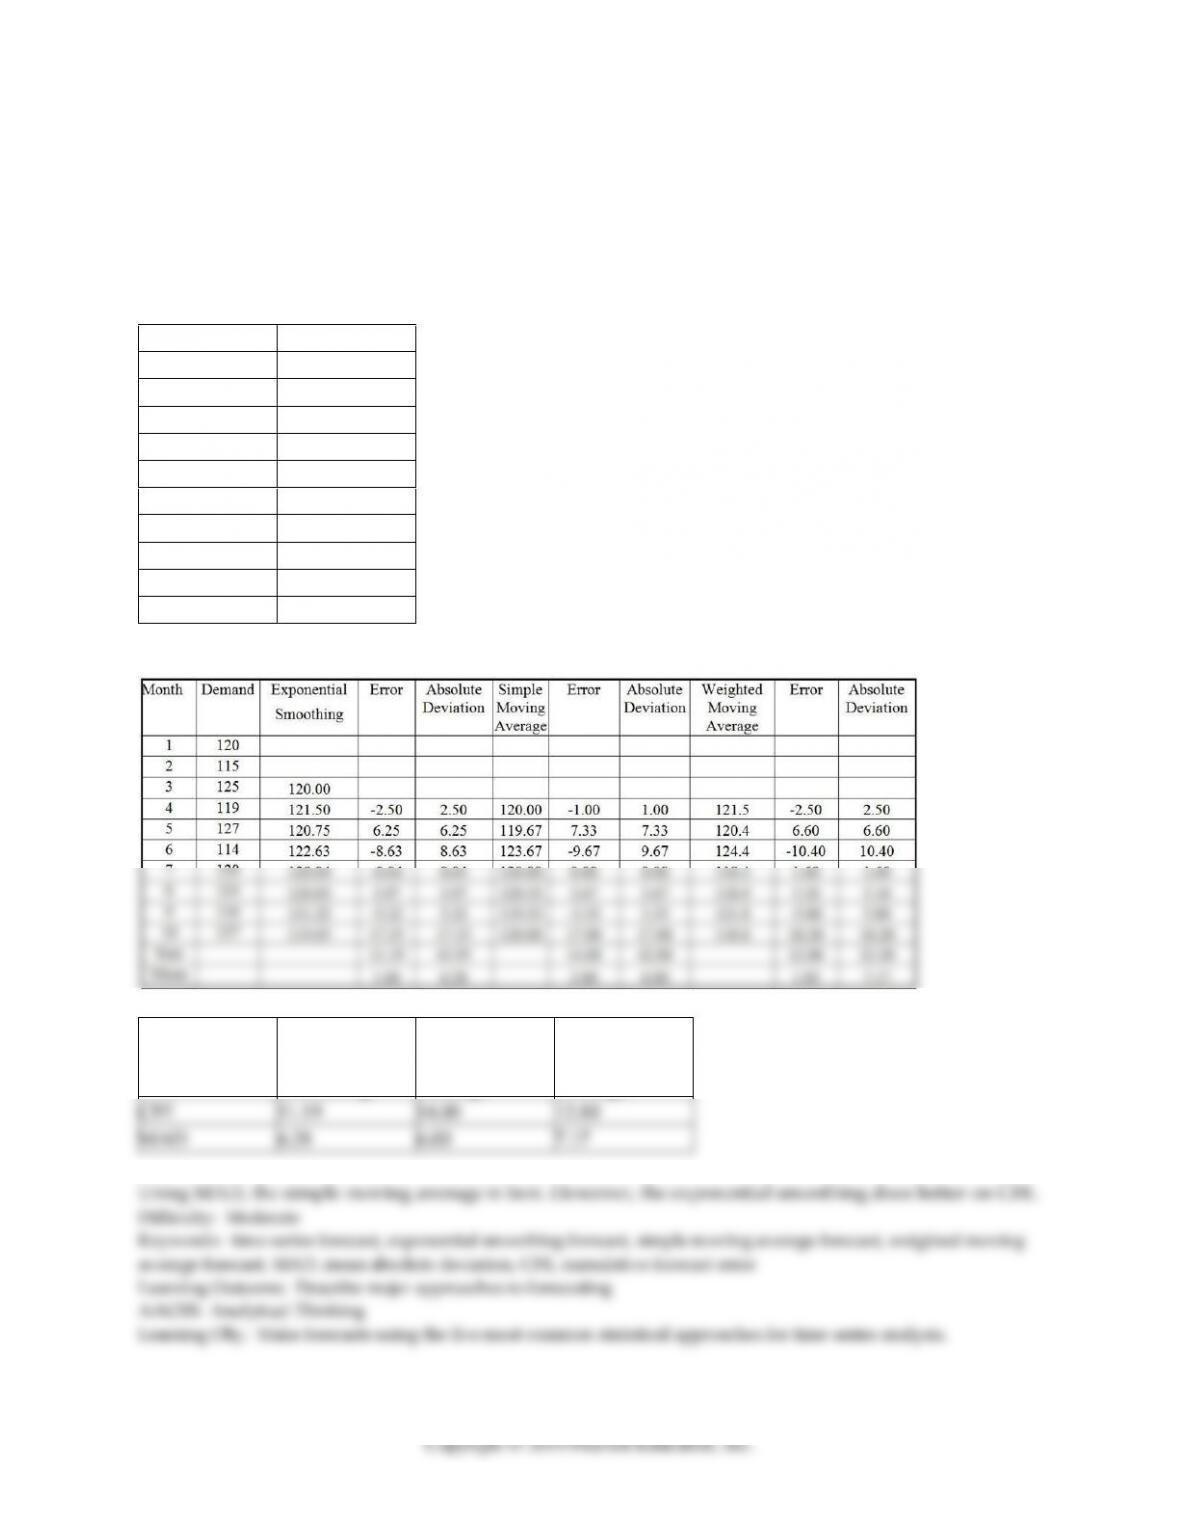
40) Calculate three forecasts using the following data. First, for periods 4 through 10, develop the
exponentially smoothed forecasts using a forecast for period 3 (F3) of 120.0 and an alpha of 0.3. Second,
calculate the three-period moving-average forecast for periods 4 through 10. Third, calculate the
weighted moving average for periods 4 through 10, using weights of .60, .30, and .10. Calculate the mean
absolute deviation (MAD) and the cumulative sum of forecast error (CFE) for each forecasting procedure.
Which forecasting procedure would you select? Why?
Month
Demand
1
120
2
115
3
125
4
119
5
127
6
114
7
120
8
124
9
116
10
137
Answer:
Exponential
Smoothing
Simple Moving
Average
Weighted
Moving
Average
CFE
11.19
14.00
12.80
MAD
6.28
6.00
7.17
46
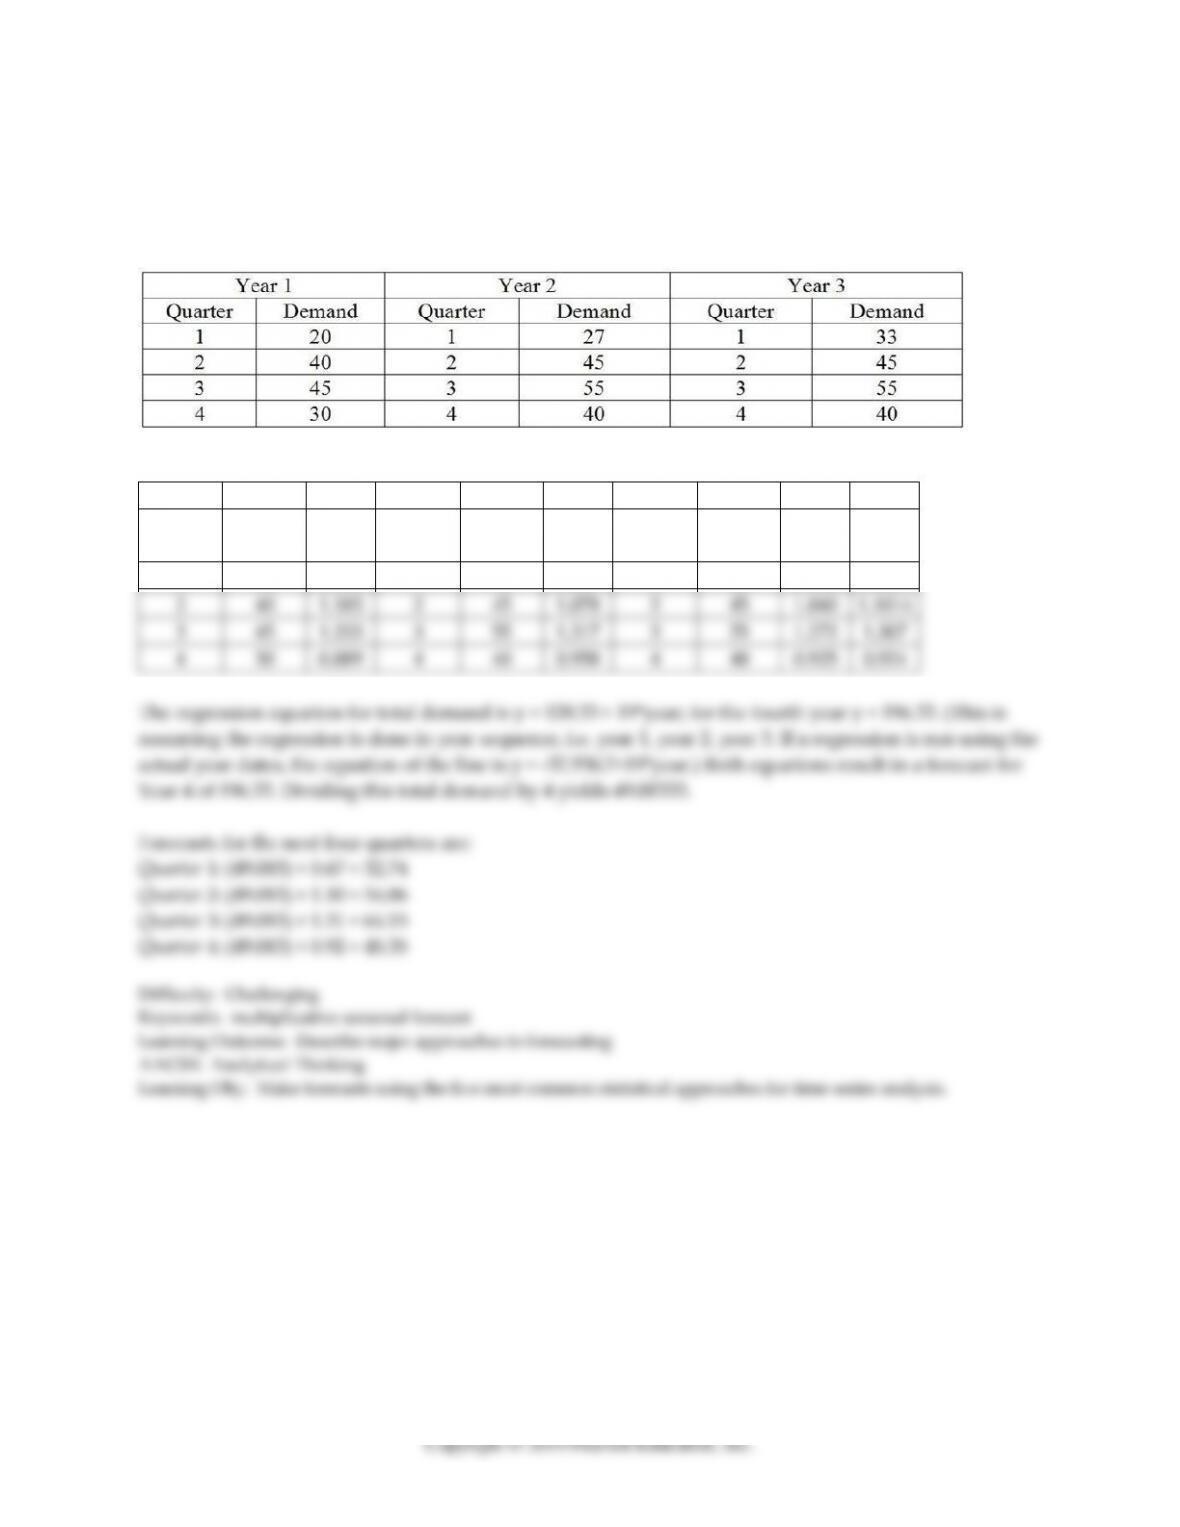
41) A local moving company has collected data on the number of moves they have been asked to perform
over the past three years. Moving is highly seasonal, so the owner/operator, who is both burly and highly
educated, decides to apply the multiplicative seasonal method (based on a linear regression for total
demand) to forecast the number of customers for the coming year. What is his forecast for each quarter?
Answer: The seasonal factor calculations for each year show:
Year 1
Year 1
Year 1
Year 2
Year 2
Year 2
Year 3
Year 3
Year 3
Year 3
Quarter
Demand
Seas
Fact
Quarter
Demand
Seas
Fact
Quarter
Demand
Seas
Fact
Avg SF
1
20
0.592
1
27
0.647
1
33
0.763
0.667
2
40
1.185
2
45
1.078
2
45
1.040
1.1014
3
45
1.333
3
55
1.317
3
55
1.272
1.307
4
30
0.889
4
40
0.958
4
40
0.925
0.924
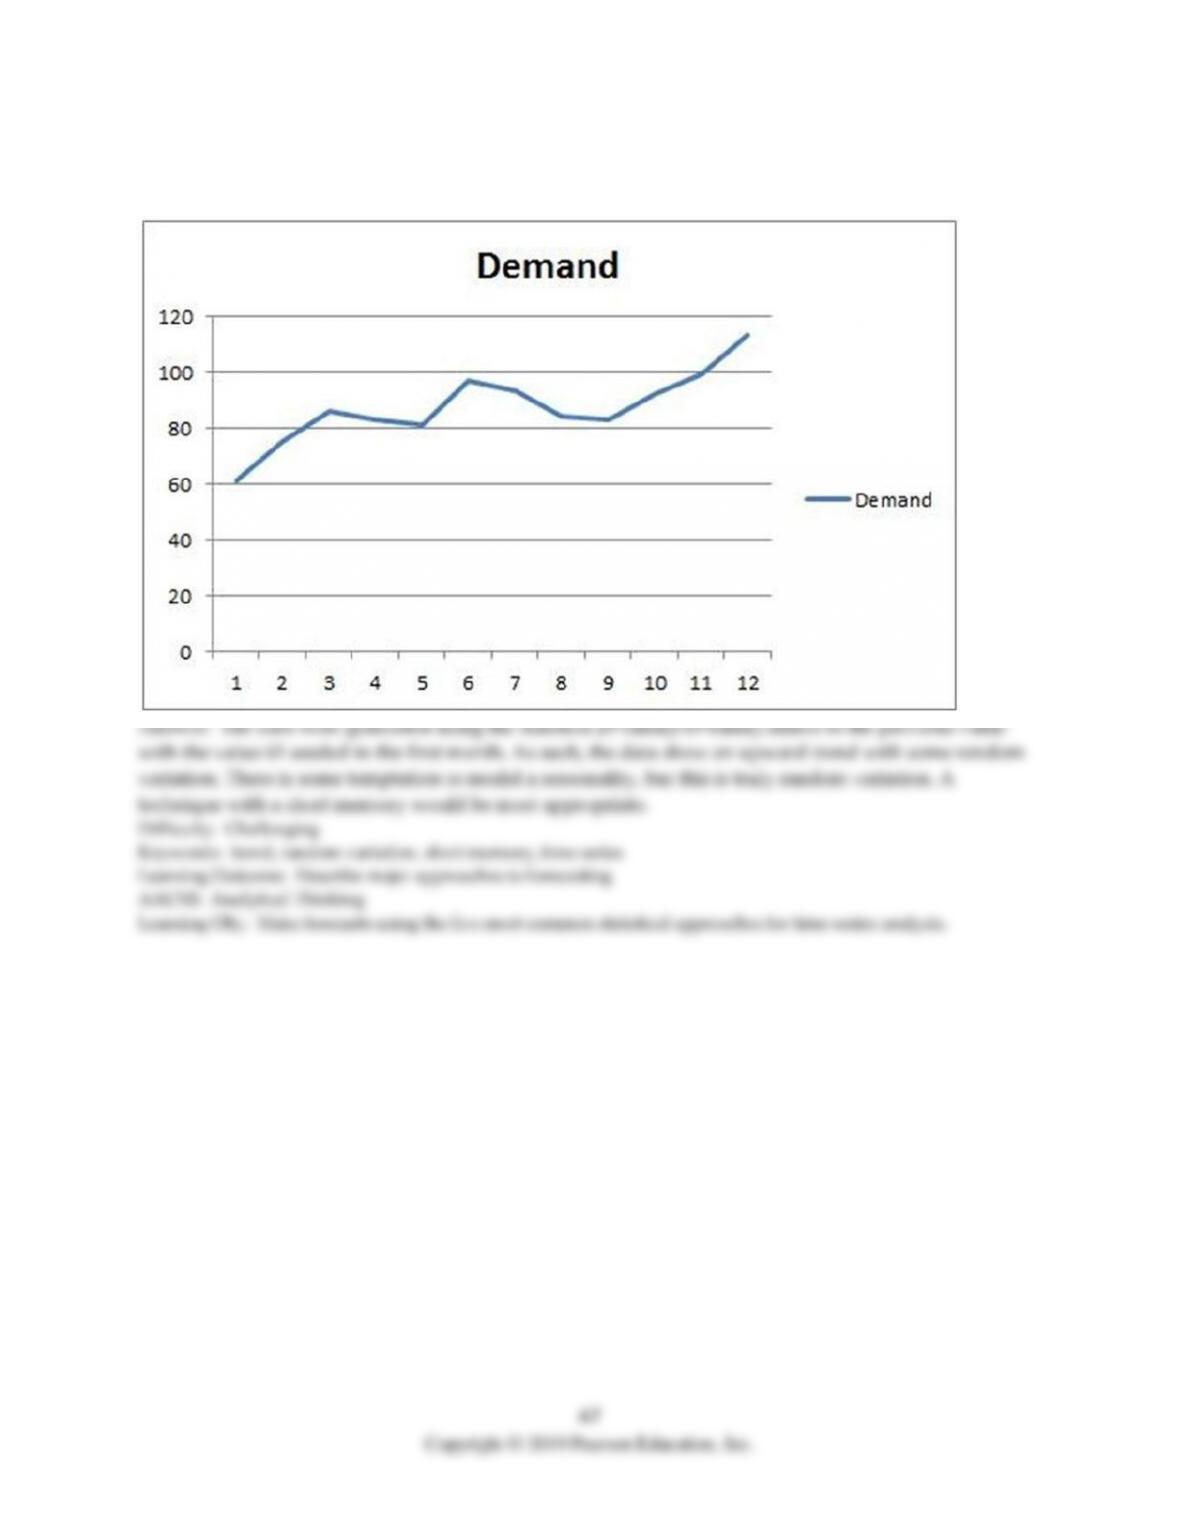
42) The demand for an item over the last year is plotted below. Develop a forecast and explain why your
approach is reasonable.
48
43) Three weeks of data are available from a restaurant. Develop a forecast and explain why your
approach is reasonable.
8.7 Insights into Effective Demand Forecasting
1) Combination forecasting is a method of forecasting that selects the best from a group of forecasts
generated by simple techniques.
2) Combination forecasting is most effective when the techniques being combined contribute different
kinds of information to the forecasting process.
3) Focus forecasting selects the best forecast from a group of forecasts generated by individual techniques.
4) Better forecasting processes yield better forecasts.
5) Traditional data processing applications are capable of handling big data.
6) A forecasting system that brings the manufacturer and its customers together to provide input for
forecasting is a(n):
A) nested system.
B) harmonically balanced supply chain.
C) iterative Delphi method system for the supply chain.
D) collaborative planning, forecasting, and replenishment system.
7) Barney took what he liked to call “the shotgun approach” to forecasting. Every period he tried a
number of different forecasting approaches and at the end of the period he reviewed all of the forecasts to
see which was the most accurate. The winner would be used for next period’s forecast (but he still made
forecasts all possible ways so he could use the system again for the following period). The more formal
name for this technique is:
A) combination forecasting.
B) post-hoc forecasting.
C) focus forecasting.
D) shotgun forecasting.
8) Andy took what he liked to call “the sheriff without a gun” approach to forecasting. Every period he
tried a number of different forecasting approaches and simply averaged the predictions for all of the
techniques. This overall average was the official forecast for the period. The more formal name for this
technique is:
A) grand averaging.
B) focus forecasting.
C) simple average.
D) combination forecasting.

Table 8.8
The manager of a pizza shop must forecast weekly demand for special pizzas so that he can order pizza
shells weekly. Recent demand has been:
WEEK
No. Special
Pizzas
1
30
2
45
3
33
4
36
5
35
6
40
9) Use the information from Table 8.8. The pizza shop manager believes that a combination forecast
might improve her ability to predict future demand, and thus improve keeping fresh ingredients on
hand. She decides to use the 3-week simple moving average and 3-week weighted moving average,
giving them equal weight. The 3-week weighted moving averages are .6 for the most recent period, .25
for the second most recent period, and .15 for the third most recent period. What is her forecast for week
#7?
A) 38.15 pizzas
B) 39.5 pizzas
C) 37 pizzas
D) 37.58 pizzas
10) Use the information from Table 8.8. The pizza shop manager believes that a combination forecast
might improve her ability to predict future demand, and thus improve keeping fresh ingredients on
hand. She decides to use the 3-week weighted moving average and exponentially smoothed average
forecast, giving them equal weight. The 3-week weighted moving averages are .6 for the most recent
period, .25 for the second most recent period, and .15 for the third most recent period. The smoothing
constant is .10 and the previously forecasted demand for week 6 was 39.28 pizzas. What is her forecast for
week #7?
A) 38.75 pizzas
B) 40.8 pizzas
C) 42.25 pizzas
D) 44.8 pizzas

11) Use the information from Table 8.8. The pizza shop manager believes that a combination forecast
might improve her ability to predict future demand, and thus improve keeping fresh ingredients on
hand. She decides to use the 3-week simple moving average and exponentially smoothed average
forecast, giving them equal weight. The smoothing constant is .10 and the previously forecasted demand
for week 6 was 39.28 pizzas. What is her forecast for week #7?
A) 35.5 pizzas
B) 37.4 pizzas
C) 38.2 pizzas
D) 40.2 pizzas
12) Use the information from Table 8.8. The pizza shop manager is looking for a forecasting approach that
will forecast her demand within 0.5 pizzas. If the actual demand for week #7 was 39 pizzas, which of the
combination forecasts came closest to predicting this demand?
A) simple moving average and weighted moving average forecast
B) simple moving average and exponentially smoothed forecast
C) weighted moving average and exponentially smoothed forecast
D) week #7 demand of 39 is within 0.5 pizzas for all three of these combination forecasts, and thus all of
them are appropriate
13) Which of the following statements about bid data is not true?
A) Data technicians must be the ones to identify problems to be tackled with big data.
B) Companies employing data-driven decisions tend to be more successful than others.
C) Data scientists and skilled professionals are a necessity to execute big data projects.
D) Public cloud providers are an option for hosting bid data projects that may swamp single servers.

53
14) ________ are produced by averaging independent forecasts based on different methods or different
data, or both.
15) ________ is a collection of data from traditional and digital sources and is characterized by volume,
variety, and velocity.
16) Pho Bulous, a Vietnamese restaurant in the bustling metropolis of Edmond, has had great success
using forecasting techniques to predict demand for their main menu items ever since they opened their
doors. Their forecast for last month was grossly inaccurate and so far this month, their forecast appears to
be just as bad as last month’s. It’s already time to prepare the forecast for next month, what should they
do about their model?
Answer: The answer depends on whether Pho Bulous believes that last month’s and this month’s results
are aberrations or the start of something new. Both causal and time-series techniques assume that there
has been no change in how the world works, that is, independent factors of time or other variables will

54
17) How is a typical forecasting process similar to the Plan-Do-Study-Act (PDSA) cycle? (See Chapter 5
for more information on PDSA)
Answer: The authors indicate that forecasting is a process that should be continually reviewed for
improvements; the PDSA cycle provides one vehicle for continuous improvement. The authors present a
18) Describe the combination forecast techniques and discuss how they have been shown to perform in
recent studies.
Answer: Combination forecasts are forecasts that are produced by averaging independent forecasts
based on different methods, different sources, or different data. Research during the last two decades
55
19) What are the steps of the forecasting process as described in the text?
Answer: The authors describe a six-step forecasting process.
Step 1. Update the history file and review forecast accuracy. Enter the actual demand and review forecast
accuracy.
20) What are some of the principles organizations can observe to improve their forecasting process?
Answer: (See Table 8.2 in the text.) Some principles organizations can observe to improve their
forecasting process include:
1. Better processes yield better forecasts.
2. Demand forecasting is being done in virtually every company, either formally or informally. The
challenge is to do it well–better than the competition.
56
21) Describe some of the managerial considerations required to utilize big data effectively.
Some of the specific managerial considerations are:
1. The need for adequate computing power and server capacity to handle the load of big data, which can
be alleviated by public cloud servers.