d.
1) Risk is a measure of the probability and consequences of not reaching a defined project goal.
2) The optimistic time is the probable time required to perform the activity.

3) A risk-management plan contains all identified risks to a project plus the ways that they can be
circumvented.
4) A good risk management plan will contain which of these elements?
A) the project manager’s tolerance level for risk
B) the number of acceptable outcomes
C) a prediction of the impact of each risk on the project
D) the number of unacceptable outcomes
5) A plan that identifies key threats to a project and prescribes ways to circumvent them is called a:
A) project plan.
B) contingency plan.
C) backup plan.
D) risk management plan.
6) Which of these is not one of the four categories of project risk?
A) cost/benefit
B) operations
C) strategic fit
D) project team capability

7) Information accuracy relative to the completeness of the work breakdown structure and
communication of timely information affect the:
A) strategic fit risk of a project.
B) operations risk of a project.
C) service/product attribute risk of a project.
D) cost/benefit risk of a project.
8) When using the beta distribution for estimating activity times:
A) an advantage is that the mode of the distribution is always equidistant from the end points of the
distribution.
B) the most likely time estimate can be positioned anywhere between the optimistic and pessimistic time
estimates.
C) we assume that the standard deviation is one-third the range between the optimistic and pessimistic
time estimates.
D) the most likely time estimate becomes the mean of the distribution.
9) Following are four sets of most optimistic, most likely, and most pessimistic times (in weeks) for an
activity. Which one of the four sets will have a mean estimated time equal to the most likely time?
A) 1, 9, 9
B) 1, 5, 9
C) 1, 1, 9
D) 1, 5, 5

10) To calculate the probability of completing a project by a certain date:
A) the expected completion time of the project is taken to be the sum of the activity times on the shortest
path.
B) the variance of the distribution of project completion times is taken to be one-sixth the difference
between the latest finish time and the earliest finish time of the last activity in the project.
C) we assume that the activity durations are independent of each other so that the normal distribution
can be used.
D) we need only the parameters of the beta distribution for the finish node of the diagram.
11) In making an estimate of the most pessimistic time for an activity, a manager deliberately estimates
this time too high (i.e., longer than it should be). What is the result of this action, assuming the beta
distribution is being used to make time estimates?
A) The most likely time for this activity will be larger than it should be.
B) The variance of the activity will be smaller than it should be.
C) The beta distribution will be symmetric around its mean.
D) The expected time for this activity will be larger than it should be.
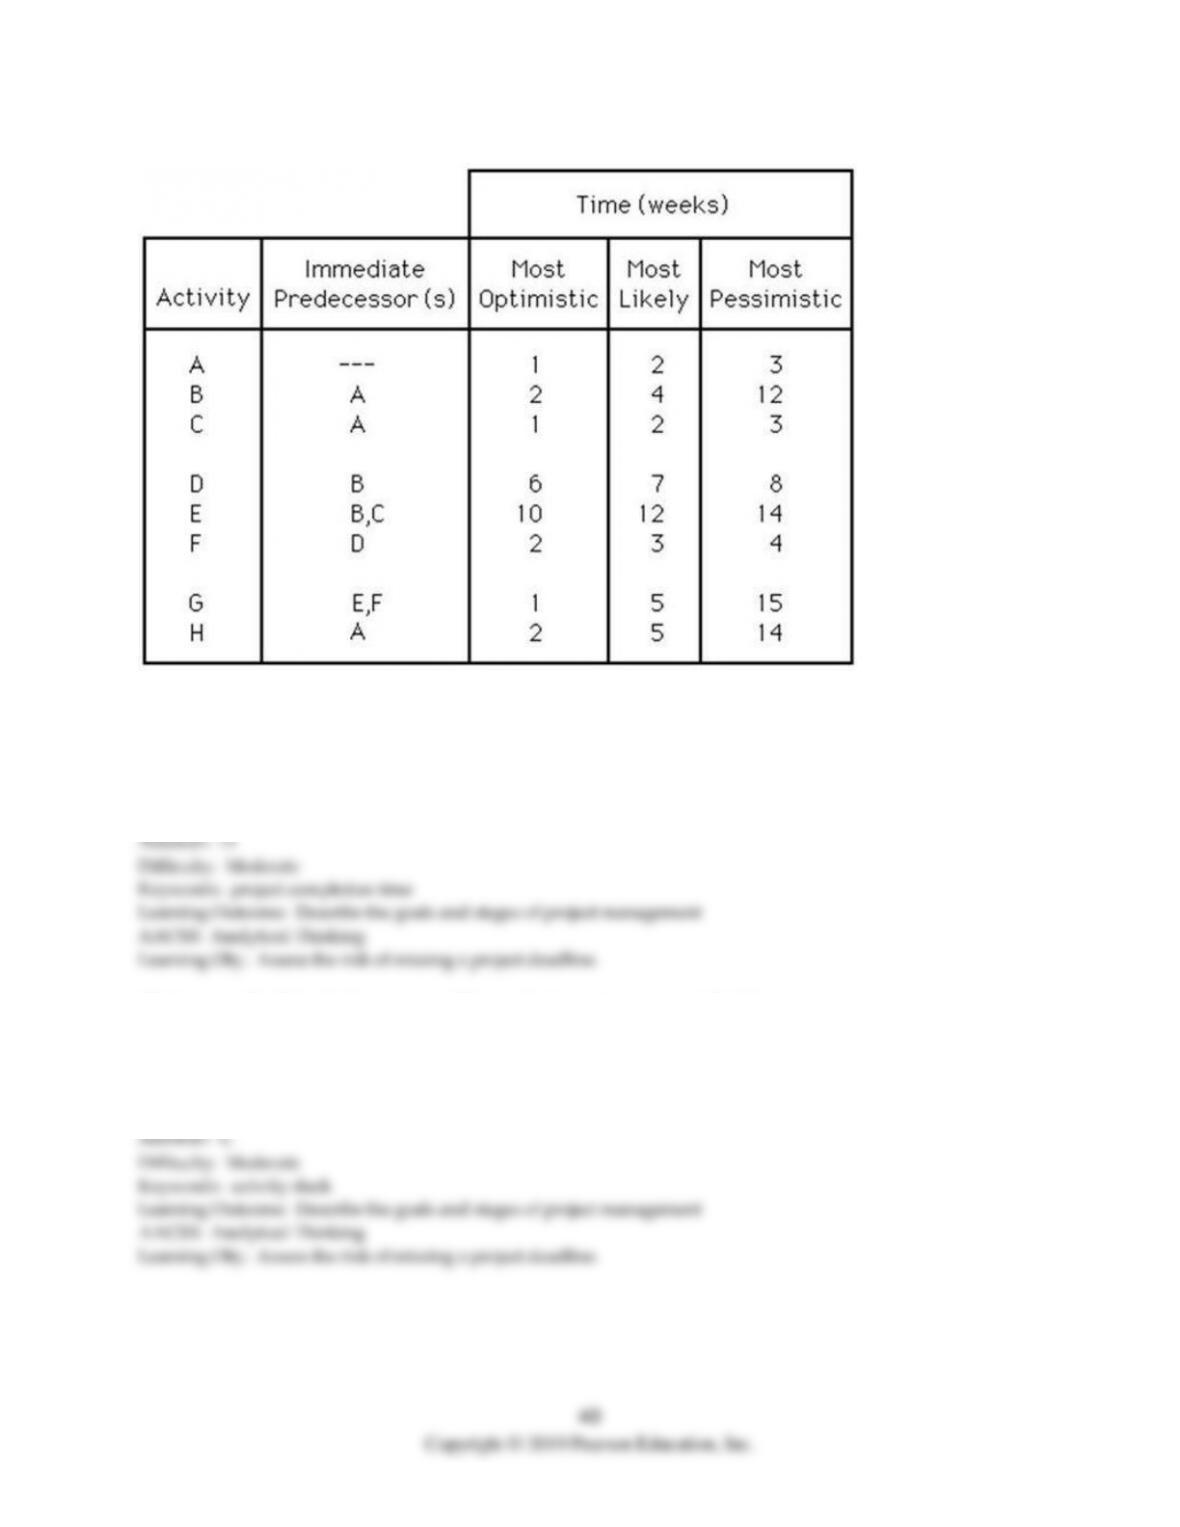
Table 7.2
12) Using Table 7.2, what is the earliest expected time of completion of the whole project?
A) fewer than or equal to 19 weeks
B) greater than 19 but fewer than or equal to 21 weeks
C) greater than 21 but fewer than or equal to 24 weeks
D) greater than 24 weeks
13) Using Table 7.2, which activity will have the largest amount of slack?
A) Activity F
B) Activity C
C) Activity H
D) Activity A
14) Using Table 7.2, if the expected times for activities A, G, and H increased by 2, 3, and 4 weeks,
respectively, by how many weeks would the project‘s earliest expected time of completion increase?
A) fewer than or equal to 2 weeks
B) greater than 2 weeks but fewer than or equal to 4 weeks
C) greater than 4 weeks but fewer than or equal to 6 weeks
D) greater than 6 weeks
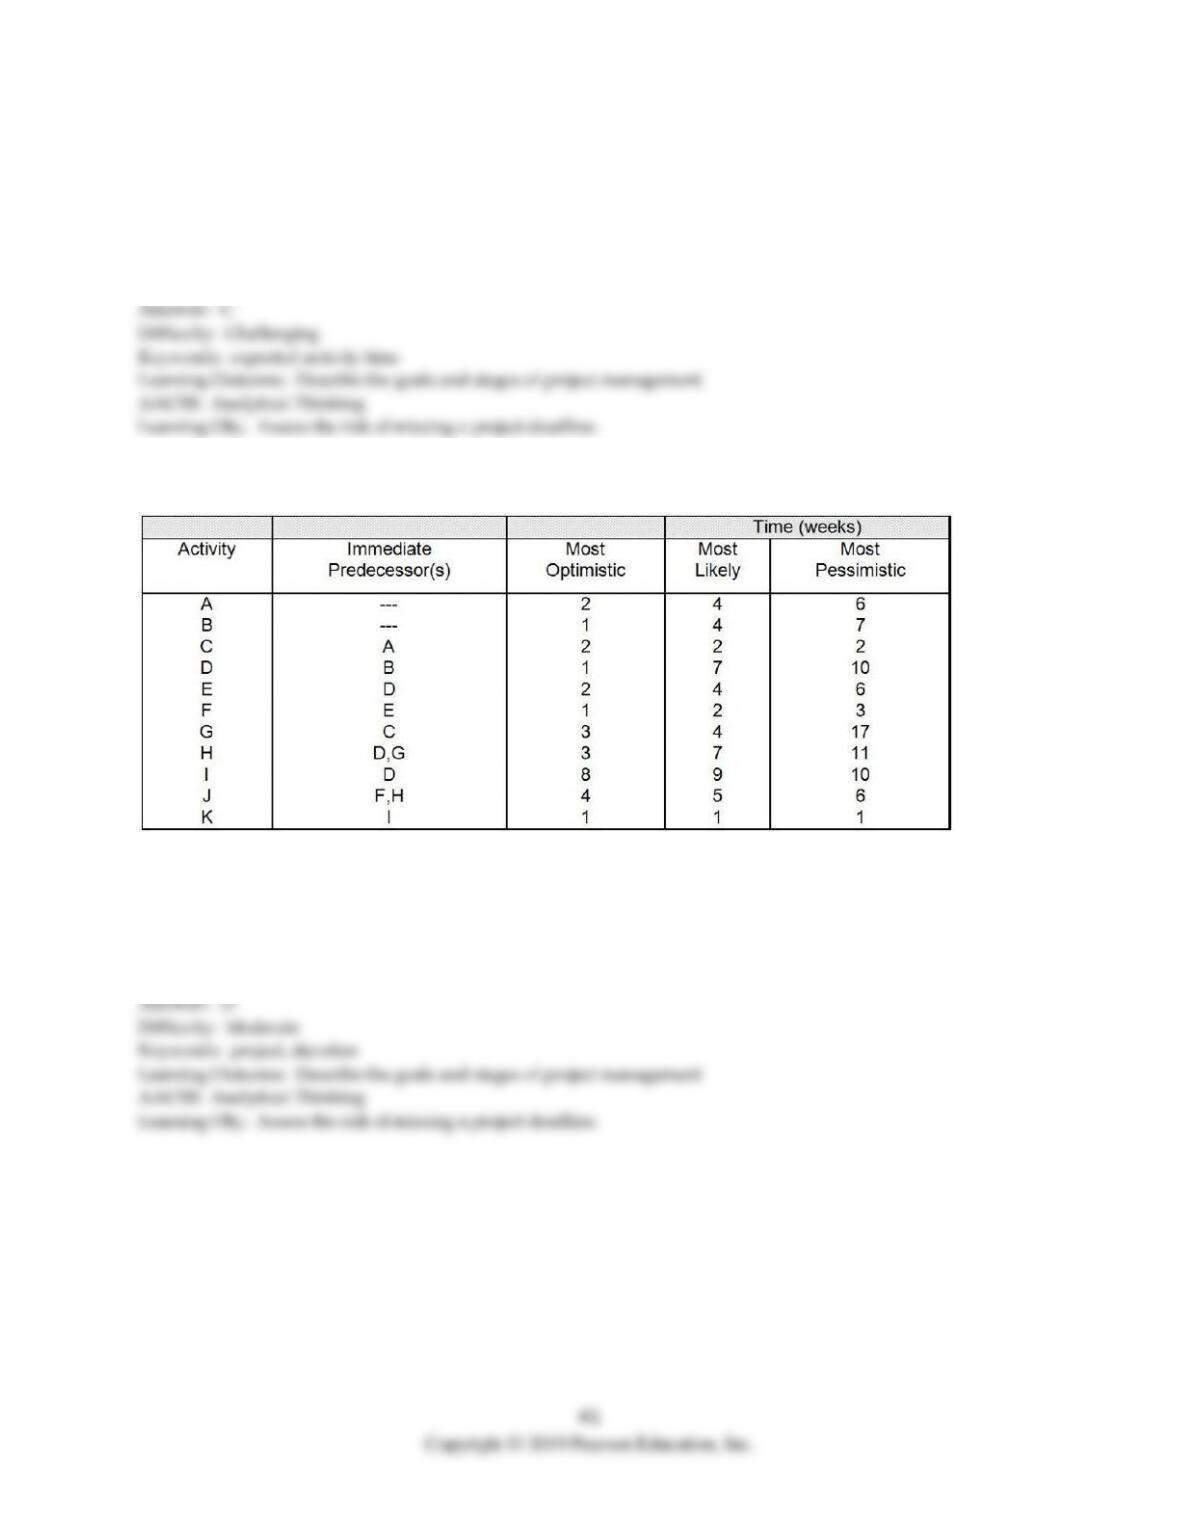
Table 7.3
15) Using Table 7.3, what is the earliest expected time of completion of the whole project?
A) fewer than or equal to 21 days
B) greater than 21 but fewer than or equal to 22 days
C) greater than 22 but fewer than or equal to 23 days
D) greater than 23 days

16) Using Table 7.3, which activity is on the critical path?
A) Activity D
B) Activity F
C) Activity G
D) Activity K
17) Using Table 7.3, if the project is due to be completed in 28 days, what is the probability that the project
will be completed on or before the due date?
A) less than or equal to 75%
B) greater than 75% but less than or equal to 85%
C) greater than 85% but less than or equal to 95%
D) greater than 95%
18) Using Table 7.3, if the project manager wants at least a 98% probability that the project will be
completed on or before the due date, what is the shortest project due date that will satisfy the manager?
A) fewer than or equal to 28 days
B) greater than 28 days but fewer than or equal to 30 days
C) greater than 30 days but fewer than or equal to 32 days
D) greater than 32 days
Table 7.13
All activity times for the project are in weeks.
Activity
Predecessor
Optimistic
Most Likely
Pessimistic
A
—
12
16
25
B
—
7
14
22
C
—
5
10
14
D
A
15
18
25
E
C
8
12
18
F
B
9
12
15
G
F
18
22
29
H
D, E, G
15
19
27
19) Using Table 7.13, what is the critical path of this project?
A) A–D–H
B) C–E–H
C) B–F–G–H
D) C–E–H and B–F–G–H are both critical.
20) Using Table 7.13, what is the expected time of completion of the project?
A) fewer than 60 weeks
B) between 60 and 65 weeks
C) between 65 and 70 weeks
D) greater than 70 weeks
21) Using Table 7.13, what is the probability that the project will be completed in 65 or fewer weeks?
A) less than or equal to 20%
B) greater than 20% but less than or equal to 24%
C) greater than 24% but less than or equal to 28%
D) greater than 28%
22) Using Table 7.13, if the expected time for activity H is changed to 25 weeks, by how many weeks will
the project’s expected completion time increase?
A) It will increase by one week.
B) It will increase by three weeks.
C) It will increase by two weeks.
D) It will increase by four weeks.
Table 7.14
You are responsible for managing a project with the following activities (times are given in weeks).
Task
Predecessor
Optimistic
Most Likely
Pessimistic
A
—
5
8
10
B
A
7
10
12
C
B
8
10
14
D
—
11
15
20
E
D
12
14
18
23) Using Table 7.14, what is the critical path and expected completion time for this project?
A) D–E; 29.5 weeks
B) A–B–C; 25 weeks
C) D–E; 27.5 weeks
D) A–B–C; 26.5 weeks
24) Using Table 7.14, which activity has the largest standard deviation, and how large is that standard
deviation?
A) Activity A; 0.83 weeks
B) Activity B; 1.25 weeks
C) Activity D; 1.5 weeks
D) Activity C; 1.25 weeks

25) Using Table 7.14, what is the probability of completing the project in 29 or fewer weeks?
A) less than or equal to 40%
B) greater than 40% but less than or equal to 45%
C) greater than 45% but less than or equal to 50%
D) greater than 50%
26) Using Table 7.14, what is the probability that the project will take 16 or more weeks to complete?
A) less than or equal to 20%
B) greater than 20% but less than or equal to 25%
C) greater than 25% but less than or equal to 30%
D) greater than 30%
27) Using Table 7.14, if the expected time for activity C is changed to 12 weeks, by how many weeks will
the project’s expected completion time increase?
A) It will not change.
B) It will increase by one week.
C) It will increase by two weeks.
D) It will increase by three weeks.
28) Assuming a beta distribution is being used, if the most pessimistic time for an activity increases by six
weeks, what will happen to the expected time for that activity?
A) It will increase by one week.
B) It will decrease by one week.
C) It will increase by six weeks.
D) It will remain the same.

29) The probability that a project will be completed by its earliest expected completion date is:
A) 50 percent.
B) 95 percent.
C) 100 percent.
D) impossible to determine.
30) If the sum of the variances on the critical path (and all other network paths) is equal to zero, what is
the probability that the project will be completed by its earliest expected completion date?
A) 50 percent
B) 95 percent
C) 100 percent
D) It cannot be determined.
31) The ________ is the shortest time in which an activity can be completed if all goes exceptionally well.
32) To find the standard deviation of the critical path, you must first add the ________ of all activities on
the critical path.
33) A(n) ________ identifies the key threats to a project and prescribes ways to work around them.
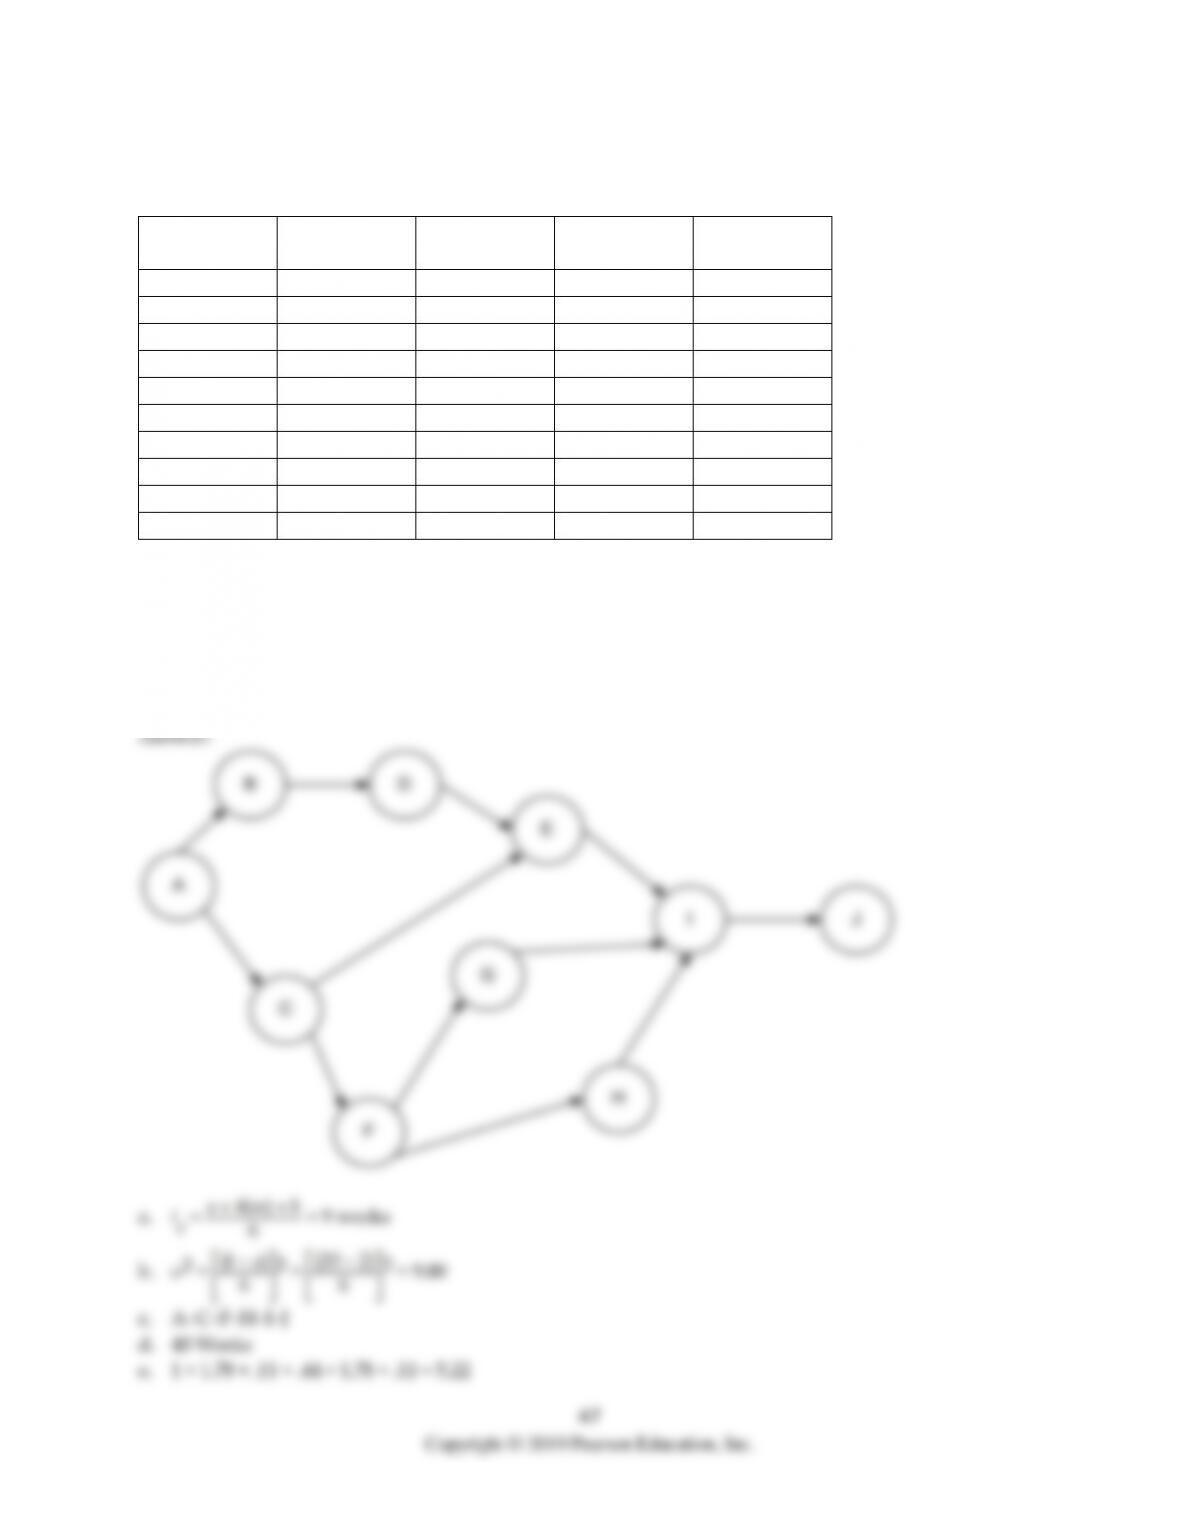
34) Consider the activities, durations, and predecessor relationships in the following network. Draw the
network and answer the questions that follow.
Activity
Description
Immediate
Predecessor(s)
Optimistic
(Weeks)
Most Likely
(Weeks)
Pessimistic
(Weeks)
A
—
4
7
10
B
A
2
8
20
C
A
8
12
16
D
B
1
2
3
E
D, C
6
8
22
F
C
2
3
4
G
F
2
2
2
H
F
6
8
10
I
E, G, H
4
8
12
J
I
1
2
3
a. What is the expected time for activity B?
b. What is the variance for activity B?
c. Based on the calculation of estimated times, what is the critical path?
d. What is the estimated time of the critical path?
e. What is the activity variance along the critical path?
f. What is the probability of completion of the project before week 42?
48
Copyright © 2019 Pearson Education, Inc.
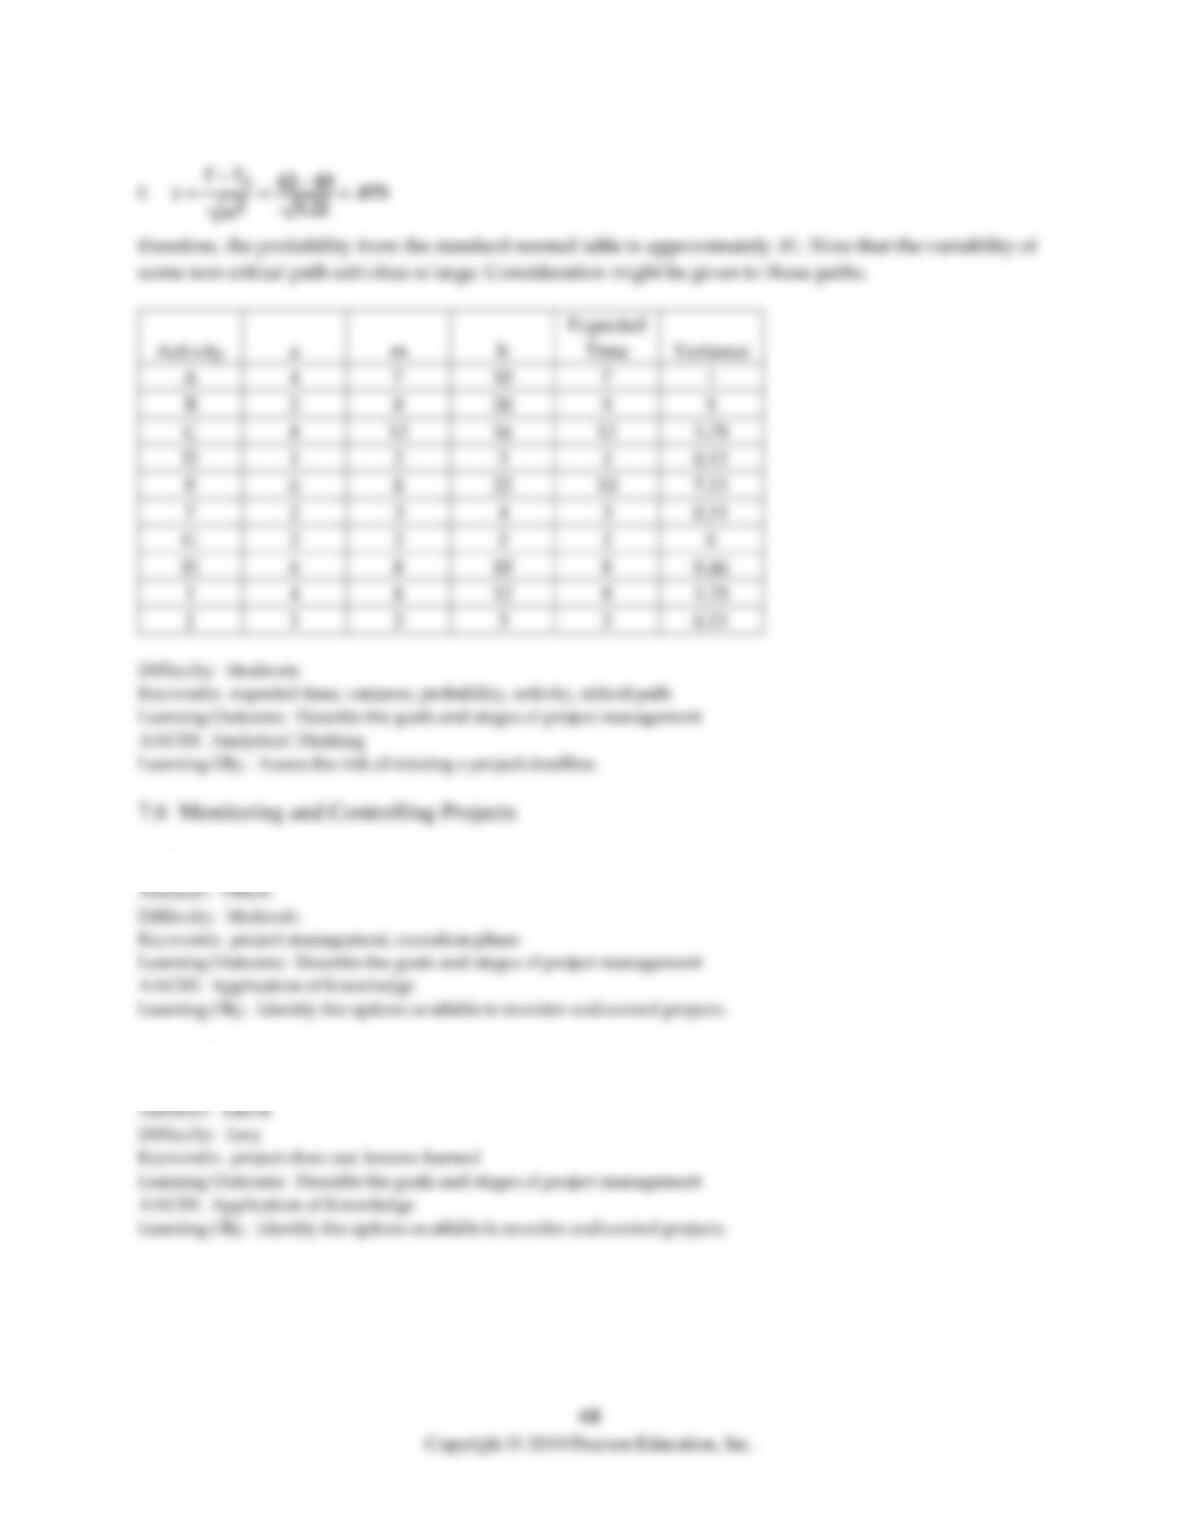
f. z = = = .875
therefore, the probability from the standard normal table is approximately .81. Note that the variability of
some non-critical path activities is large. Consideration might be given to those paths.
Activity
a
m
b
Expected
Time
Variance
A
4
7
10
7
1
B
2
8
20
9
9
C
8
12
16
12
1.78
D
1
2
3
2
0.11
E
6
8
22
10
7.11
F
2
3
4
3
0.11
G
2
2
2
2
0
H
6
8
10
8
0.44
I
4
8
12
8
1.78
J
1
2
3
2
0.11
Difficulty: Moderate
Keywords: expected time, variance, probability, activity, critical path
Learning Outcome: Describe the goals and stages of project management
AACSB: Analytical Thinking
Learning Obj.: Assess the risk of missing a project deadline.
7.6 Monitoring and Controlling Projects
1) The phase of project management that takes the most resources is the execution phase.
2) In addition to finishing the work, the project close out phase should include recording some lessons–
learned to carry forward to future projects.

3) Which of these steps comes first in the project life cycle?
A) close out
B) definition and organization
C) execution
D) planning
4) A project manager hires a few new coders to help speed up the new software project and deliver the
package on time to an important client. The manager has engaged in:
A) resource leveling.
B) resource allocation.
C) resource acquisition.
D) resource enhancement.
5) The savvy project manager knew there would be a high demand for finish carpenters in late October,
so she started a crew early on one section of the house so they would be available to help elsewhere later
on. This project manager is engaging in:
A) resource allocation.
B) resource acquisition.
C) resource scheduling.
D) resource leveling.
6) The phase of project management that takes the most resources is the ________, during which
managers focus on activities that pertain to deliverables.
7) ________ is an attempt to reduce the peaks and valleys in resource needs by shifting the schedules of
conflicting activities within their earliest and latest start dates.
8) The project manager and team can step back and examine how the project work was accomplished
during the ________ phase of the project.
9) A project tracking system should collect information on three topics for the project manager. What are
these topics, why are they important, and what actions can the manager take to address any concerns that
surface?
Answer: The three topics are open issues, risks, and the schedule status. Open issues consist of any ideas,
concerns, or questions that were raised during the project life cycle that have yet to be resolved. The
10) What options do project managers have to alleviate resource problems? Briefly describe each method.