21
6) Wider limits on a control chart result in lower probability of a type I error.
7) A process is monitored with a control chart. The process is correctly judged to be in–control once the
results from the most recent sample are plotted. Therefore, all of the output produced at that time is
good.
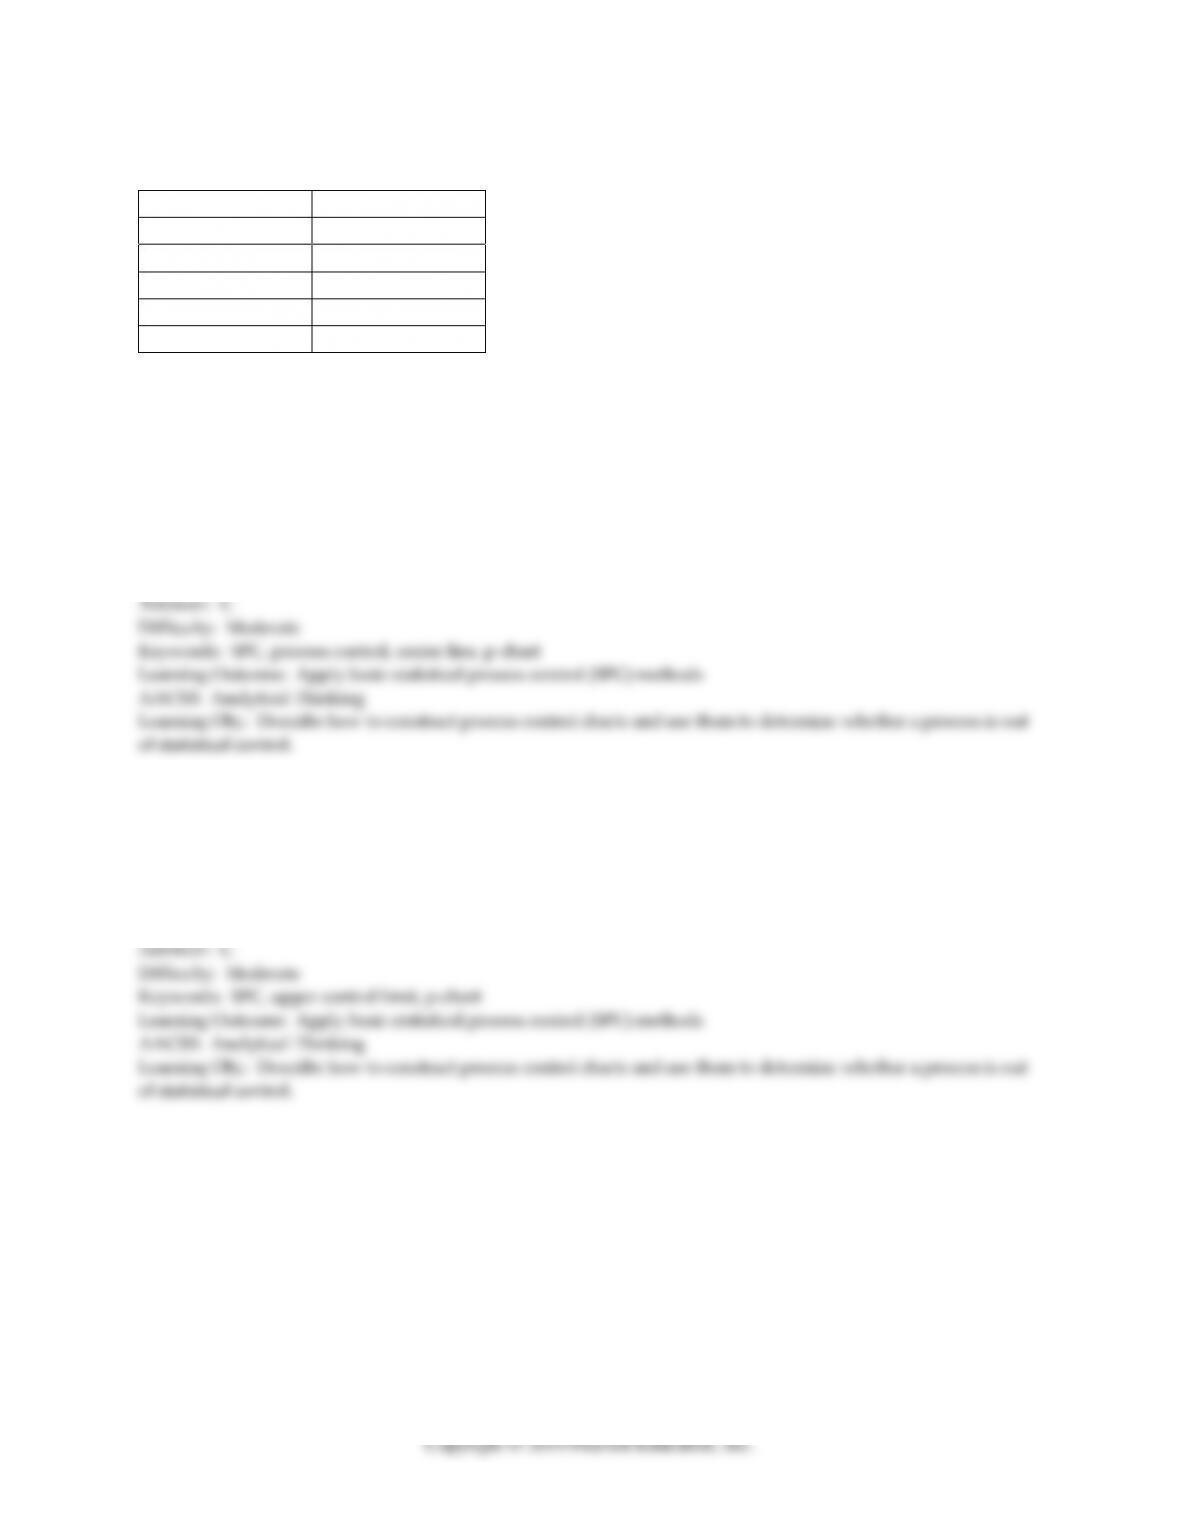
8) One chart commonly used for quality measures based on product or service attributes is the chart.
9) Process centering is shown by an chart.
10) The process and R-charts are developed using a sample size of 5, but the technician mistakenly
looks up A2, D3, and D4 values for a sample size of 7. If these charts are put into daily use, the
manufacturer will mistakenly ship more bad product than had the charts been constructed correctly.
22
11) The advantage of variable measurements is that they can be quickly counted compared to attribute
measurements.
12) Which of the following would be a “common” cause of variation?
A) random sources
B) a machine in need of repair
C) an untrained worker
D) a defective raw material
13) In Statistical Process Control, ________ are used to detect defects and determine if the process has
deviated from design specifications.
A) flowcharts
B) cause-and-effect diagrams
C) process capability charts
D) control charts
23
14) A sampling plan is best for evaluating quality when:
(1) Inspection costs are high
(2) Inspection costs are low
(3) Non-destructive testing is available
(4) Destructive testing is required
A) 1 and 3
B) 1 and 4
C) 2 and 3
D) 2 and 4
15) Which one of the following statements about quality control is true?
A) Measurement by attributes is a simple yes or no decision.
B) Complete inspection is used when inspection cost is high.
C) Sampling inspection is used when the cost of passing a defective unit is high relative to the cost of
inspection.
D) Measurement by variables is often used when the quality specifications are complex.
16) Which one of the following statements relating to quality is true?
A) Sampling procedures based on measurement by variables should be used when quality specifications
are complex.
B) A distribution of sample means has more variance than the process distribution itself.
C) The distribution of sample means can be approximated by the normal distribution.
D) Sampling is a better approach than 100 percent inspection when the cost of accepting a defective item
is very high.
24
17) When should complete inspection be used?
A) when inspection tests are destructive
B) when inspection tasks are monotonous
C) when the cost of product failure is high relative to the inspection costs
D) when quality is a competitive priority
18) An operator of a filling machine plotted the weights of each bag she filled for three weeks. At the
same time, a quality inspector randomly took groups of five bags of the same output and plotted the
average weights of the samples. The inspector’s sampling distribution will:
A) have greater variability than the operator’s distribution.
B) have less variability than the operator’s distribution.
C) show if the output has been produced to the operator’s specifications.
D) have a mean five times greater than the operator’s distribution.
19) In SPC, the distribution of sample means:
A) can be approximated by the normal distribution.
B) will have greater variability than the process distribution.
C) will always have a mean greater than the process distribution because of the sample size.
D) cannot be used for control charts because the variability is understated.
25
20) The three sigma limits for a process whose distribution conforms to the normal distribution include
approximately:
A) 50% of the observed values, in the long run.
B) 68% of the observed values, in the long run.
C) 95% of the observed values in the long run.
D) 99% of the observed values in the long run.
21) Regarding control charts, a type I error refers to concluding that the process is:
A) in control when it is not in control.
B) incapable when it is capable.
C) out of control when it is in control.
D) capable when it is not capable.
22) An example of a type I error would be:
A) throwing away a perfectly good banana.
B) counting a student’s multiple choice response correct when it is actually incorrect.
C) releasing a guilty defendant.
D) counting a student’s multiple choice response correct when it is actually correct.
26
23) An example of a type II error would be:
A) counting a student’s True/False response incorrect when it is actually correct.
B) convicting an innocent defendant.
C) eating food that you were unaware was spoiled.
D) counting a student’s True/False response incorrect when it is actually incorrect.
24) Regarding control charts, changing from three-sigma limits to two-sigma limits:
A) increases the probability of concluding nothing has changed, when in fact it has.
B) increases the probability of searching for an assignable cause when none exists.
C) decreases the probability that the process average will change.
D) decreases the probability that defects will be generated by the process.
25) Regarding control charts, changing from two–sigma limits to three-sigma limits:
A) increases the probability of concluding nothing has changed, when in fact it has.
B) increases the probability of searching for a cause when none exists.
C) decreases the probability that the process average will change.
D) decreases the probability that defects will be generated by the process.
27
26) The UCL and LCL for an chart are 25 and 15 respectively. The central line is 20, and the process
variability is considered to be in statistical control. The results of the next six sample means are 18, 23, 17,
21, 24, and 16. What should you do?
A) Nothing; the process is in control.
B) Explore the assignable causes because the second, fourth, and fifth samples are above the mean.
C) Explore the assignable causes because there is a run.
D) Explore the assignable causes because there is a trend.
27) The underlying statistical distribution for the p-chart is:
A) Poisson.
B) binomial
C) percentage.
D) normal.
28) A company is interested in monitoring the variability in the weight of the fertilizer bags it produces.
An appropriate control chart would be:
A) an chart.
B) a p-chart.
C) a c-chart.
D) an R-chart.
28
29) A company is interested in monitoring the average time it takes to serve its customers. An
appropriate control chart would be:
A) an chart.
B) a p-chart.
C) a c-chart.
D) an R-chart.
30) A company is interested in monitoring the number of scratches on Plexiglass panels. The appropriate
control chart to use would be:
A) an chart.
B) a p-chart.
C) a c-chart.
D) an R-chart.
31) Which alternative will increase the probability of detecting a shift in the process average?
A) increasing the control limit spread
B) taking smaller samples
C) taking smaller samples more frequently
D) taking larger samples more frequently
29
32) Five samples of size 4 were taken from a process. A range chart was developed that had LCLR = 0 and
UCLR = 2.50. Similarly, an average chart was developed with the average range from the five samples,
with LCL = 15.0 and LCL = 24.0. The ranges for each of the five samples were 1.75, 2.42, 2.75, 2.04, and
2.80, respectively. The values of the sample average for each sample were 19.5, 22.3, 17.4, 20.1, and 18.9,
respectively. What can you tell management from this analysis?
A) The process variability is out of control, and we cannot make a statement about the process average.
B) The process variability is out of control, but the process average is in control.
C) The process variability and the process average are out of control.
D) We cannot tell if the process variability or the process average is out of control.
33) Historically, the average time to service a customer complaint has been 3 days and the standard
deviation has been 0.50 day. Management would like to specify the control limits for an chart with a
sample size of 10- and 3- sigma limits. The LCL for the chart would be:
A) less than 2.40.
B) greater than 2.40 but less than or equal to 2.45.
C) greater than 2.45 but less than or equal to 2.50.
D) greater than 2.50.
34) Historically, the average time to service a customer complaint has been 3 days and the standard
deviation has been 0.50 day. Management would like to specify the control limits for an chart with a
sample size of 10- and 3- sigma limits. Suppose the average service time from the next 10 samples yielded
the following result: 3.2, 2.1, 3.6, 2.8, 3.9, 3.5, 2.7, 4.1, 2.6, and 3.3 days. What conclusion can be drawn?
A) Assuming the process variability is in control, the process average is also in statistical control.
B) Assuming the process average is in control, the process average is out of statistical control.
C) The sample size should be increased.
D) No conclusion can be drawn because there is insufficient data.
30
35) Historically, the average time to service a customer complaint has been 3 days and the standard
deviation has been 0.50 day. Management would like to specify the control limits for an chart with a
sample size of 10 and 3- sigma limits. The UCL for the chart would be:
A) less than or equal to 3.30.
B) greater than 3.30 but less than or equal to 3.40.
C) greater than 3.40 but less than or equal to 3.50.
D) greater than 3.50.
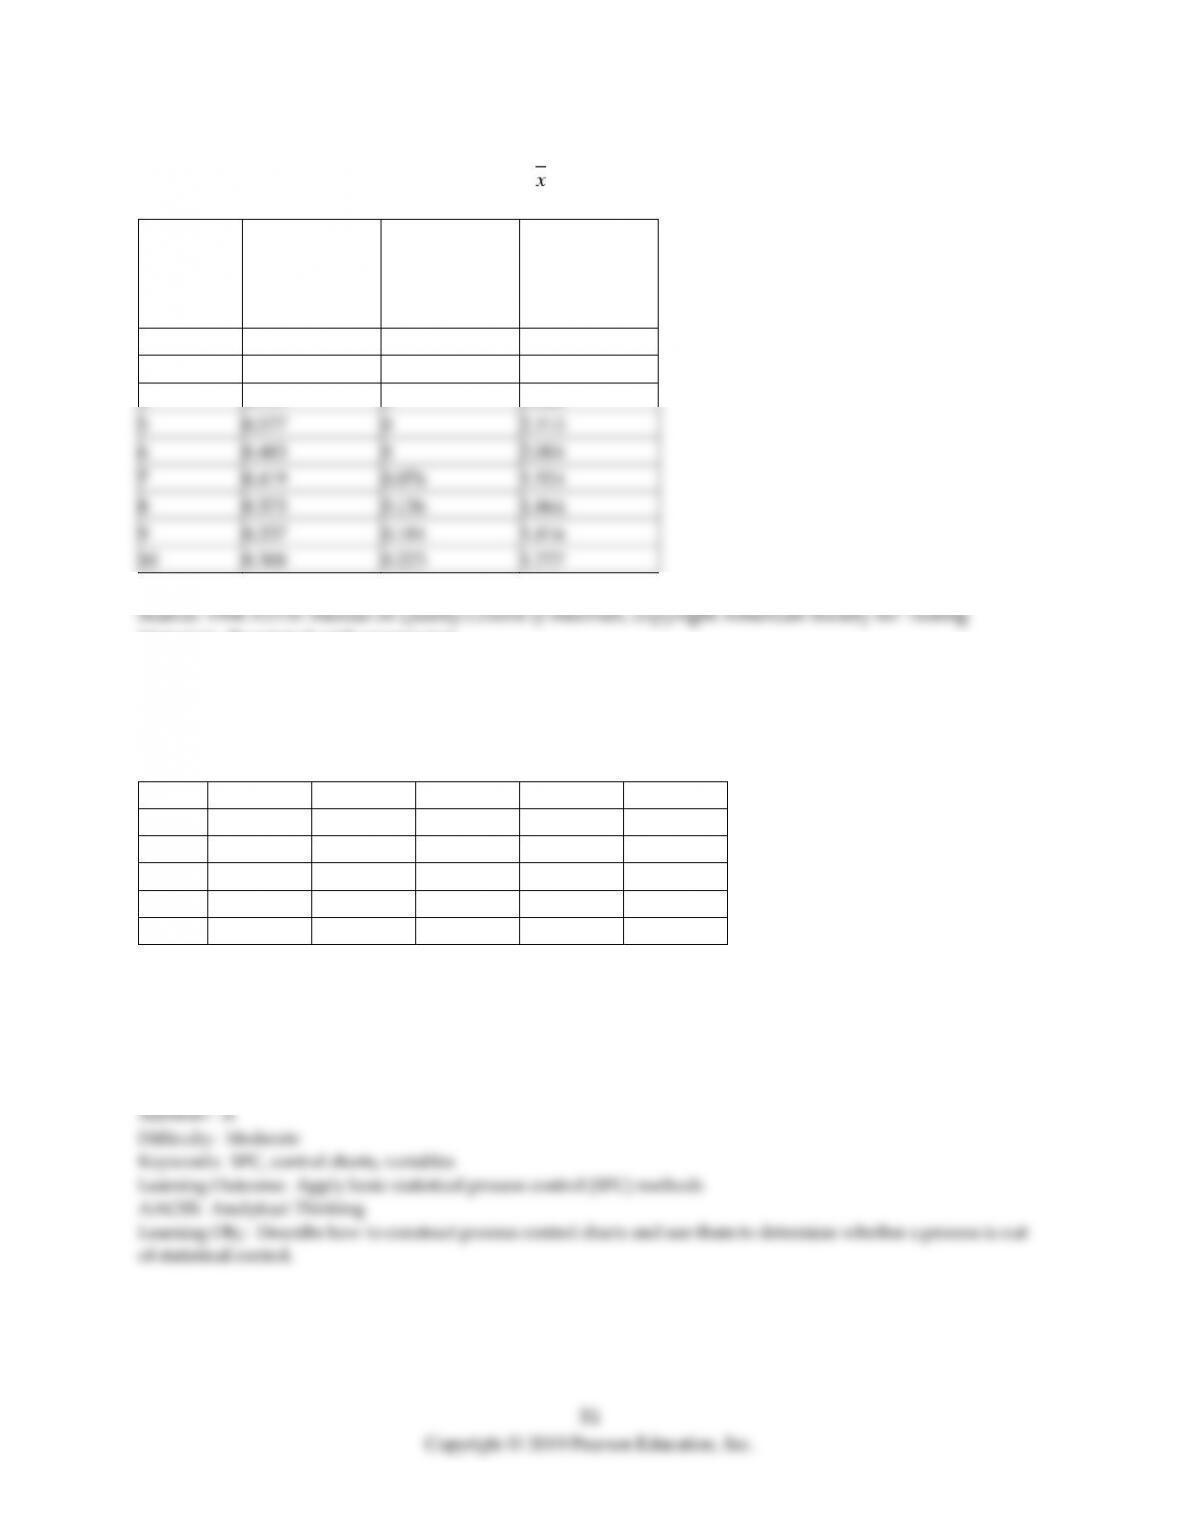
Table 5.11
Factors for Calculating Three-Sigma Limits for the Chart and R-Chart
Size of
Sample
(n)
Factor for UCL
and LCL for
x-bar-Charts
A2
Factor for
LCL for
R-Charts
D3
Factor for
UCL for
R-Charts
D4
2
1.880
0
3.267
3
1.023
0
2.575
4
0.729
0
2.282
5
0.577
0
2.115
6
0.483
0
2.004
7
0.419
0.076
1.924
8
0.373
0.136
1.864
9
0.337
0.184
1.816
10
0.308
0.223
1.777
Materials. Reprinted with permission.
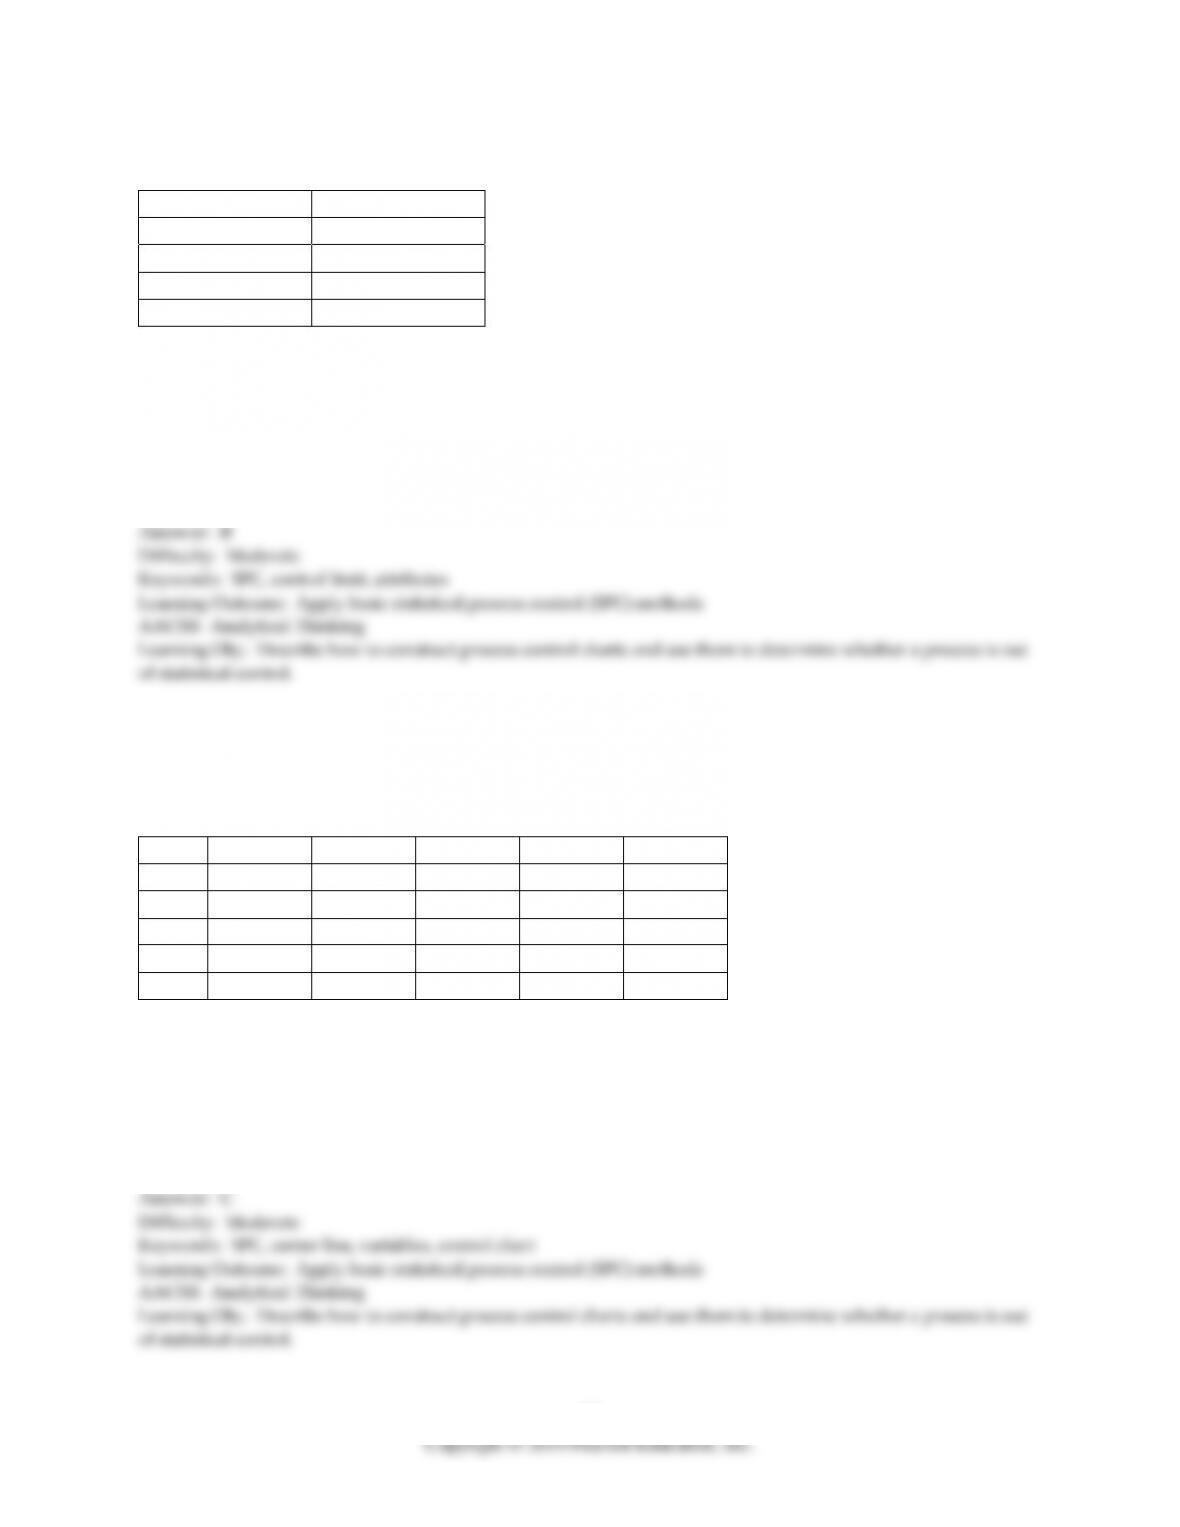
36) Thermostats are subjected to rigorous testing before they are shipped to air conditioning technicians
around the world. Results from the last five samples are shown in the table. Calculate control limits for a
chart that will monitor performance to target. The correct control limits as (LCL,UCL) are:
Unit #
Sample 1
Sample 2
Sample 3
Sample 4
Sample 5
1
73.5
70.8
72.2
73.6
71.0
2
71.3
71.0
73.1
72.7
72.2
3
70.0
72.6
71.9
72.4
73.3
4
71.1
70.6
70.3
74.2
73.6
5
70.8
70.7
70.7
73.5
71.1
A) (70.46, 73.39).
B) (68.94,74.89).
C) (69.71,74.14).
D) (69.80,74.05).
37) Thermostats are subjected to rigorous testing before they are shipped to air conditioning technicians
around the world. Results from the last five samples are shown in the table. Calculate control limits for a
chart that will monitor process consistency. The correct control limits as (LCL,UCL) are:
Unit #
Sample 1
Sample 2
Sample 3
Sample 4
Sample 5
1
73.5
70.8
72.2
73.6
71.0
2
71.3
71.0
73.1
72.7
72.2
3
70.0
72.6
71.9
72.4
73.3
4
71.1
70.6
70.3
74.2
73.6
5
70.8
70.7
70.7
73.5
71.1
A) (-5.37,5.37).
B) (0.00,5.37).
C) (0.00,6.03).
D) (0.00,6.12).
38) Thermostats are subjected to rigorous testing before they are shipped to air conditioning technicians
around the world. Results from the last five samples are shown in the table. Create control charts that will
fully monitor the process and indicate the result of X-bar and R-chart analysis.
Unit #
Sample 1
Sample 2
Sample 3
Sample 4
Sample 5
1
73.5
70.8
72.2
73.6
71.0
2
71.3
71.0
73.1
72.7
72.2
3
70.0
72.6
71.9
72.4
73.3
4
71.1
70.6
70.3
74.2
73.6
5
70.8
70.7
70.7
73.5
71.1
A) x bar and r chart are both out of control
B) x bar chart is in control but r chart is out of control
C) x bar chart is out of control but r chart is in control
D) x bar and r chart are both in control
39) Construct a 3-sigma R-chart for the length in centimeters of a part from the following table. What is
the upper control limit of your R-chart?
Sample #
Observation 1
Observation 2
Observation 3
Observation 4
1
0.486
0.499
0.493
0.511
2
0.499
0.506
0.516
0.494
3
0.496
0.5
0.515
0.488
4
0.495
0.506
0.483
0.487
5
0.472
0.502
0.526
0.469
6
0.473
0.495
0.507
0.493
7
0.495
0.512
0.49
0.471
8
0.525
0.501
0.498
0.474
9
0.497
0.501
0.517
0.506
10
0.495
0.505
0.516
0.511
A) .032
B) 0.51
C) 0.73
D) 2.28

40) Construct a 3-sigma x-bar chart for the length in centimeters of a part from the following table. What is
the upper control limit?
Sample #
Observation 1
Observation 2
Observation 3
Observation 4
1
0.486
0.499
0.493
0.511
2
0.499
0.506
0.516
0.494
3
0.496
0.5
0.515
0.488
4
0.495
0.506
0.483
0.487
5
0.472
0.502
0.526
0.469
6
0.473
0.495
0.507
0.493
7
0.495
0.512
0.49
0.471
8
0.525
0.501
0.498
0.474
9
0.497
0.501
0.517
0.506
10
0.495
0.505
0.516
0.511
A) 0.522
B) 0.509
C) 0.496
D) 0.475
41) Construct 3-sigma X-bar and R-charts using the data in the table. What conclusions can you draw
about the state of control for this process?
Sample #
Observation 1
Observation 2
Observation 3
Observation 4
1
0.486
0.499
0.493
0.511
2
0.499
0.506
0.516
0.494
3
0.496
0.5
0.515
0.488
4
0.495
0.506
0.483
0.487
5
0.472
0.502
0.526
0.469
6
0.473
0.495
0.507
0.493
7
0.495
0.512
0.49
0.471
8
0.525
0.501
0.498
0.474
9
0.497
0.501
0.517
0.506
10
0.495
0.505
0.516
0.511
A) X-bar chart is out of control but the R-chart is in control
B) the X-bar chart is out of control and the R-chart is also out of control
C) the X-bar chart and the R-chart are both in control
D) the X-bar chart is in control but the R-chart is out of control
36
43) The defect rate for a product has historically been about 5.0%. What is the upper control chart limit if
you wish to use a sample size of 50 and 3-sigma limits?
A) 0.082
B) 0.112
C) 0.142
D) 0.172
44) The defect rate for a product has historically been about 7.0%. What is the upper control chart limit if
you wish to use a sample size of 20 and 3-sigma limits?
A) 0.186
B) 0.203
C) 0.222
D) 0.241
45) The consultant suspiciously eyed the c-chart that Chickenverks used to monitor the number of broken
eggs in each 100 egg carton. “You know you really should be using a p-chart,” the consultant commented
with an air of superiority. “What‘s the difference between a p-chart and a c-chart in this application?” the
long time Chickenverks employee asked with an obvious edge to his voice. “Well,” the consultant replied,
“the difference is:
A) the width of the three sigma limits for the c–chart is 100 times greater than those of the p-chart.”
B) the three-sigma p–chart will catch problems earlier than the three sigma c-chart.”
C) the three-sigma c–chart will catch problems earlier than the three sigma p-chart.”
D) well, OK, you got me. The charts will look and behave the same for all practical purposes.”
37
46) Historically, the average proportion of defective bars has been 0.015. Samples will be of 100 bars each.
Construct a p-chart using z = 3. What is the value of UCL?
A) less than or equal to 0.050
B) greater than 0.050 but less than or equal to 0.060
C) greater than 0.060 but less than or equal to 0.070
D) greater than 0.070
47) Historically, the average proportion of defective bars has been 0.015. Samples will be of 100 bars each.
Construct a p-chart using z = 3. What is the value of LCL?
A) less than or equal to 0.01
B) greater than 0.01 but less than or equal to 0.02
C) greater than 0.02 but less than or equal to 0.03
D) greater than 0.03
38
Table 5.3
Sample Number
Number Defective
1
1
2
4
3
2
4
4
5
0
48) Samples of 100 checks each were taken at a bank from an encoding machine (which records the
amount of a check) over a five-day period. Details are summarized in Table 5.3. If the bank were to use
the average proportion defective from these five samples as the central line for a process control chart,
what would be the central line?
A) less than or equal to 0.01
B) greater than 0.01 but less than or equal to 0.02
C) greater than 0.02 but less than or equal to 0.03
D) greater than 0.03
49) Use the information from Table 5.3. What is the upper control limit (UCL) if the bank were to use z = 2
and a sample size of 100?
A) less than or equal to 0.02
B) greater than 0.02 but less than or equal to 0.04
C) greater than 0.04 but less than or equal to 0.06
D) greater than 0.06
39
50) Four samples of 100 each were taken from an assembly line, with the following results:
Sample Number
Number Defective
1
6
2
12
3
2
4
8
Using the historical average as the central line of the chart, which one of the following is the limit for an
attributes control chart with z = 2?
A) UCL > 0.1 and LCL > 0.03
B) UCL > 0.1 and LCL < 0.03
C) UCL < 0.1 and LCL > 0.03
D) UCL < 0.1 and LCL < 0.03
Table 5.4
The manager of Champion Cooling Company has recently implemented a statistical process control
method. The accompanying table shows the recorded temperatures of five different samples of walk-in
coolers that were produced in the previous month.
Sample 1
Sample 2
Sample 3
Sample 4
Sample 5
Unit 1
104.0
100.1
101.1
102.0
102.7
Unit 2
106.4
104.4
100.4
105.9
105.4
Unit 3
101.8
103.6
103.0
104.6
106.1
Unit 4
105.6
101.4
101.0
102.1
102.5
Unit 5
100.6
100.7
104.9
107.0
102.0
51) Using the data in Table 5.4, what is the value of the center line for the chart that monitors performance
to target?
A) 3.9
B) 102.0
C) 103.2
D) 103.7
40
52) Use the information in Table 5.4. The first point plotted on the x-bar chart has a value of:
A) 104.3.
B) 103.7.
C) 102.0.
D) 103.2.
53) Use the information in Table 5.4. The upper control limit for the x-bar chart with three sigma limits is:
A) 105.9.
B) 103.7.
C) 103.2.
D) 102.3.
54) Use the information in Table 5.4. The center line of the R-chart is:
A) 4.4.
B) 3.9.
C) 4.8.
D) 5.9.