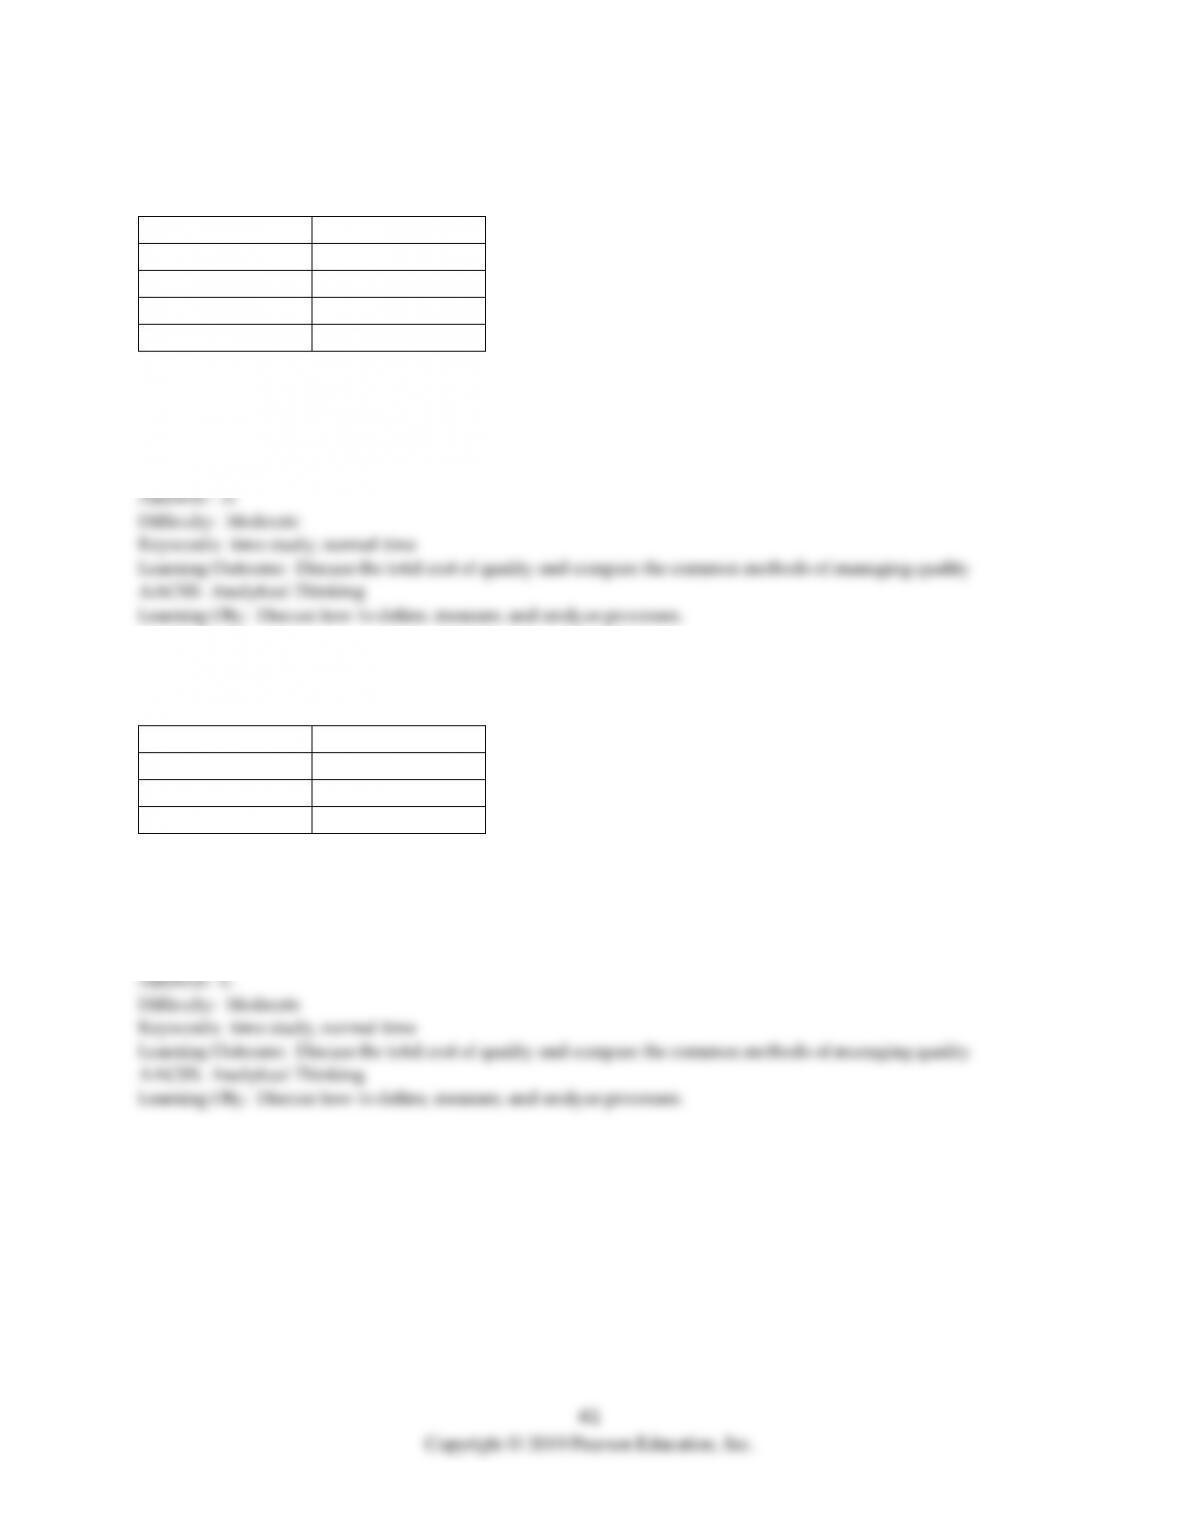
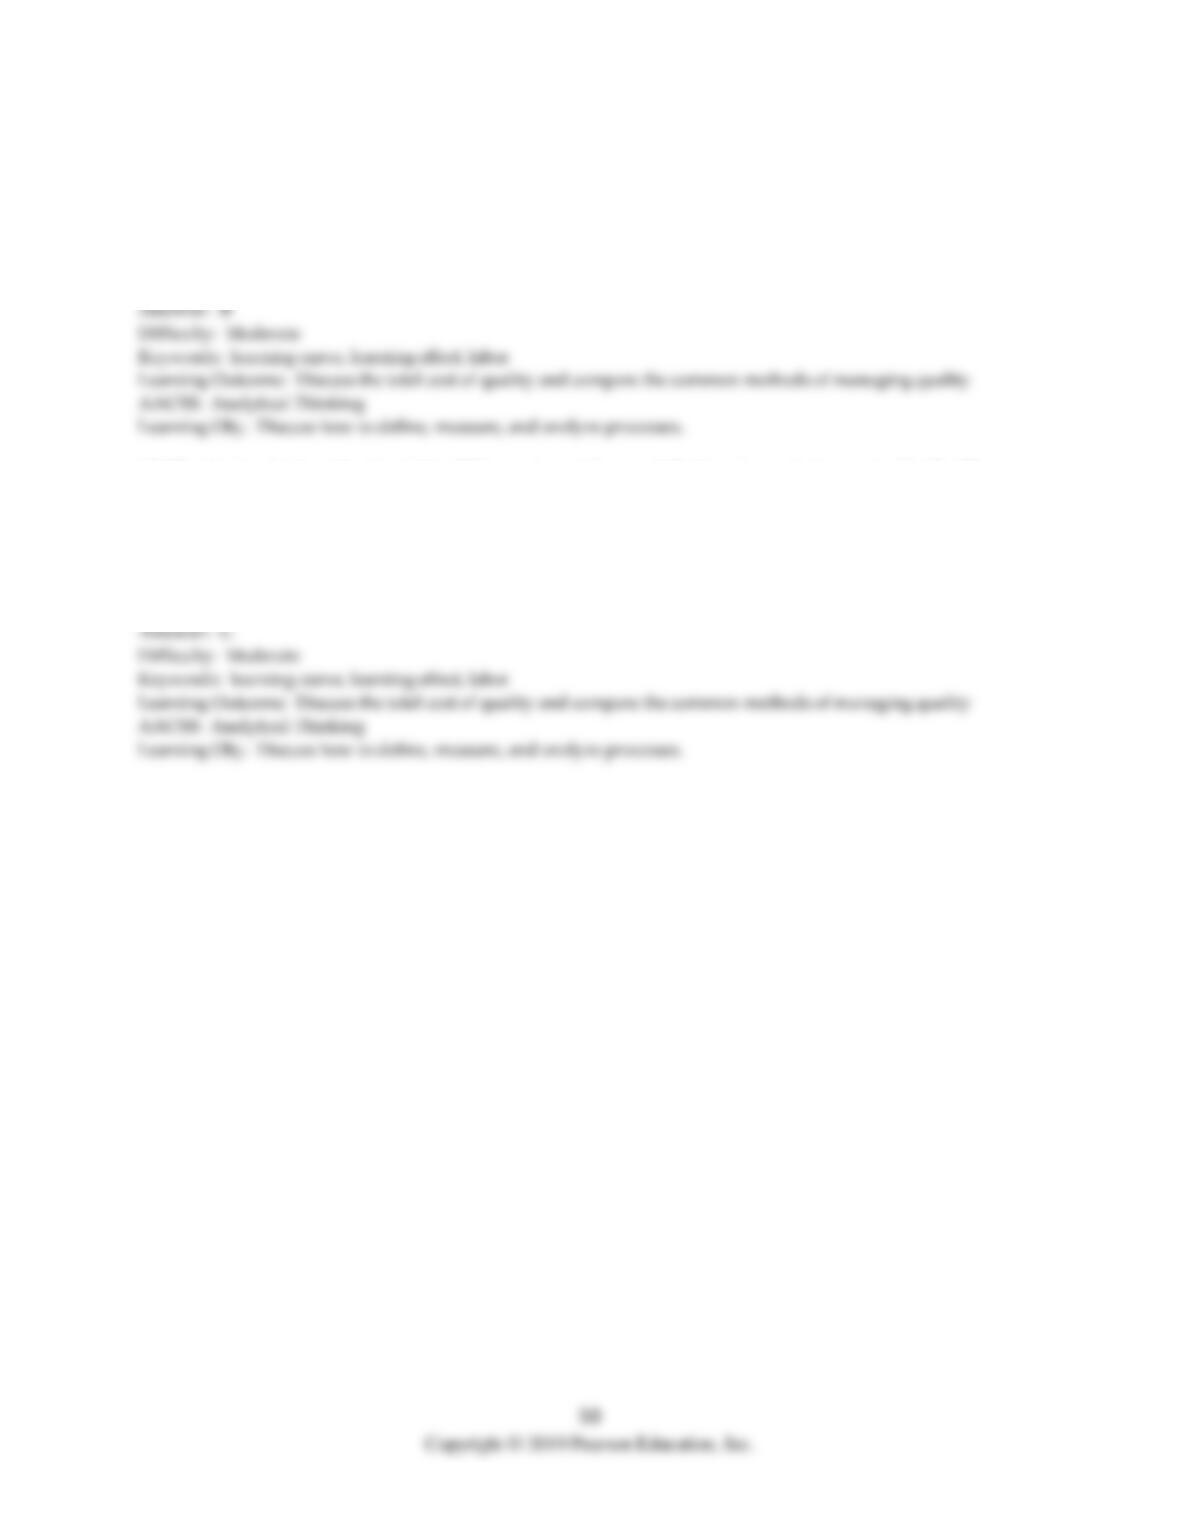
36) Garman observes a worker assembling peanut valves and records the data displayed in the table.
What is the normal time for this job element if the worker is rated at 80%?
Time (seconds)
Observations
20
10
25
15
30
12
35
12
A) less than 23 seconds
B) greater than or equal to 23 seconds but less than 26 seconds
C) greater than or equal to 26 seconds but less than 29 seconds
D) greater than or equal to 29 seconds
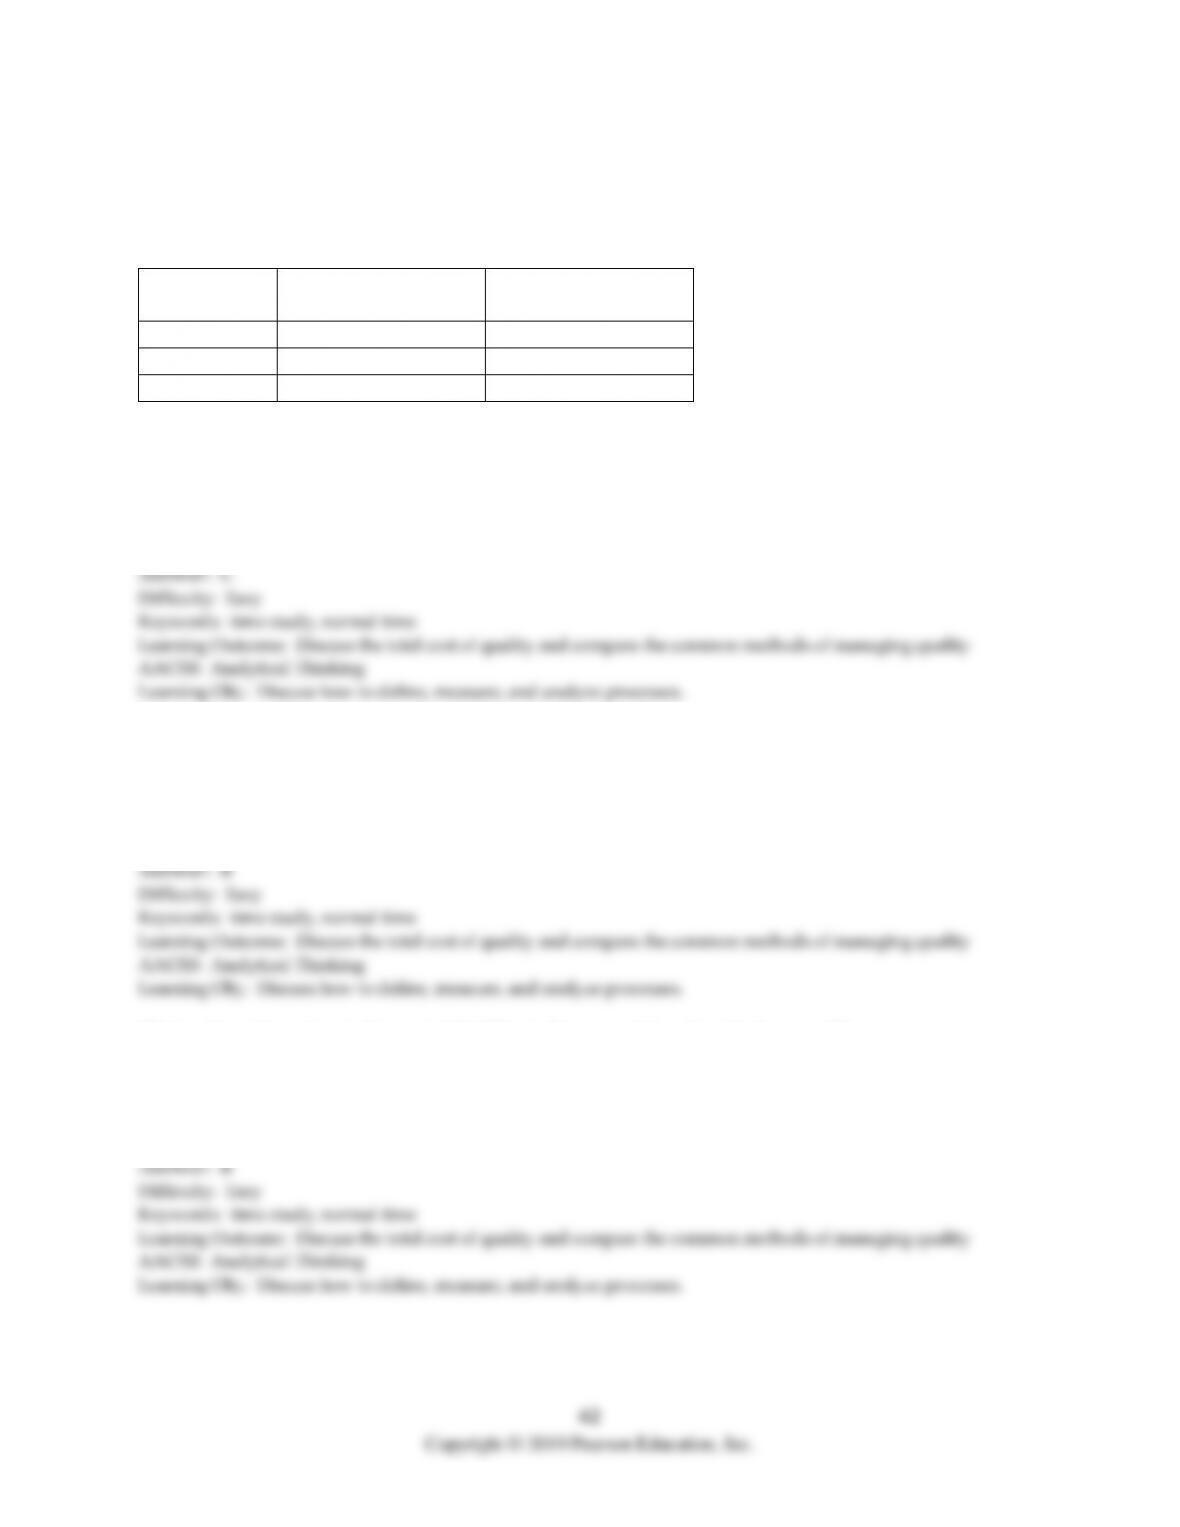
37) Keith assembles peanut valves and the recorded data is displayed in the table. What is the normal
time for this job element if he is rated at 75%?
Time (minutes)
Observations
2.5
15
3.0
23
3.5
27
A) greater than or equal to 3 minutes
B) less than 3 minutes but greater than or equal to 2.6 minutes
C) less than 2.6 minutes but greater than or equal to 2.2 minutes
D) less than 2.2 minutes
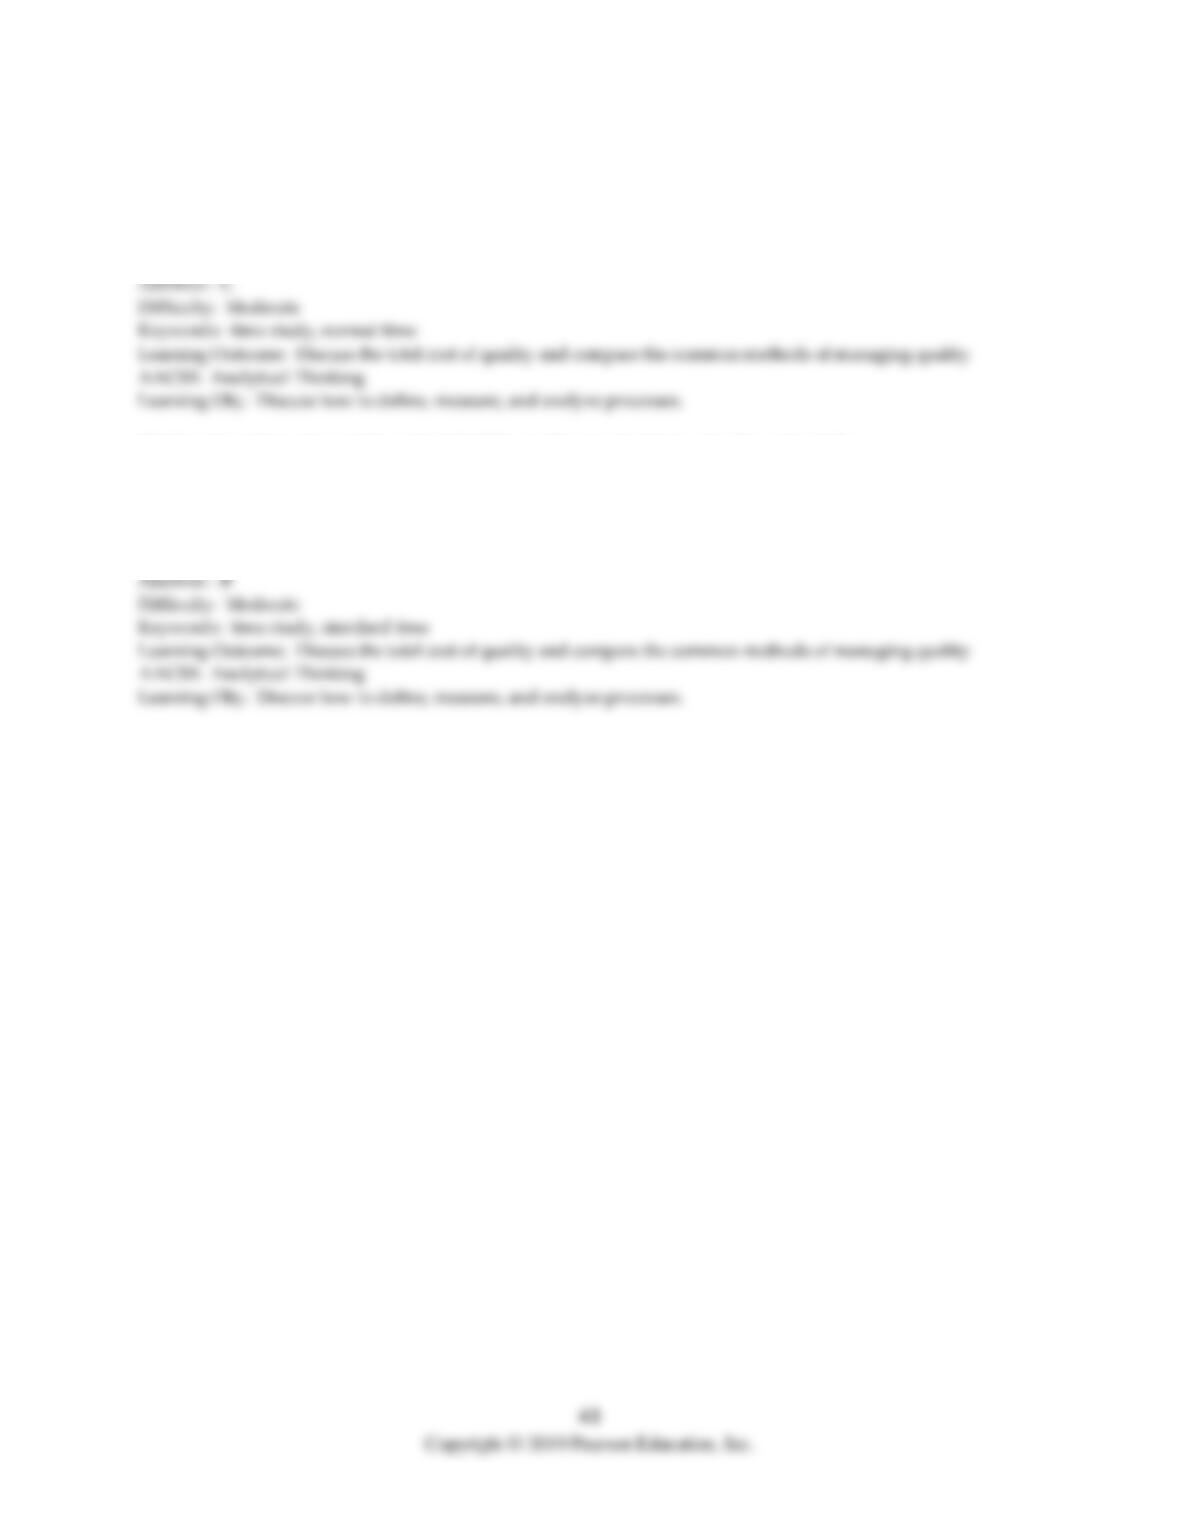
Scenario 2.3
A job consists of three elements. Twenty observations for each element were timed, and the resulting data
are shown in the following table. A performance rating has also been assigned for each element, as shown
in the table. The job has an allowance of 15% of normal time.
Element
Performance Rating (%)
Average Element Time
(in minutes)
# 1
70
3.6
# 2
110
2.5
# 3
90
3.1
38) Use the information in Scenario 2.3. What is the normal time for job element #1?
A) greater than or equal to 3 minutes
B) less than 3 minutes but greater than or equal to 2.6 minutes
C) less than 2.6 minutes but greater than or equal to 2.2 minutes
D) less than 2.2 minutes
39) Use the information in Scenario 2.3. What is the normal time for job element #2?
A) greater than or equal to 3 minutes
B) less than 3 minutes but greater than or equal to 2.6 minutes
C) less than 2.6 minutes but greater than or equal to 2.2 minutes
D) less than 2.2 minutes
40) Use the information in Scenario 2.3. What is the normal time for job element #3?
A) greater than or equal to 3 minutes
B) less than 3 minutes but greater than or equal to 2.6 minutes
C) less than 2.6 minutes but greater than or equal to 2.2 minutes
D) less than 2.2 minutes
41) Use the information in Scenario 2.3. What is the normal time for the entire job?
A) greater than or equal to 10.0 minutes
B) less than 10.0 minutes but greater than or equal to 8.5 minutes
C) less than 8.5 minutes but greater than or equal to 7.0 minutes
D) less than 7.0 minutes
42) Use the information in Scenario 2.3. What is the standard time for the entire job?
A) greater than or equal to 10.0 minutes
B) less than 10.0 minutes but greater than or equal to 8.5 minutes
C) less than 8.5 minutes but greater than or equal to 7.0 minutes
D) less than 7.0 minutes
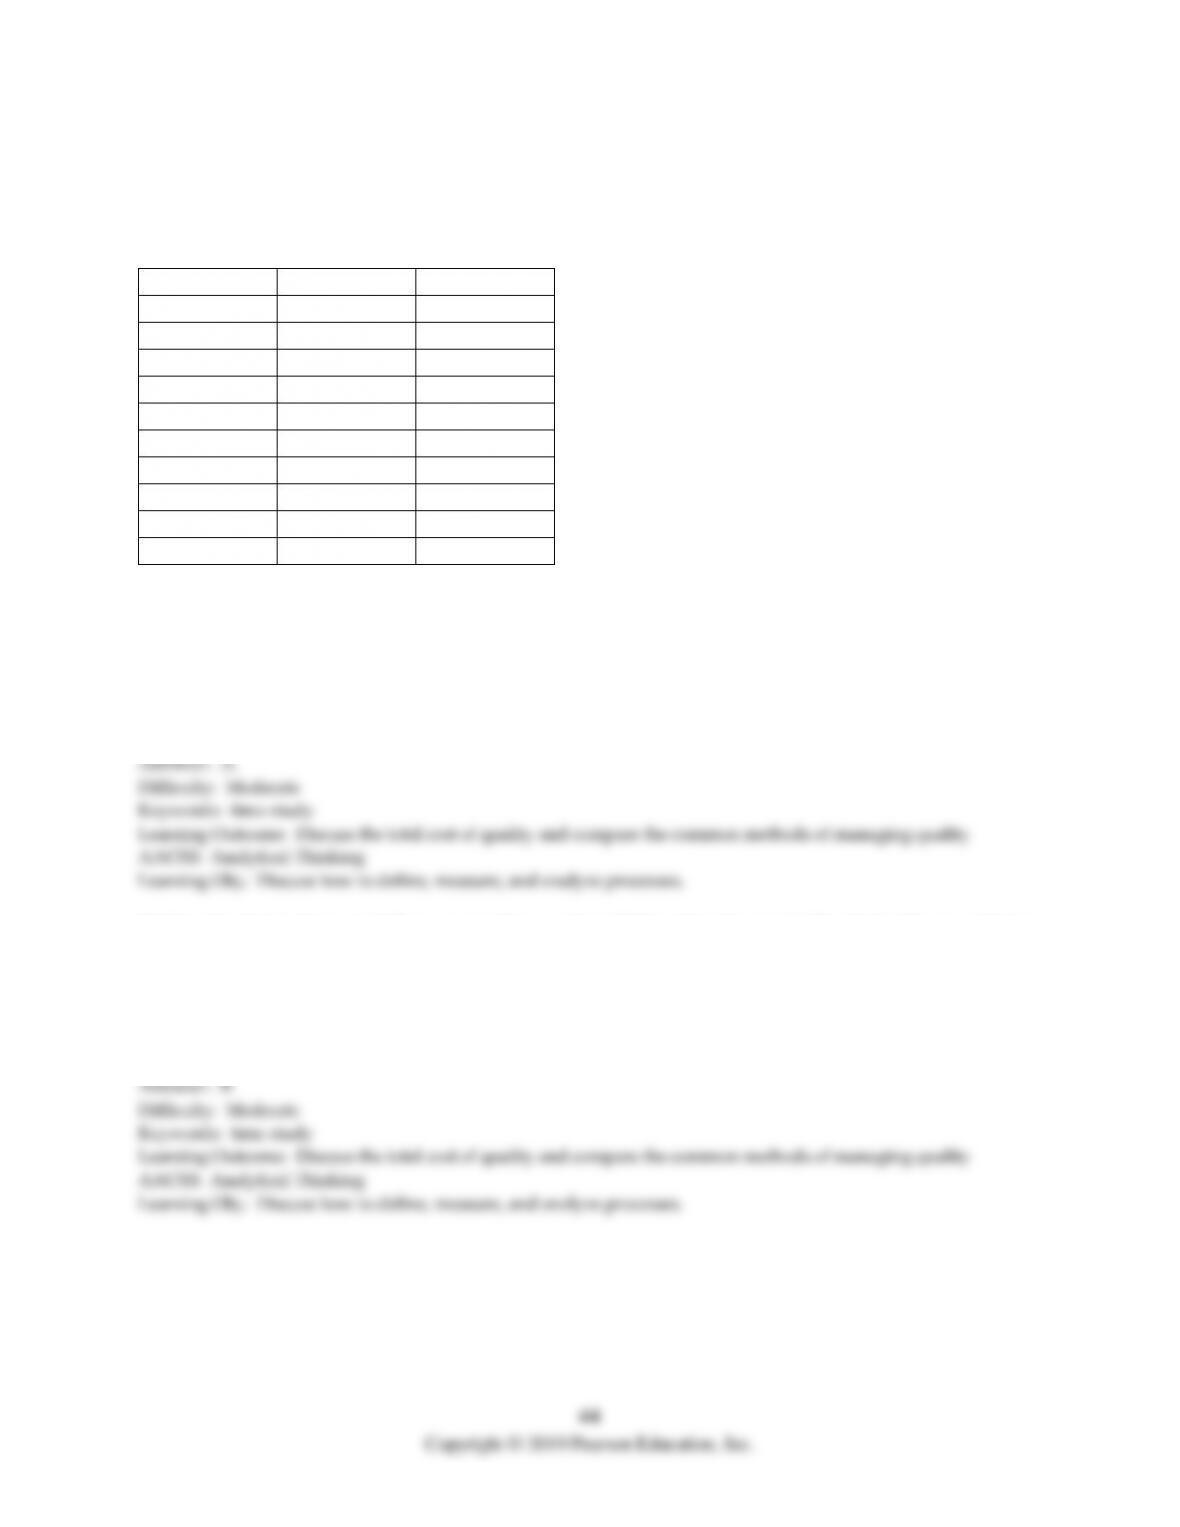
Scenario 2.5
A job consists of three distinct work elements that were timed with a highly accurate Swiss watch by a
trained industrial engineer. The engineer recorded ten observations listed in the following table. All
recorded times are in seconds.
Element 1
Element 2
Element 3
15
23
45
17
25
51
16
23
52
13
26
49
15
25
46
14
23
43
16
24
51
14
25
50
15
23
49
16
22
49
43) Use the data in Scenario 2.5 to answer this question. If the performance rating factor is 15%, what is
the average time for Element 1?
A) 15.1 seconds
B) 16.61 seconds
C) 19.1 seconds
D) 14.44 seconds
44) Use the data in Scenario 2.5 to answer this question. If the rating factor is 1.15, what is the normal time
for Element 2?
A) 23.9 seconds
B) 27.5 seconds
C) 28.1 seconds
D) 31.6 seconds

45) Use the data in Scenario 2.5 to answer this question. If the rating factor is 1.15, what is the normal time
for Element 3?
A) 44.3 seconds
B) 55.8 seconds
C) 50.9 seconds
D) 48.5 seconds
46) Use the data in Scenario 2.5 to answer this question. If the rating factor is 15% for all the elements,
what is the normal process time for the entire job?
A) 109.27 seconds
B) 82.62 seconds
C) 100.63 seconds
D) 95.02 seconds
47) Use the data in Scenario 2.5 to answer this question. If the rating factor is 10% for all the elements and
the allowance is 15% for the whole process, what is the standard process time for the job?
A) 110.69 seconds
B) 82.62 seconds
C) 109.27 seconds
D) 95.02 seconds
48) A time study analyst is attempting to determine the standard time for a work element. She observes a
worker performing the work element at a higher-than-average pace. How will this fact be reflected in the
time standard that is eventually created?
A) The frequency of the work element per cycle will be increased.
B) The proportion of allowance time will be increased above 1.0.
C) The performance rating factor will be set greater than 1.0.
D) The normal time for the work element will be increased.
49) A manager is interested in setting a time standard for a machining operation. Which one of the
following is least likely to be of use?
A) time-study method
B) elemental standard data approach
C) predetermined data approach
D) work sampling method
50) Which of the following is not an advantage of the predetermined data approach to work
measurement?
A) Standards can be set before production begins.
B) New work methods can be compared without conducting a time study.
C) Performance ratings are not needed to derive standards.
D) The approach is particularly applicable to firms with a flexible flow strategy.
51) Which work measurement technique breaks down tasks into a series of generic micromotions?
A) time study method
B) elemental standard data approach
C) predetermined data approach
D) work-sampling method
52) Work sampling is most often used in situations in which:
A) a time standard is needed for a repetitive job.
B) an estimate of the proportion of the time spent on a particular activity is needed.
C) it is important to keep the sample size down.
D) special training is required for the observer, and stopwatches must be used.
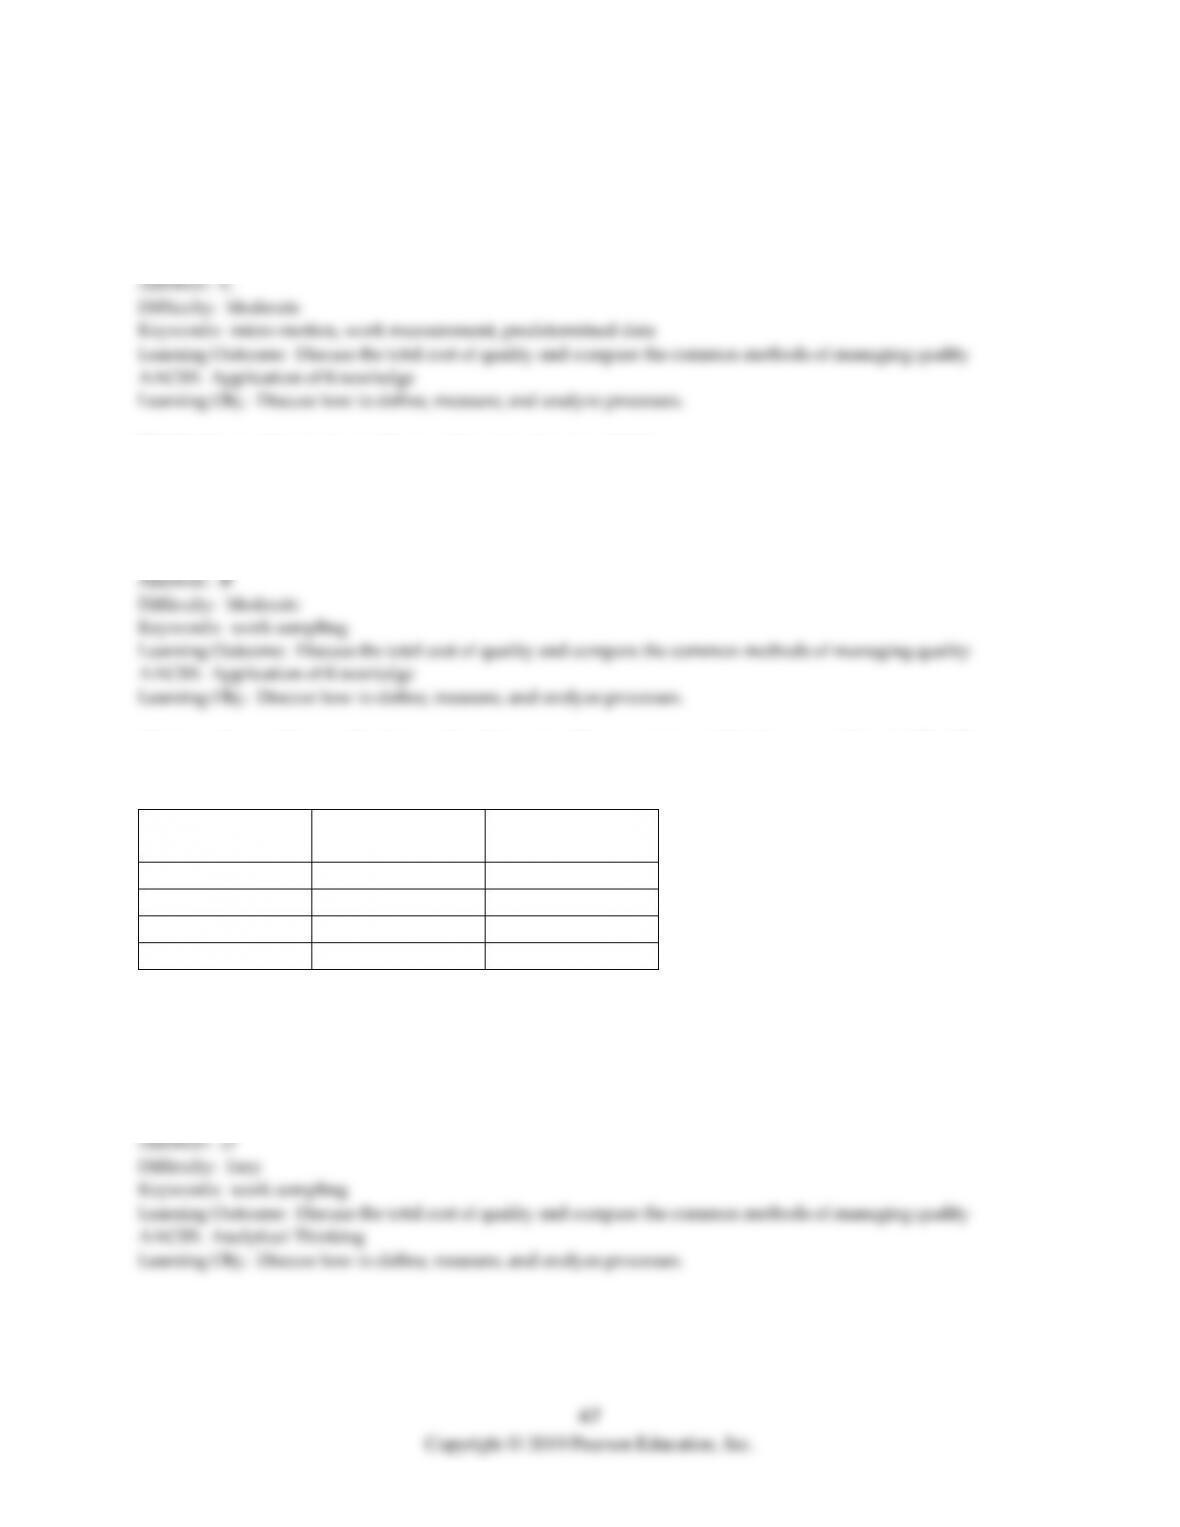
53) A work sampling method is used to determine the proportion of the time a machine is idle. The
following information was gathered on a random basis.
Day
No. Times
Machine Idle
Total No. of
Observations
Monday
4
12
Tuesday
2
8
Wednesday
4
10
Thursday
2
10
What is the proportion of idle time observed for this machine?
A) less than or equal to 5%
B) greater than 5% but less than or equal to 15%
C) greater than 15% but less than or equal to 25%
D) greater than 25%
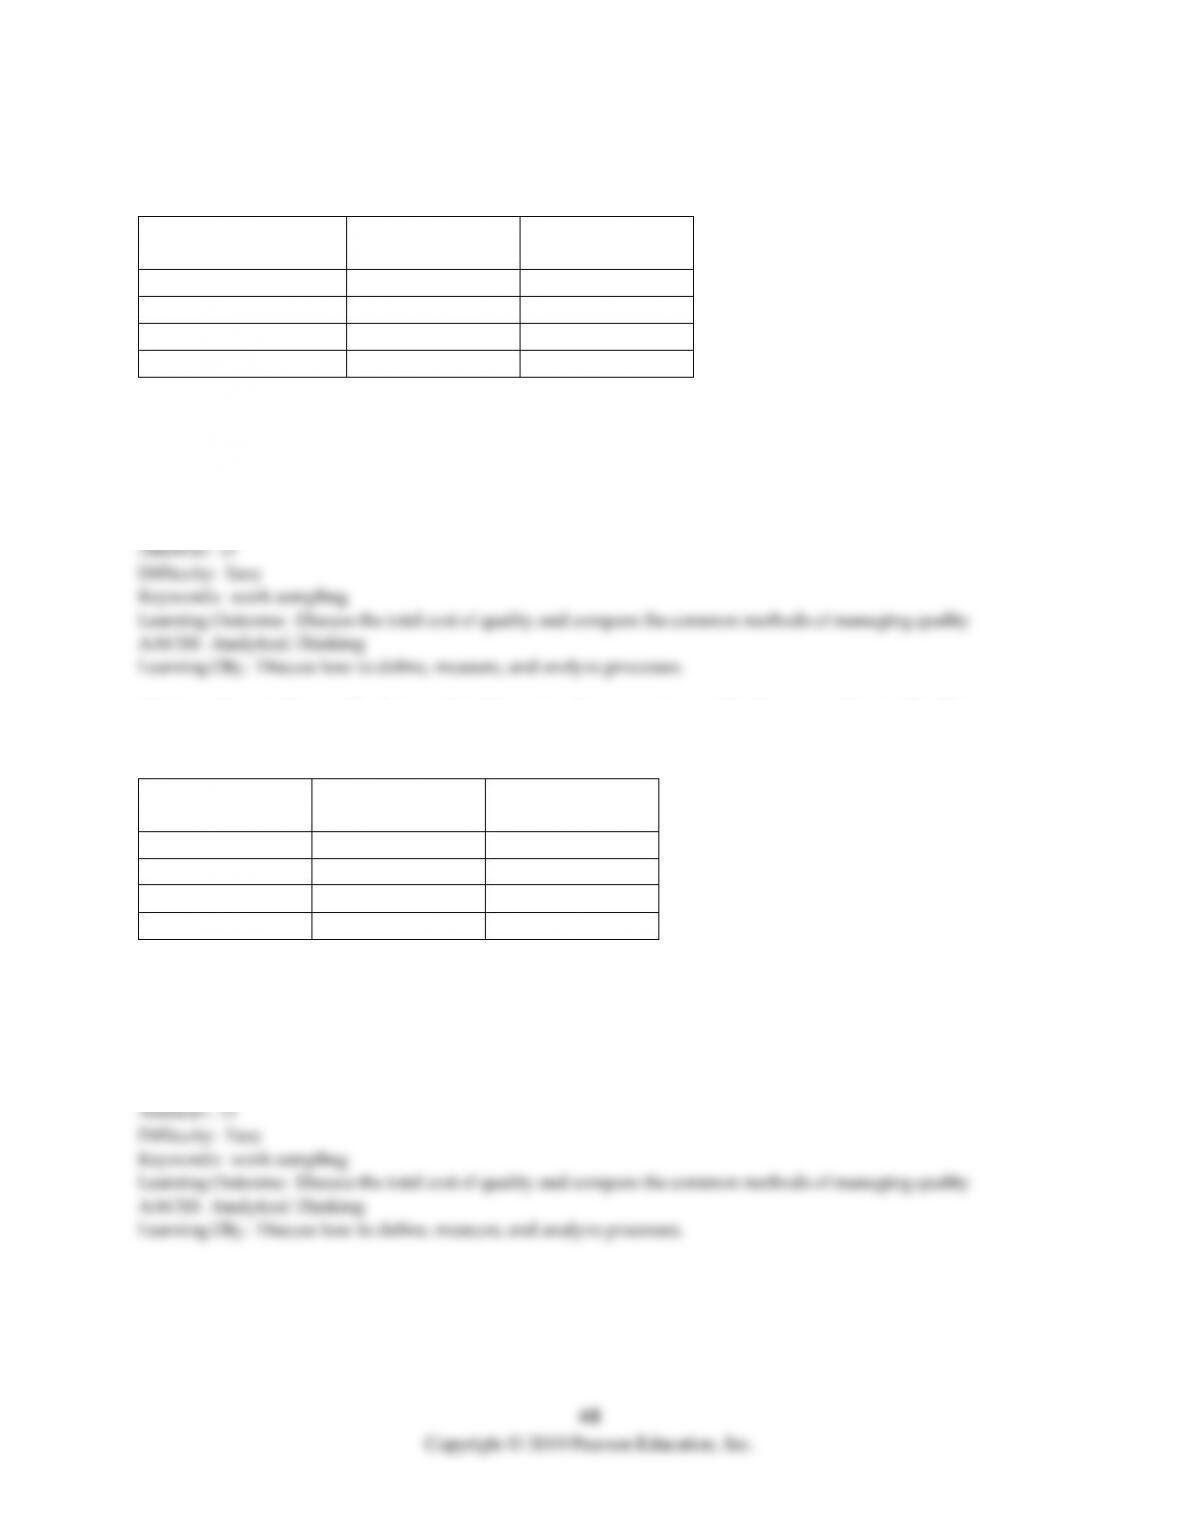
54) A work sampling method is used to determine the proportion of the time a worker is idle. The
following information was gathered on a random basis.
Time
No. of Times
Clerk Idle
Total No. of
Observations
8:00 – 10:00 am
2
6
10:00 am – 12:00 pm
3
8
1:00 – 3:00 pm
2
7
3:00 – 5:00 pm
1
9
What is the proportion of idle time observed for this worker?
A) less than or equal to 5%
B) greater than 5% but less than or equal to 10%
C) greater than 10% but less than or equal to 20%
D) greater than 20%
55) A work sampling method is used to determine the proportion of the time a worker is idle. The
following information was gathered on a random basis.
Day
No. of Times
Clerk Idle
Total No. of
Observations
Monday
8
26
Tuesday
8
32
Wednesday
7
28
Thursday
7
34
What is the proportion of idle time observed for this worker?
A) less than or equal to 5%
B) greater than 5% but less than or equal to 10%
C) greater than 10% but less than or equal to 20%
D) greater than 20%
56) The first unit of production takes 12 hours to produce and the learning rate is expected to be 80
percent. How long will it take to produce the fourth unit?
A) less than or equal to 7.0 hours
B) greater than 7.0 hours but less than or equal to 7.5 hours
C) greater than 7.5 but less than or equal to 8.0 hours
D) greater than 8.0 hours
57) The first unit of production takes 12 hours to produce and the learning rate is expected to be 80
percent. How long will it take to produce the sixth unit?
A) less than or equal to 6.0 hours
B) greater than 6.0 hours but less than or equal to 7.7 hours
C) greater than 7.7 but less than or equal to 9.5 hours
D) greater than 8.0 hours
58) The first unit of production takes 20 hours to produce and the learning rate is expected to be 90
percent. How long will it take to produce the fourth unit?
A) less than or equal to 12.0 hours
B) greater than 12.0 hours but less than or equal to 15.0 hours
C) greater than 15.0 but less than or equal to 18.0 hours
D) greater than 18.0 hours
59) The first unit of production takes 20 hours to produce and the learning rate is expected to be 90
percent. How long will it take to produce the eighth unit?
A) less than or equal to 12.0 hours
B) greater than 12.0 hours but less than or equal to 15.0 hours
C) greater than 15.0 but less than or equal to 18.0 hours
D) greater than 18.0 hours
60) The first unit of production takes 20 hours to produce and the learning rate is expected to be 90
percent. How long will it take to produce the twelfth unit?
A) less than or equal to 11.0 hours
B) greater than 11.0 hours but less than or equal to 13.0 hours
C) greater than 13.0 but less than or equal to 15.0 hours
D) greater than 15.0 hours
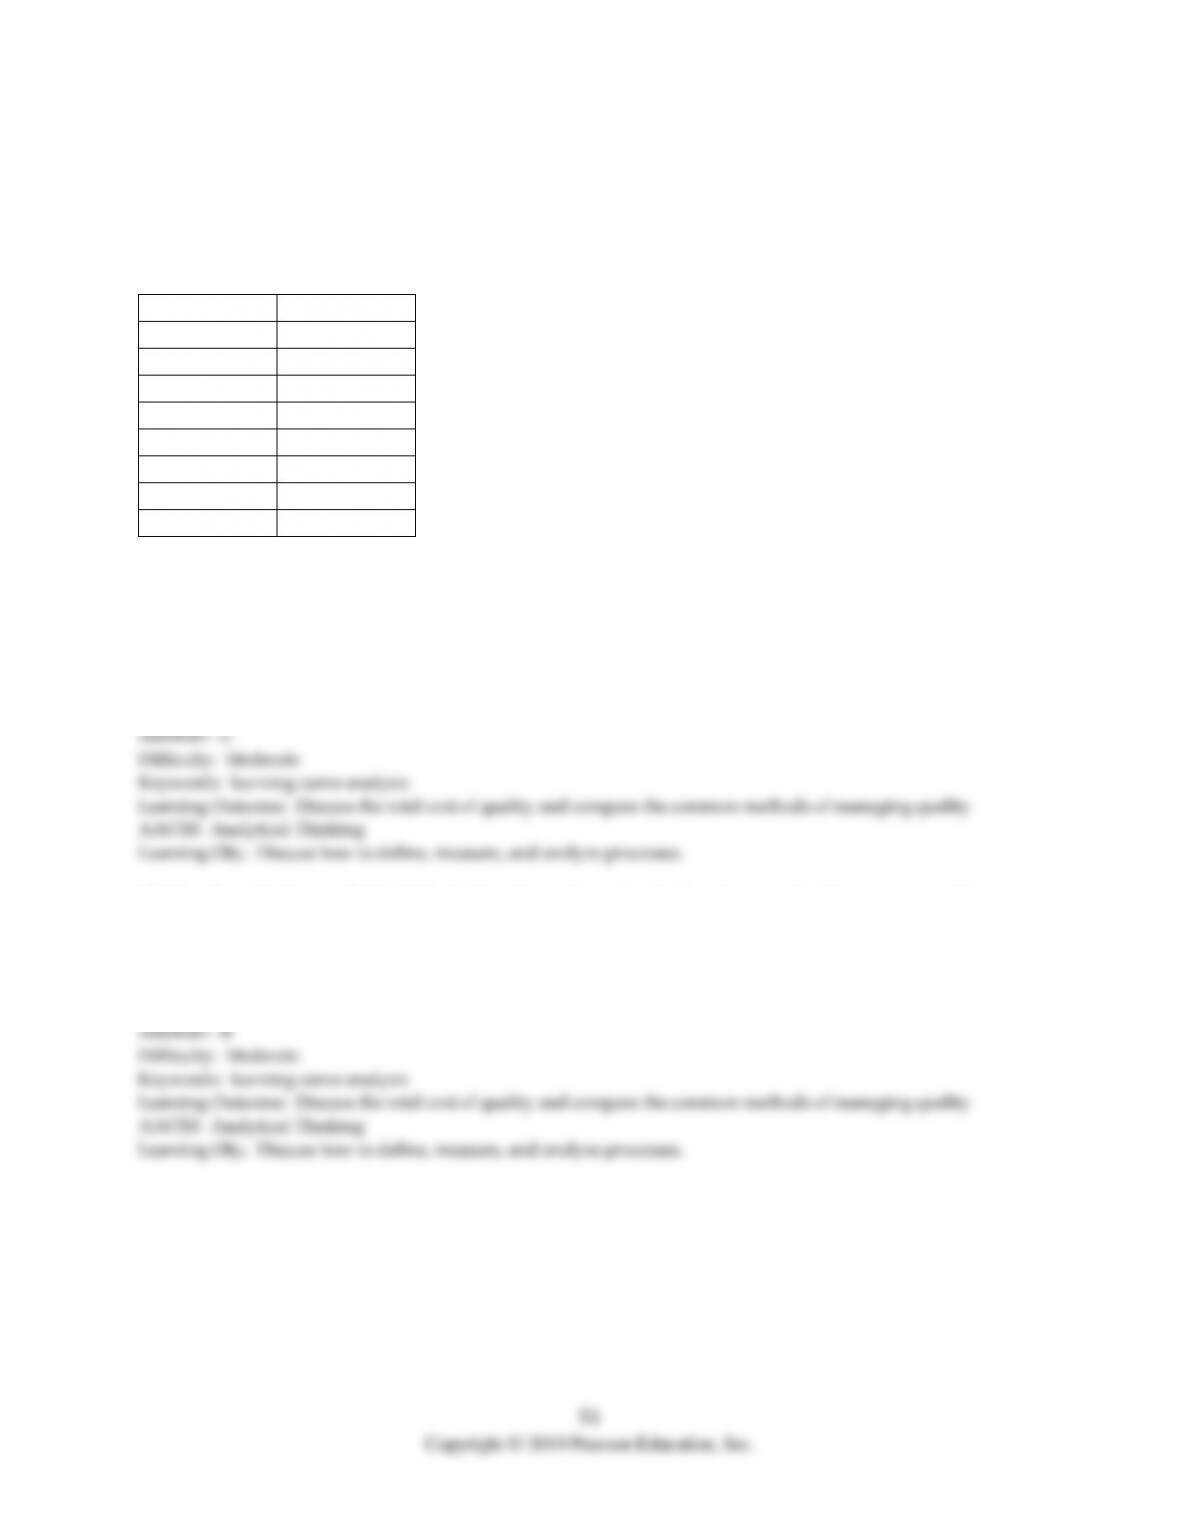
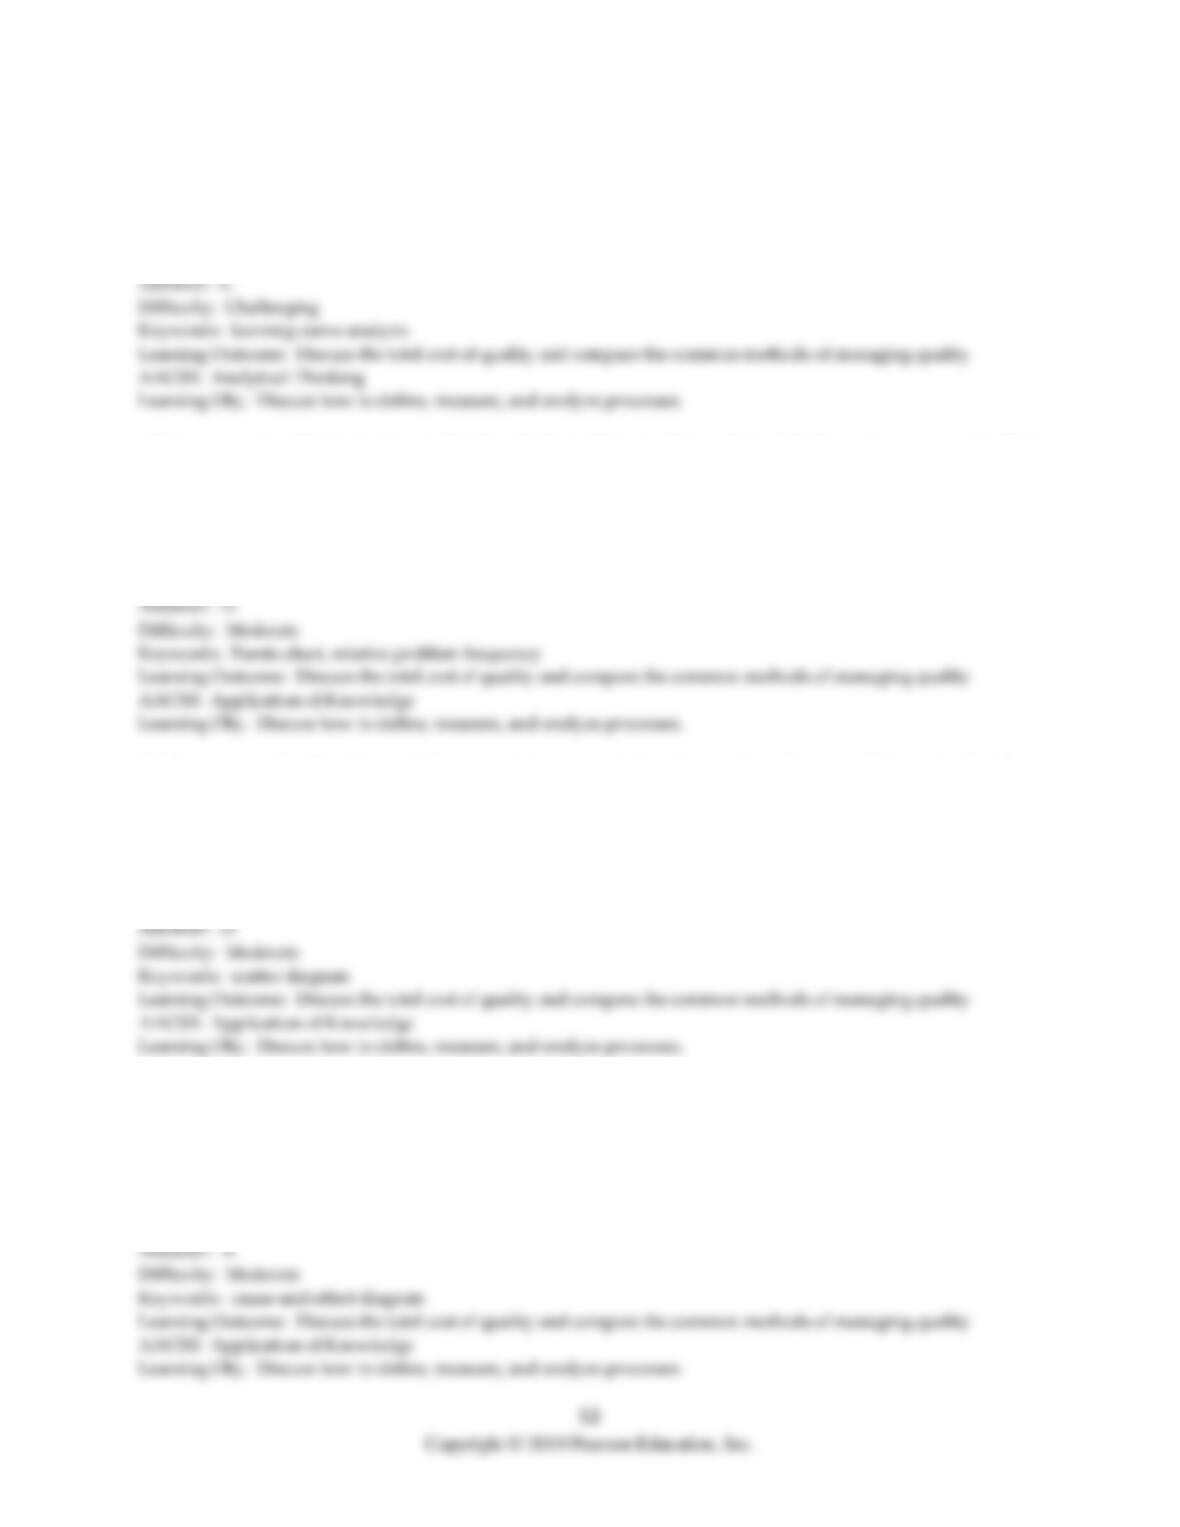
Table 2.15
An analyst notes the time that customer appointments end with a tax preparer that is assigned customers
requiring only the 1040EZ form. The times indicated in the table represent the departure times of the first
eight clients for one tax preparation specialist. The 1040EZ tax forms among the different customers are
very similar. The tax preparer started the first return at 12:00pm.
Customer #
Time
1
12:45 pm
2
1:22 pm
3
1:55 pm
4
2:26 pm
5
2:56 pm
6
3:24 pm
7
3:50 pm
8
4:15 pm
61) Which statement about Table 2.15 is best?
A) Learning effects are not present because the time between successive customer departures is not
always shorter than the preceding time.
B) Learning effects are present, but the actual percentage reduction cannot be determined.
C) Learning effects are present because in general the time between successive departures drops.
D) Learning effects are present here, but the actual percentage reduction cannot be determined.
62) Based on the data in Table 2.15 which value is closest to the learning rate for the tax preparer?
A) 80%
B) 82%
C) 87%
D) 92%
63) Based on Table 2.15, how long should it take the tax preparer to complete the 16th return of the day?
A) 16 minutes
B) 19 minutes
C) 21 minutes
D) 24 minutes
64) A process troubleshooter has to decide which problem to address first with his or her cause-and-effect
diagram. The data analysis tool that will help him decide which problem to tackle first is a:
A) scatter diagram.
B) check sheet.
C) flowchart.
D) Pareto chart.
65) A manager of a fiberglass molding operation suspects that the number of process failures is related to
the number of total units produced of a particular product. A tool most useful in this analysis would be a:
A) checklist.
B) cause-and-effect diagram.
C) Pareto chart.
D) scatter diagram.
66) Which one of the following techniques will help management trace customer complaints directly to
the process involved?
A) cause-and-effect diagram
B) quality circles
C) quality engineering
D) specification management
67) A restaurant manager tracks complaints from the diner satisfaction cards that are turned in at each
table. The data collected from the past week‘s diners appear in the following table.
Complaint
Frequency
Food taste
27
Food temperature
9
Order mistake
5
Slow service
19
Table/utensils dirty
47
Too expensive
9
Using a classic Pareto analysis, what top categories comprise 80% of the total complaints?
A) Table/utensils dirty
B) Table/utensils dirty, Food taste, Slow service
C) Food taste, Food temperature, Order mistake, Slow service, Table/utensils dirty
D) Food taste, Food temperature, Order mistake, Slow service, Too expensive
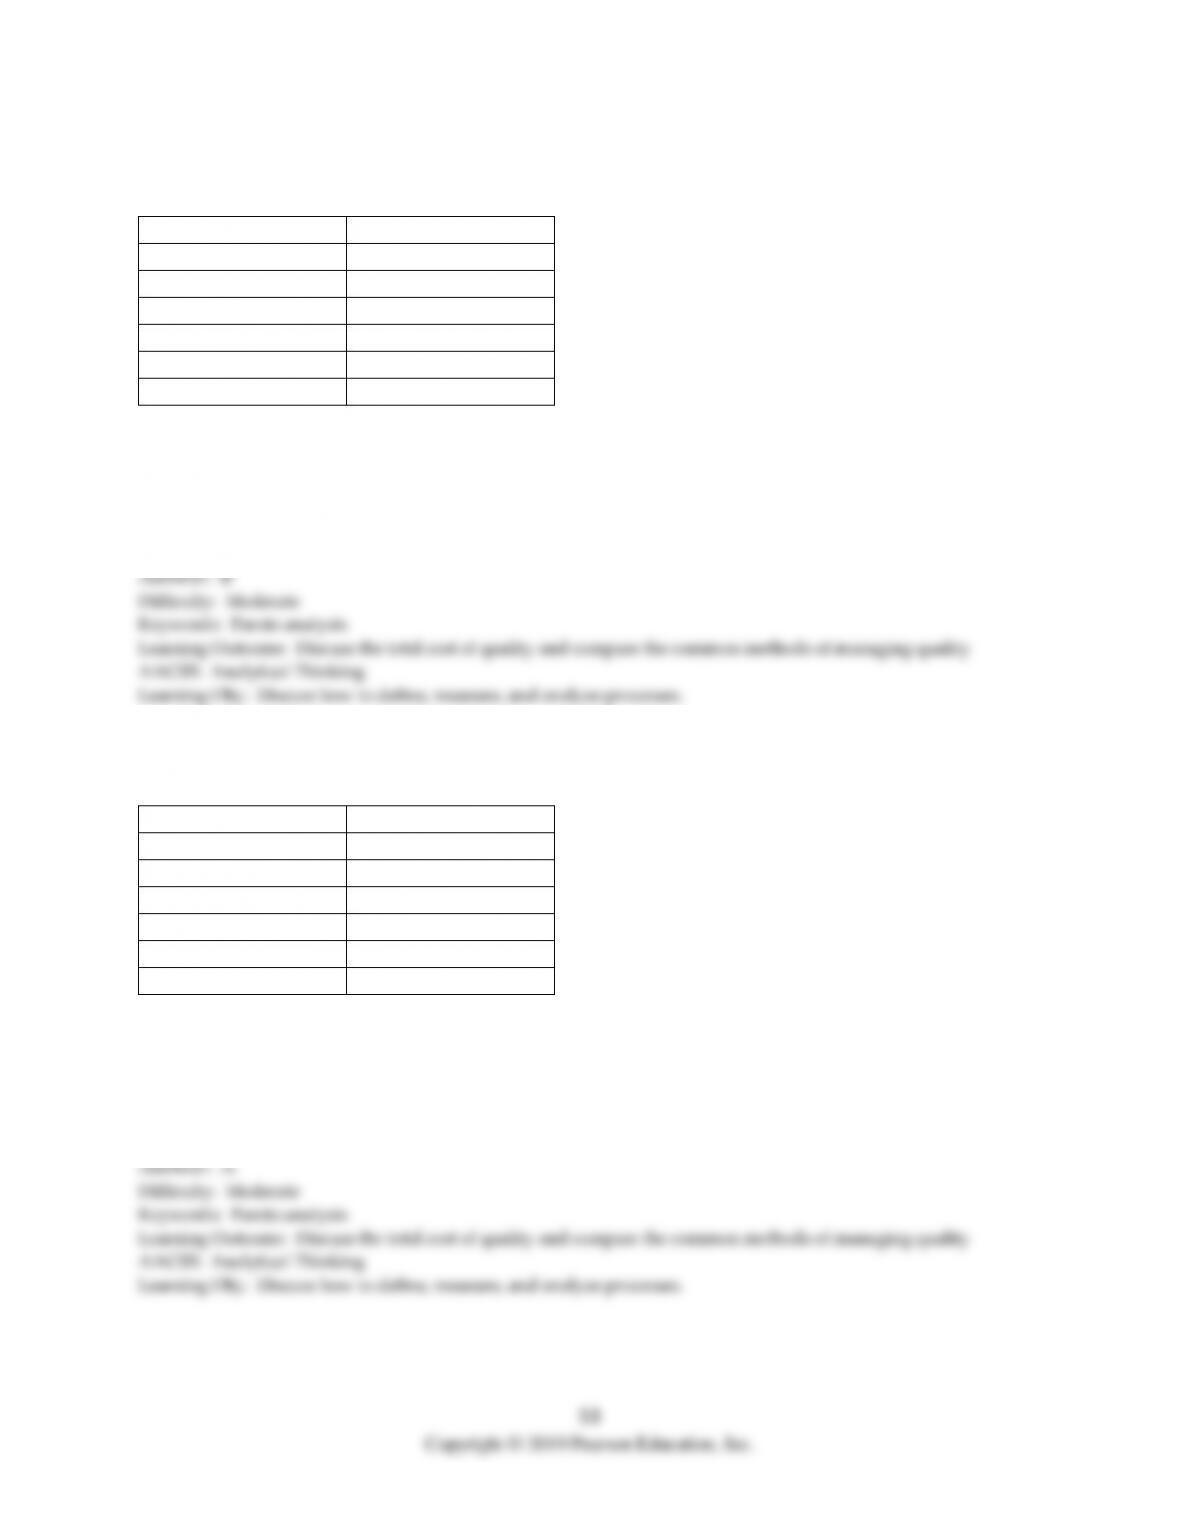
68) A restaurant manager tracks complaints from the diner satisfaction cards that are turned in at each
table. The data collected from the past week‘s diners appear in the following table.
Complaint
Frequency
Food taste
80
Food temperature
9
Order mistake
2
Slow service
16
Table/utensils dirty
47
Too expensive
4
Using a classic Pareto analysis, what bottom categories comprise about 20% of the total complaints?
A) Order mistake, Too expensive, Food temperature
B) Slow service, Order mistake
C) Food taste, Food temperature, Slow service
D) Food taste, Table/utensils dirty
69) A farmer that has been well-trained in the scientific method divides his acreage into several plots and
plants the same variety of hay in each. He varies the amount of fertilizer applied to each plot and
carefully records the yield, in bales per acre, for each of the plots. Which of these tools would be the best
to help him analyze the effect of fertilizer application on hay yield?
A) cause and effect diagram
B) scatter diagram
C) Pareto chart
D) flow chart
70) Which of the following analyses is best suited for a scatter diagram?
A) A professor plots a student’s exam score against the number of homework problems the student
completed prior to the exam.
B) A professor determines a student’s letter grade based on their final course average.
C) A professor determines the curve on the most recent exam by categorizing students into groups called
A, B, C, etc.
D) A professor studies his student evaluations and classifies complaints into broad categories such as
Assign More Homework and Make Exams More Challenging.
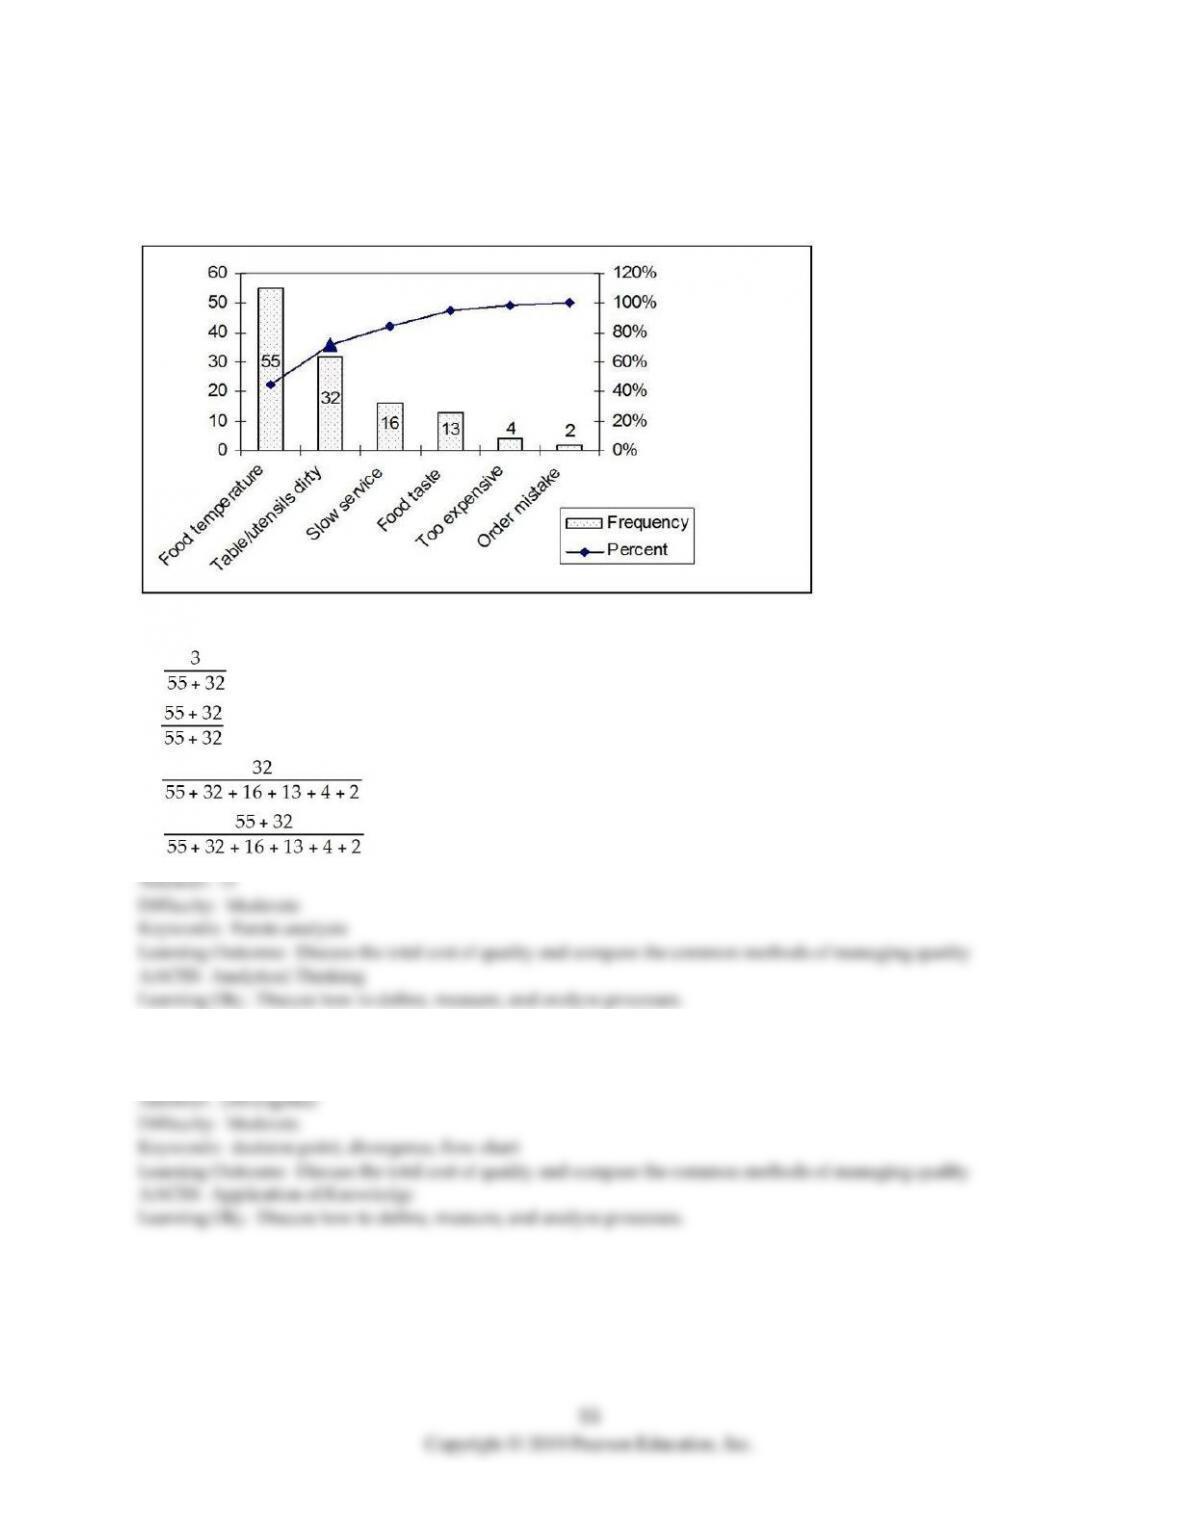
71) A restaurant manager tracks complaints from the diner satisfaction cards that are turned in at each
table. The data collected from the past week‘s diners have been plotted and appear in the following
graph. The number of complaints for each category is with each bar.
How was the value for the point represented by the triangle calculated?
A)
B)
C)
D)
72) ________ is represented in a process flow chart when an outgoing arrow from one step splits into two
or more arrows that lead to different boxes.

73) A(n) ________ shows processing steps grouped according to which company department is
responsible for performing them.
74) The ________ in a service blueprint separates which steps are in view of the customer from those that
aren’t.
75) ________ is the process of creating labor standards based on the judgment of skilled observers.
76) The time added to adjust for factors such as fatigue or equipment malfunction is called ________.
77) ________ involves estimating the proportion of time spent by people and machines on activities,
based on a large number of observations.
78) The ________ can be represented by a line called a learning curve.
79) An eighty percent learning curve means that for each doubling of output, the time required to
complete the last task is ________ percent less than before.
80) A(n) ________ is a form used to record the frequency of occurrence of certain product or service
characteristics related to quality.
81) A(n) ________ is a bar chart on which the factors are plotted in decreasing order of frequency along
the horizontal axis.
82) A(n) ________ would be a useful tool to determine the effect that the number of practice problems
solved correctly has on the midterm score.
83) A(n) ________ is a diagram that relates a key quality problem to its potential causes.
58
84) How can flowcharts and process charts be used to study and improve operations? Include
descriptions of these two tools, the types of questions that can be addressed with them, and the extent to
which teams can be used.
85) The sales team has just finished creating a process chart of the sales-call process. After fifteen minutes
of high-fiving, they decide to tape the flowchart to the conference room wall and stand back a safe
distance admiring the many symbols on the chart. You join them, and while you don’t know much about
sales calls, your expertise in process analysis and improvement is well-respected. What would you look
for in the chart that would let you know whether their sales-call process was well-conceived?
Answer: Flowcharts trace the flow of information, customers, employees, equipment, or material
through a process. At a glance, you might count the number of symbols representing transportation,
inspection, and delays, since these process steps are typically not value-adding. You might also check for
loops in the process and determine why there is a need to recirculate the information, customers,
59
86) You have been hired as an external consultant to improve processes at a business. You are unfamiliar
with exactly how the work is currently done but are intimately familiar with charting techniques and
data analysis tools. What is a general sequence for use of these tools and why should you use them in the
sequence you specify?
Answer: Because you are unfamiliar with the process, you should first use a flowchart, service blueprint,
or process chart. This diagram will give you a big-picture view of what is currently happening. Once you
are more familiar with the organization and the departmental responsibilities, it might be helpful to re-
87) Consider the four steps in a time study. If an analyst were to make a mistake, during which step
would the impact on the standard time be the greatest? Explain your reasoning.
Answer: The four steps are selecting work elements, timing the elements, determining the sample size,
and setting the standard. Answers will vary as to the step that has the greatest impact on the standard
time determination. If the work elements are not selected properly, then the analyst may include too
88) Explain why a sampling schedule is important in a work sampling study.