6) An operations manager has narrowed down the search for a new King Kola plant to three locations. Fixed
and variable costs follow.
Location
Fixed Cost
Variable Cost
A
$100,000
$10
B
$150,000
$7
C
$200,000
$5
Plot the total cost curves in the chart provided and identify the range over which each location would be best.
Then use break-even analysis to calculate exactly the break-even quantity that defines each range.
Which of the following statements is correct?
A) By inspection, it is apparent that only one site will be the best place to produce, even at dramatically
different output volumes.
B) Location A becomes the most expensive place to produce at volumes in excess of 2,000.
C) The break-even quantity between A and B is less than or equal to 5,000 units.
D) The break-even quantity between C and B is more than 20,000 units.
7) An operations manager has narrowed down the search for a new plant for McIntosh Enterprises to three
locations. Fixed and variable costs follow:
Location
Fixed Cost
Variable Cost
A
$100,000
$10
B
$150,000
$7
C
$200,000
$5
Plot the total cost curves in the chart provided and identify the range over which each location would be best.
Then use break-even analysis to calculate exactly the break-even quantity that defines each range.
Which of the following statements is correct?
A) Location C is the best one if volumes are quite low.
B) Location A becomes the most expensive place to produce at volumes less than 10,000.
C) The break-even quantity between A and B is less than or equal to 17,000 units.
D) The break-even quantity between C and B is more than 30,000 units.
8) Excel Products is planning a new warehouse to serve the Southeast. Locations A, B, and C are under
consideration. Fixed and variable costs follow.
Location
Fixed Cost per
Year
Variable Cost
per Unit
A
$2,500,000
$19
B
1,500,000
7
C
2,000,000
9
Which of the following statements is best?
A) Location A is the best one if volumes are quite high.
B) Location B is best over all volume levels.
C) The total cost of location A, if the volume is 250,000 units, is over $8,000,000.
D) The break-even quantity between A and B is more than 85,000 units but fewer than 200,000 units.
Table 13.8
An operations manager has narrowed down the search for a new plant for Tim! to three locations. Fixed and
variable costs follow.
Location
Fixed Cost
Variable Cost
A
$100,000
$10
B
$150,000
$7
C
$200,000
$5
9) Use the information in Table 13.8 to address this question. For what range of output is each location
superior?
10) Excel Products is planning a new warehouse to serve the Southeast. Locations A, B, and C are under
consideration. Fixed and variable costs follow.
Location
Fixed Cost per
Year
Variable Cost
per Unit
A
$2,500,000
$7
B
1,500,000
19
C
2,000,000
13
For what range of volume is each location the best?
1) The transportation method provides optimal solutions for minimization of shipping costs in multiple
facility location problems.
2) A dummy plant is useful for problems where the sum of the plant capacities equals the sum of the
demands.
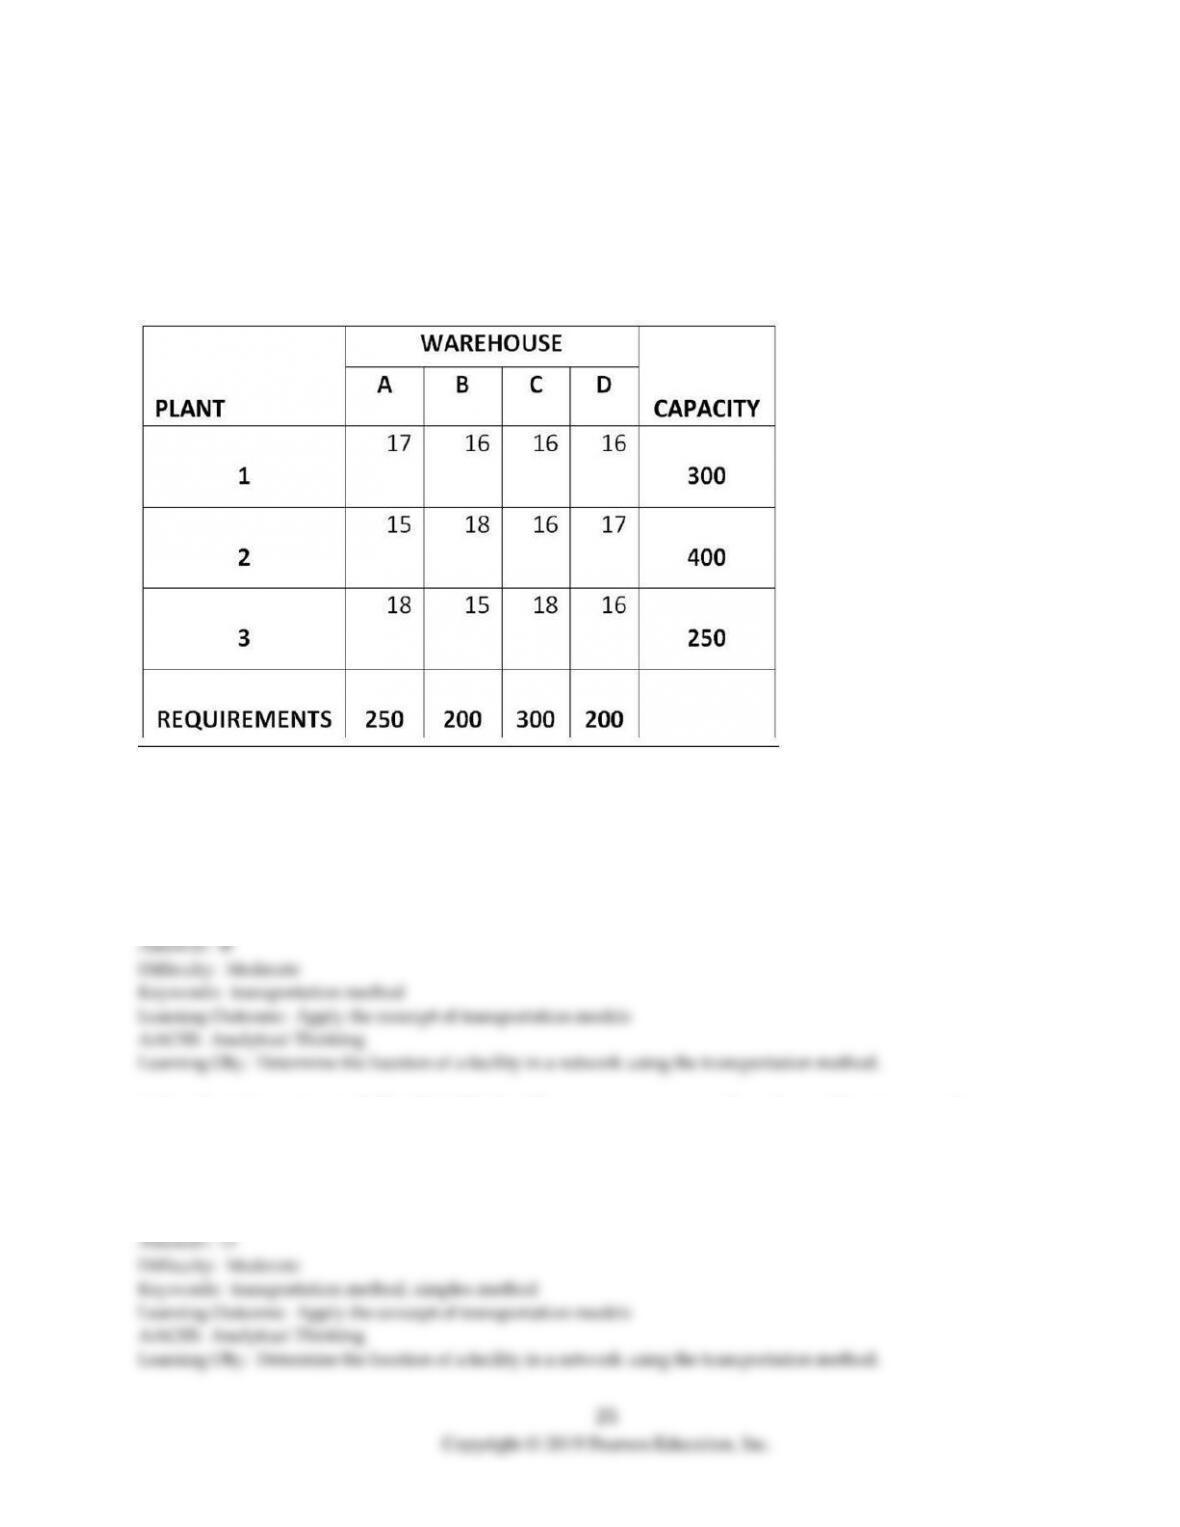
Table 13.9
Sagebrush Company has four warehouses (A, B, C, and D) that require monthly shipments of 250, 200, 300,
and 200 units per month, respectively. Its three plants (1, 2, and 3) have monthly capacities of 300, 400, and
250, respectively. Plant capacities, warehouse needs and shipping costs (in $) are shown in the following
initial transportation method tableau. For example, the shipping cost from Plant 1 to Warehouse A is $17 per
unit.
3) Use the information in Table 13.9. What can be said about a plan that ships 200 units from 1 to A, 100 units
from 1 to B, 100 units from 2 to B, 300 units from 2 to C, and 250 units from 3 to D?
A) It is not feasible in terms of plant capacities.
B) It is not feasible in terms of satisfying warehouse demands.
C) It is feasible, but not the least-cost allocation pattern.
D) It is the optimal solution.
4) Use the information in Table 13.9. Which of these statements regarding the problem is correct?
A) Another plant must be added to the tableau because there are more warehouses than plants.
B) A dummy plant must be added due to production volumes.
C) A dummy warehouse must be added to solve this problem.
D) The simplex method can be used to solve this problem.
5) Use the information in Table 13.9. What is the cost of a plan that ships 150 units from 1 to C, 150 units from
1 to D, 250 units from 2 to A, 150 units from 2 to C, 200 units from 3 to B, and 50 units from 3 to D?
A) less than $15,000
B) more than $15,000 but less than $16,000
C) more than $16,000 but less than $17,000
D) more than $17,000
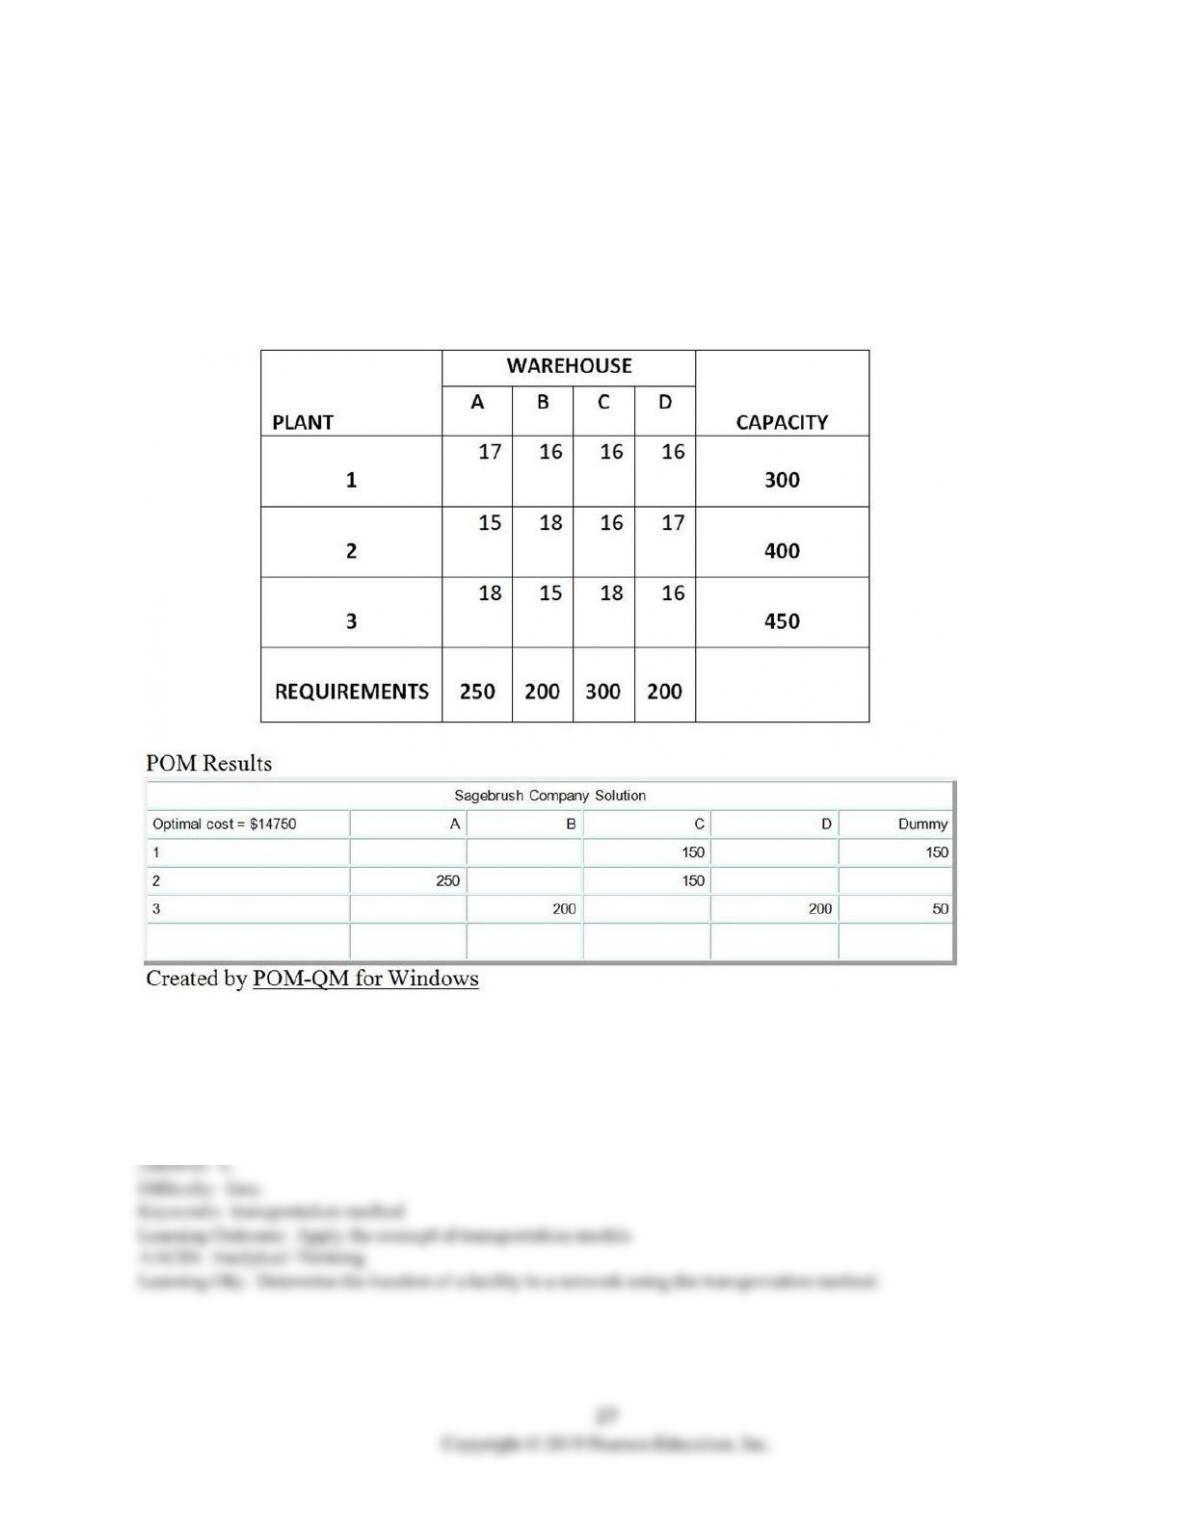
Table 13.10
Sagebrush Company has four warehouses (A, B, C, and D) that require monthly shipments of 250, 200, 300,
and 200 units per month, respectively. Its three plants (1, 2, and 3) have monthly capacities of 300, 400, and
450, respectively. Plant capacities, warehouse needs and shipping costs (in $) are shown in the following
initial transportation method tableau. For example, the shipping cost from Plant 1 to Warehouse A is $17 per
unit. A second table showing POM for Windows results from running this transportation problem is shown
below the tableau.
6) Use the information in Table 13.10. The low cost solution indicates a total cost of:
A) $1,150.
B) $950.
C) $14,750.
D) The low cost solution is not provided in Table 13.10.
7) Use the information in Table 13.10. Which of the following statements is false?
A) The plants have 200 more units of capacity than the warehouses need.
B) All of the four warehouses’ needs are satisfied by the solution shown.
C) Total production by the three plants is 950 units.
D) The total production from plant #3 is 450 units.
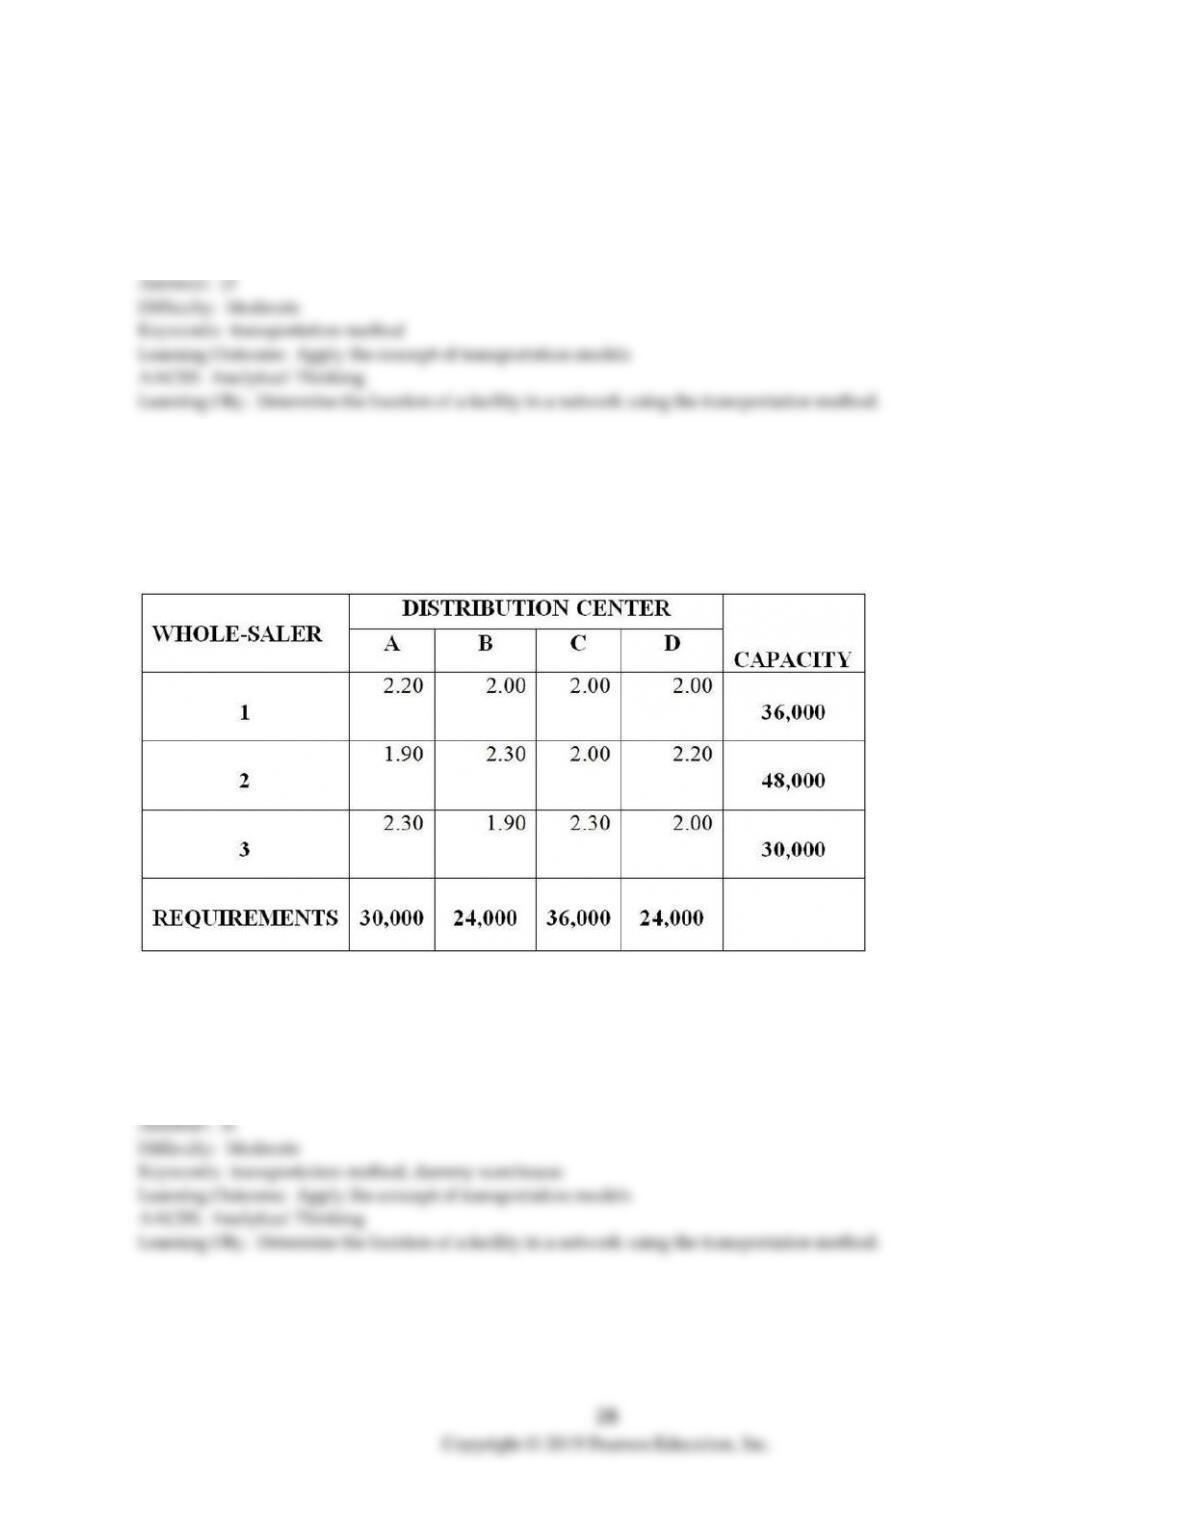
Table 13.11
The Neale Company has four distribution centers (A, B, C, and D) that require monthly shipments of 30,000,
24,000, 36,000, and 24,000 gallons of diesel fuel per month, respectively. Three wholesalers (1, 2, and 3) are
willing to supply up to 36,000, 48,000 and 30,000 gallons, respectively. Total costs (in $) for both shipping and
price per gallon follow. A transportation method tableau is provided below.
8) Use the information in Table 13.11. Which of the following statements about this scenario is not correct?
A) A dummy warehouse is required to complete the analysis.
B) It costs $2 per gallon to ship from Wholesaler 3 to Distribution Center D.
C) It costs $2 per gallon to ship one gallon from Wholesaler 2 to Distribution Center C.
D) It costs $2 per gallon to ship 20,000 gallons from Wholesaler 1 to Distribution Center D.
9) Use the information in Table 13.11. What can be said about a plan that ships 18,000 gallons from 1 to C;
18,000 gallons from 1 to D; 30,000 gallons from 2 to A; 18,000 gallons from 2 to C; 24,000 gallons from 3 to B;
and 30,000 from 3 to D?
A) It is not feasible in terms of wholesaler availabilities.
B) It is not feasible in terms of satisfying distribution center demands.
C) It is feasible, and the total monthly cost is less than $223,000.
D) It is feasible, and the total monthly cost is greater than $227,000.
10) Use the information in Table 13.11. What can be said about a plan that ships 30,000 gallons from 1 to A;
6,000 gallons from 1 to C; 24,000 gallons from 2 to B; 24,000 gallons from 2 to D; and 30,000 gallons from 3 to
C?
A) It is not feasible in terms of wholesaler availabilities.
B) It is not feasible in terms of satisfying distribution center demands.
C) It is feasible, and the total monthly cost is less than or equal to $260,000.
D) It is feasible, and the total monthly cost is greater than $260,000.
11) Which of the following is not a step in setting up a transportation tableau?
A) Create a row for each plant being considered.
B) Remove the lowest and highest cost intersections from consideration.
C) Create a column for each warehouse being considered.
D) Add a column and a row for plant capacities and total demands.
12) Which of the following invalidates any analysis using the transportation method?
A) unequal supply and demand amounts
B) more sources than destinations
C) more destinations than sources
D) A non-linear increase in shipping costs
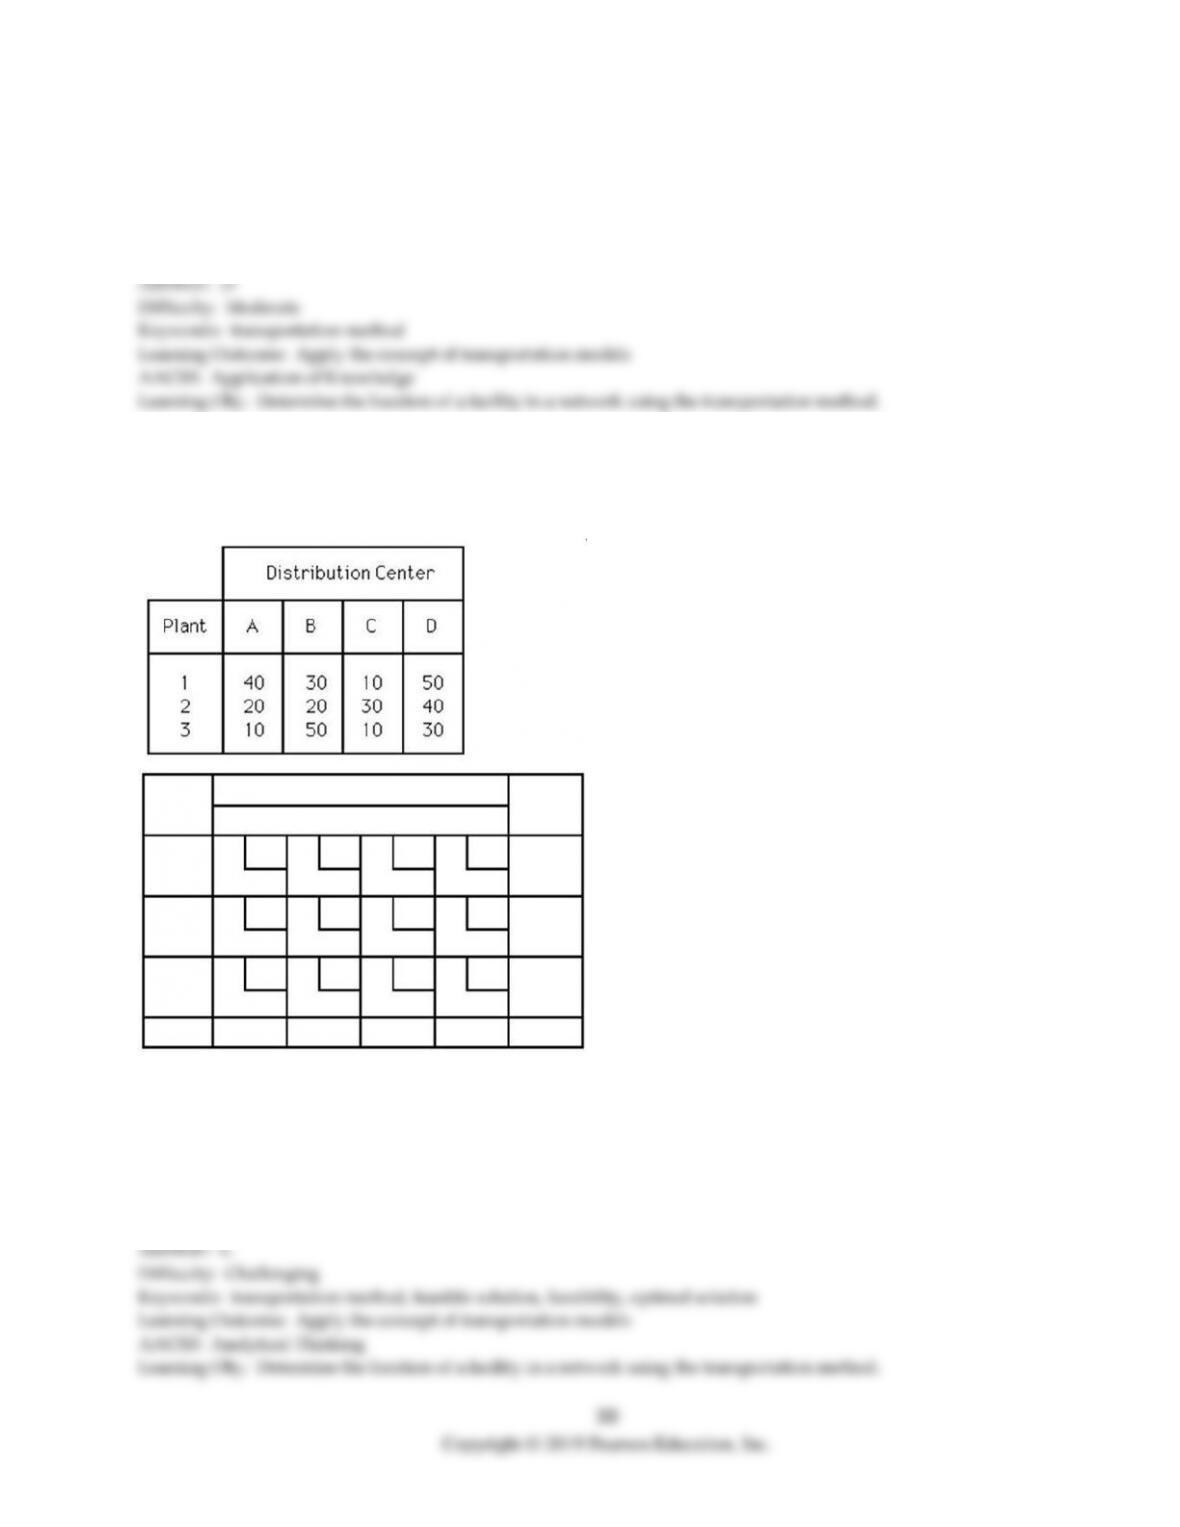
13) The Nelson Company has four distribution centers (A, B, C, and D) that require shipments of 20, 30, 40,
and 10 units per week, respectively. Its three plants (1, 2, and 3) have monthly capacities of 40, 30, and 30,
respectively. Shipping costs (in $) follow.
What can be said about a plant that ships 40 units from 1 to C, 30 units from 2 to B, 20 units from 3 to A, and
10 units from 3 to D?
A) It is not feasible in terms of plant capacities.
B) It is not feasible in terms of satisfying distribution center demands.
C) It is feasible, and the weekly shipping cost is less than $1,600.
D) It is feasible, and the weekly shipping cost is greater than $2,000.
14) The transportation method of production planning is a special case of:
A) linear programming.
B) integer programming.
C) queuing theory.
D) goal programming.
15) If the total supply does not equal the total number of units demanded, then the modeler should use a(n)
________ warehouse as part of the transportation method.
16) Costs that are represented in each cell of a transportation tableau are based on ________.
17) Each cell in the interior of a transportation tableau not in the requirements row or capacity column is a(n)
________.
18) A(n) ________ is a standard matrix that is used to solve location problems using the transportation
method.
19) What is a dummy plant or warehouse and when is it needed?
20) The transportation method is customarily used to minimize transportation costs between sources of
supply and sinks of demand. How could this model be used in other areas of operations management to
maximize profit? Provide examples.
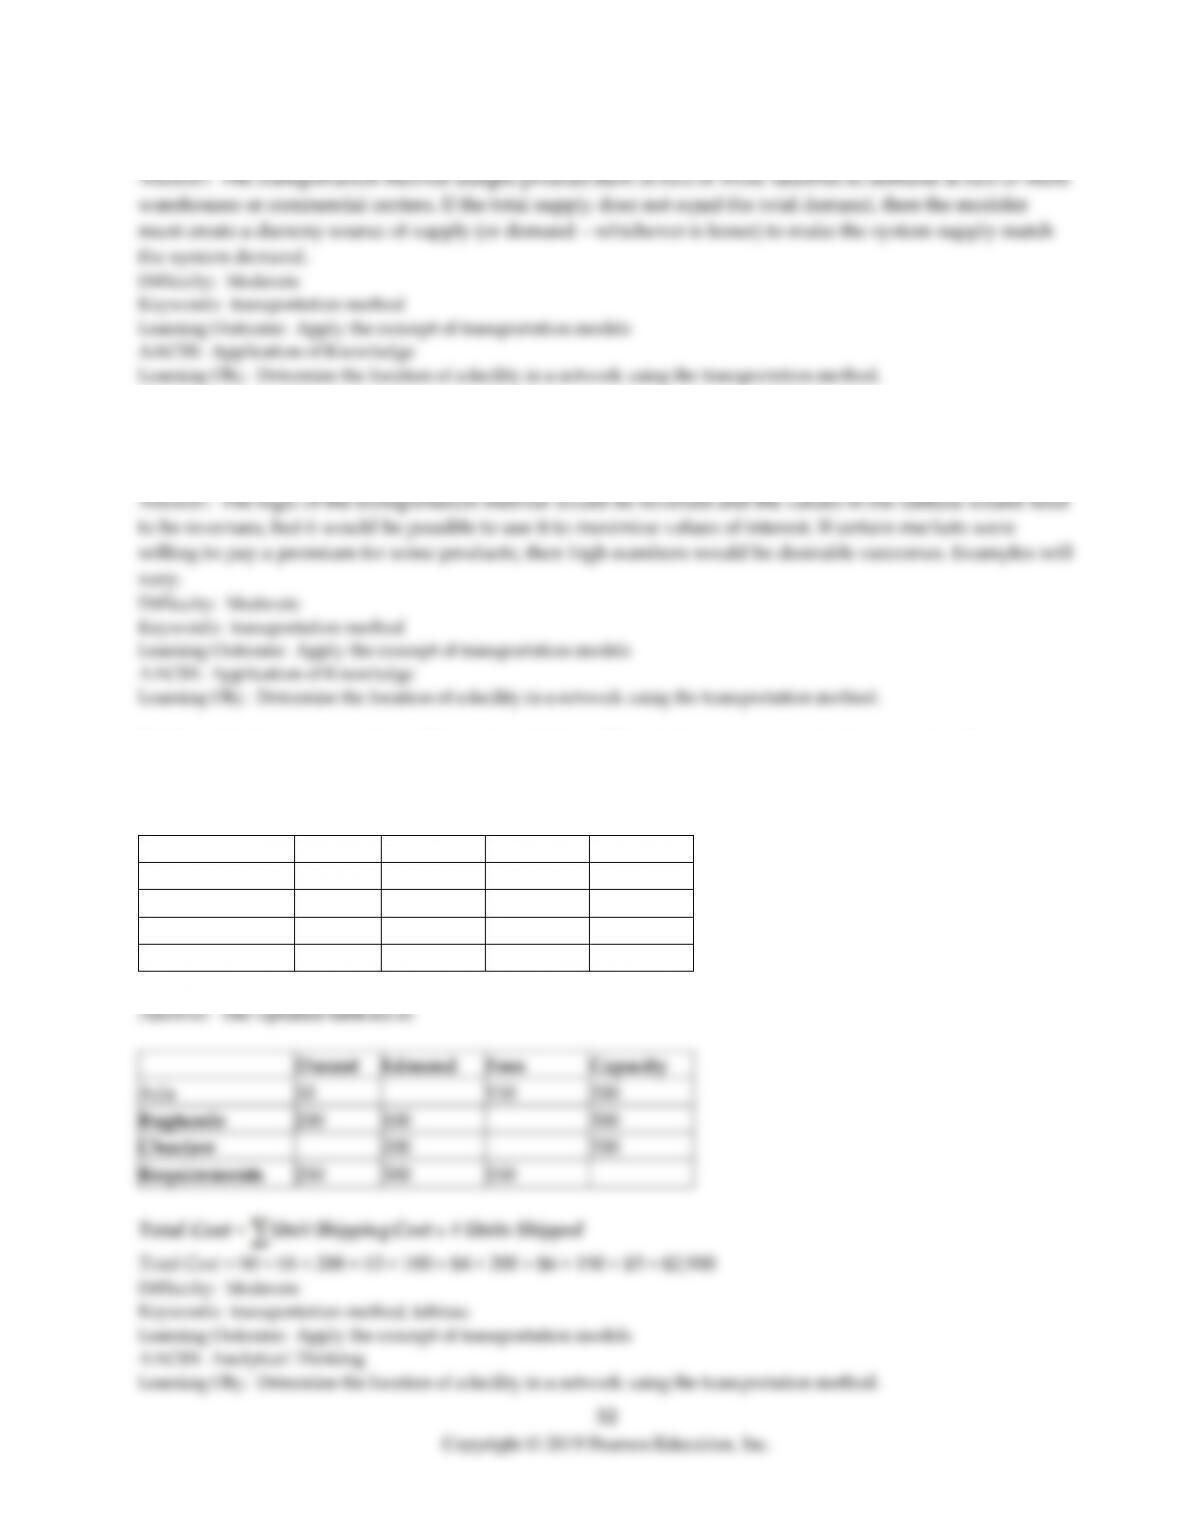
21) Consider the transportation tableau shown below. What is the minimum cost of transporting the
production from Ada, Bugtussle, and Choctaw to Durant, Edmond, and Foss if costs per unit are shown at the
intersections of each location?
Durant
Edmond
Foss
Capacity
Ada
5
7
3
200
Bugtussle
3
4
4
300
Choctaw
8
6
8
200
Requirements
250
300
150
Durant
Edmond
Foss
Capacity
Ada
50
150
200
Bugtussle
200
100
300
Choctaw
200
200
Requirements
250
300
150
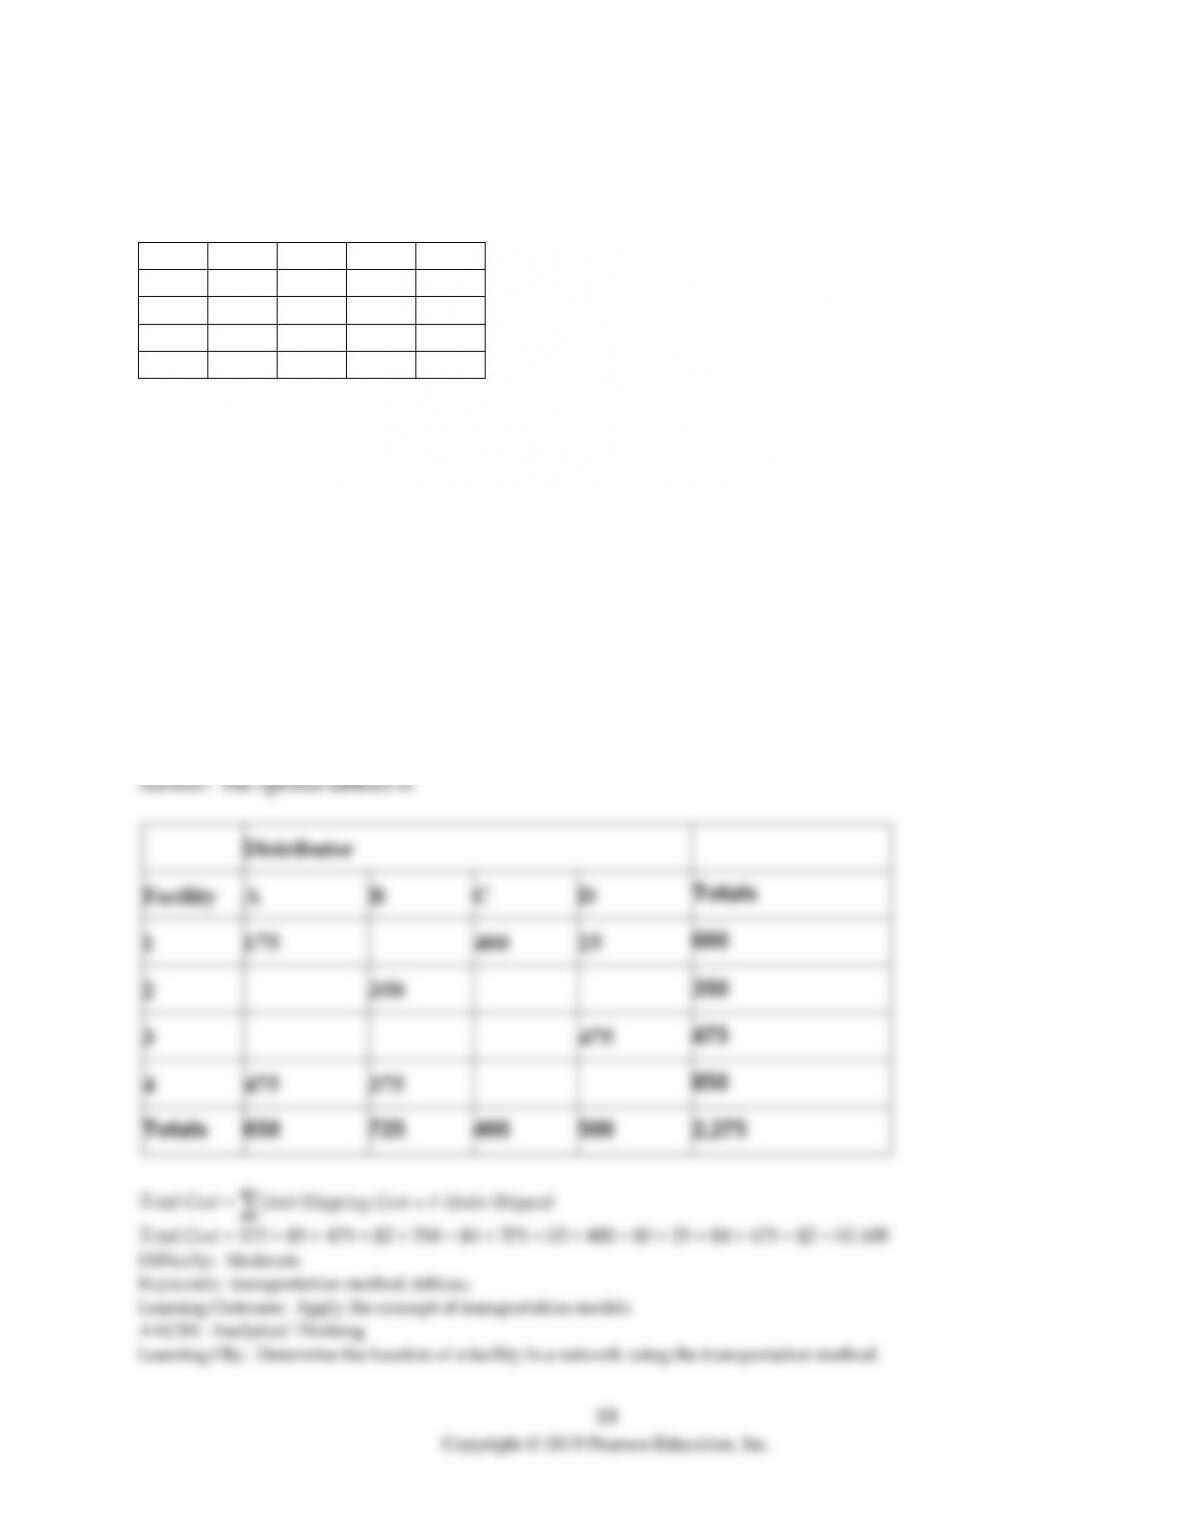
22) A national firm has beef jerky processing facilities in Locations 1, 2, 3, and 4. They ship to central
distributors (represented as A, B, C, and D) handling four regions of the country. The per-unit shipping costs
between each possible combination of locations are shown in the following table.
A
B
C
D
1
$5
$10
$5
$4
2
$3
$4
$4
$3
3
$8
$6
$8
$2
4
$2
$3
$5
$9
The processing facility locations are capable of monthly production (in tons) as follows:
Location 1: 600
Location 2: 350
Location 3: 475
Location 4: 850
The central distributors have firm commitments for the following quantities:
Distributor A: 650
Distributor B: 725
Distributor C: 400
Distributor D: 500
What is the lowest-cost shipping arrangement that can be made between the plant locations and distributors
and what is the annual shipping cost?