Supply Chain Management: Strategy, Planning, and Operation, 7e (Chopra)
Chapter 7 Demand Forecasting in a Supply Chain
7.1 True/False Questions
1) The forecast of demand forms the basis for all strategic and planning decisions in a supply
chain.
2) Most firms that employ forecasting do not maintain any estimates of forecast error.
3) Long-term forecasts have a larger standard deviation of error relative to the mean than short-
term forecasts.
4) For pull processes, a manager must forecast what customer demand will be in order to plan the
level of available capacity and inventory.
5) The result when each stage in the supply chain makes its own separate forecast is often a
match between supply and demand because these forecasts are often very different.
6) Leaders in many supply chains have started moving toward collaborative forecasting to
improve their ability to match supply and demand.
7) Mature products with stable demand are usually the most difficult to forecast.
8) Forecasting and the accompanying managerial decisions are extremely difficult when either
the supply of raw materials or the demand for the finished product is highly variable.
9) Forecasts should include both the expected value of the forecast and a measure of forecast
error.
10) Aggregate forecasts are usually more accurate than disaggregate forecasts, as they tend to
have a smaller standard deviation of error relative to the mean.
11) Collaborative forecasting based on sales to the end customer can help enterprises further up
the supply chain reduce forecast error.
12) Qualitative forecasting methods are most appropriate when there is good historical data
available or when experts do not have market intelligence that is critical in making the forecast.
13) Time series forecasting methods are the most difficult methods to implement.
14) Causal forecasting methods find a correlation between demand and environmental factors
and use estimates of what environmental factors will be to forecast future demand.
15) The forecast error measures the difference between the forecast and the estimate.
16) The goal of any forecasting method is to predict the systematic component of demand and
estimate the random component.
17) A static time-series method should be used when the estimates for level, seasonality and
trend may be based solely on historical data.
18) In adaptive forecasting, the estimates of level, trend, and seasonality are updated after each
demand observation.
19) The moving average forecast method is used when demand has an observable trend or
seasonality.
20) Excel’s Solver function should be used to minimize the forecast errors in a model.
21) The =MAPE(array1,array2) function in Excel can calculate the mean absolute percent error
of any two data arrays of the same size.
7.2 Multiple Choice Questions
1) The basis for all strategic and planning decisions in a supply chain comes from
A) the forecast of demand.
B) sales targets.
C) profitability projections.
D) production efficiency goals.
2) For push processes, a manager must forecast what customer demand will be in order to
A) plan the service level.
B) plan the level of available capacity and inventory.
C) plan the level of productivity.
D) plan the level of production.
3) The result of each stage in the supply chain making its own separate forecast is
A) an accurate forecast.
B) a more accurate forecast.
C) a match between supply and demand.
D) a mismatch between supply and demand.
4) When all stages of a supply chain produce a collaborative forecast, it tends to be
A) much more detailed.
B) much more complex.
C) much more accurate.
D) much more flexible.
5) The resulting accuracy of a collaborative forecast enables supply chains to be
A) more responsive but less efficient in serving their customers.
B) both more responsive and more efficient in serving their customers.
C) less responsive but less efficient in serving their customers.
D) both less responsive and less efficient in serving their customers.
6) Leaders in many supply chains have started moving
A) toward independent forecasting to improve their ability to match supply and demand.
B) toward consecutive forecasting to improve their ability to match supply and demand.
C) toward sequential forecasting to improve their ability to match supply and demand.
D) toward collaborative forecasting to improve their ability to match supply and demand.
7) Production can utilize forecasts to make decisions concerning
A) scheduling.
B) sales-force allocation.
C) promotions.
D) hiring decisions.
8) Personnel can utilize forecasts to make decisions concerning
A) scheduling.
B) promotions.
C) plant/equipment investment.
D) purchasing.

9) Mature products with stable demand
A) are usually easiest to forecast.
B) are usually hardest to forecast.
C) cannot be forecast.
D) do not need to be forecast.
10) When either the supply of raw materials or the demand for the finished product is highly
variable, forecasting and the accompanying managerial decisions
A) are extremely simple.
B) are relatively straightforward.
C) are extremely difficult.
D) should not be attempted.
11) One of the characteristics of forecasts is
A) aggregate forecasts are usually less accurate than disaggregate forecasts.
B) disaggregate forecasts are usually more accurate than aggregate forecasts.
C) short-term forecasts are usually less accurate than long-term forecasts.
D) long-term forecasts are usually less accurate than short-term forecasts.
12) One of the characteristics of forecasts is
A) aggregate forecasts are usually more accurate than disaggregate forecasts.
B) disaggregate forecasts are usually more accurate than aggregate forecasts.
C) short-term forecasts are usually less accurate than long-term forecasts.
D) long-term forecasts are usually more accurate than short-term forecasts.
13) Forecasts are always wrong and therefore
A) should include both the expected value of the forecast and a measure of forecast error.
B) should not include both the expected value of the forecast and a measure of forecast error.
C) should only be used when there are no accurate estimates.
D) should be missing the expected value of the forecast and a measure of forecast error.
14) Long-term forecasts are usually less accurate than short-term forecasts because
A) short-term forecasts have a larger standard deviation of error relative to the mean than long-
term forecasts.
B) short-term forecasts have more standard deviation of error relative to the mean than long-term
forecasts.
C) long-term forecasts have a smaller standard deviation of error relative to the mean than short-
term forecasts.
D) long-term forecasts have a larger standard deviation of error relative to the mean than short-
term forecasts.
15) Aggregate forecasts are usually more accurate than disaggregate forecasts because
A) aggregate forecasts tend to have a larger standard deviation of error relative to the mean.
B) aggregate forecasts tend to have a smaller standard deviation of error relative to the mean.
C) disaggregate forecasts tend to have a smaller standard deviation of error relative to the mean.
D) disaggregate forecasts tend to have less standard deviation of error relative to the mean.

16) In general, the further up the supply chain a company is (or the further they are from the
consumer),
A) the greater the distortion of information they receive.
B) the smaller the distortion of information they receive.
C) the more accurate the information they receive.
D) the more useful the information they receive.
17) Forecasting methods that use historical demand to make a forecast are known as
A) qualitative forecasting methods.
B) time series forecasting methods.
C) causal forecasting methods.
D) simulation forecasting methods.
18) Forecasting methods that assume that the demand forecast is highly correlated with certain
factors in the environment (e.g., the state of the economy, interest rates, etc.) to make a forecast
are known as
A) qualitative forecasting methods.
B) time series forecasting methods.
C) causal forecasting methods.
D) simulation forecasting methods.

19) Forecasting methods that imitate the consumer choices that give rise to demand to arrive at a
forecast are known as
A) qualitative forecasting methods.
B) time series forecasting methods.
C) causal forecasting methods.
D) simulation forecasting methods.
20) Qualitative forecasting methods are most appropriate when
A) there is good historical data available.
B) there is little historical data available.
C) experts do not have critical market intelligence.
D) forecasting demand into the near future.
21) Which forecasting methods are the simplest to implement and can serve as a good starting
point for a demand forecast?
A) Qualitative forecasting methods
B) Time series forecasting methods
C) Causal forecasting methods
D) Simulation forecasting methods

22) The goal of any forecasting method is to
A) predict the random component of demand and estimate the systematic component.
B) predict the systematic component of demand and estimate the random component.
C) predict the seasonal component of demand and estimate the random component.
D) predict the random component of demand and estimate the seasonal component.
23) ________ forecasting methods assume that the demand forecast is highly correlated with
certain factors in the environment (the state of the economy, interest rates, etc.).
A) Qualitative
B) Time-series
C) Causal
D) Simulation
24) ________ forecasting methods are primarily subjective and rely on human judgment.
A) Qualitative
B) Time-series
C) Causal
D) Simulation
25) ________ forecasting methods use historical demand to make a forecast.
A) Qualitative
B) Time-series
C) Causal
D) Simulation
26) The multiplicative form of the systematic component of demand is shown as
A) level × trend × seasonal factor.
B) level + trend + seasonal factor.
C) (level + trend) × seasonal factor.
D) level × (trend + seasonal factor).
27) The additive form of the systematic component of demand is shown as
A) level × trend × seasonal factor.
B) level + trend + seasonal factor.
C) (level + trend) × seasonal factor.
D) level × (trend + seasonal factor).
28) The mixed form of the systematic component of demand is shown as
A) level × trend × seasonal factor.
B) level + trend + seasonal factor.
C) (level + trend) × seasonal factor.
D) level × (trend + seasonal factor).
29) A static method of forecasting
A) assumes that the estimates of level, trend, and seasonality within the systematic component do
not vary as new demand is observed.
B) assumes that the estimates of level, trend, and seasonality within the systematic component
vary as new demand is observed.
C) the estimates of level, trend, and seasonality are updated after each demand observation.
D) All of the above are true.
30) In adaptive forecasting,
A) there is an assumption that the estimates of level, trend, and seasonality within the systematic
component do not vary as new demand is observed.
B) the estimates of level, trend, and seasonality within the systematic component are not adjusted
as new demand is observed.
C) the estimates of level, trend, and seasonality are updated after each demand observation.
D) All of the above are true.
31) What does deseasonalizing a data set accomplish?
A) It removes the wavelike pattern from the data.
B) It removes all point-to-point variation from the data.
C) It removes all change in level from the data.
D) It removes the progression from one point to another from the data.
32) The moving average forecast method is used when
A) demand has observable trend or seasonality.
B) demand has no observable trend or seasonality.
C) demand has observable trend and seasonality.
D) demand has no observable level or seasonality.
33) The simple exponential smoothing forecast method is appropriate when
A) demand has observable trend or seasonality.
B) demand has no observable trend or seasonality.
C) demand has observable trend and seasonality.
D) demand has no observable level or seasonality.
34) The trend corrected exponential smoothing (Holt’s Model) forecast method is appropriate
when
A) demand has observable trend or seasonality.
B) demand has no observable trend or seasonality.
C) demand has observable trend but no seasonality.
D) demand has no observable level or seasonality.
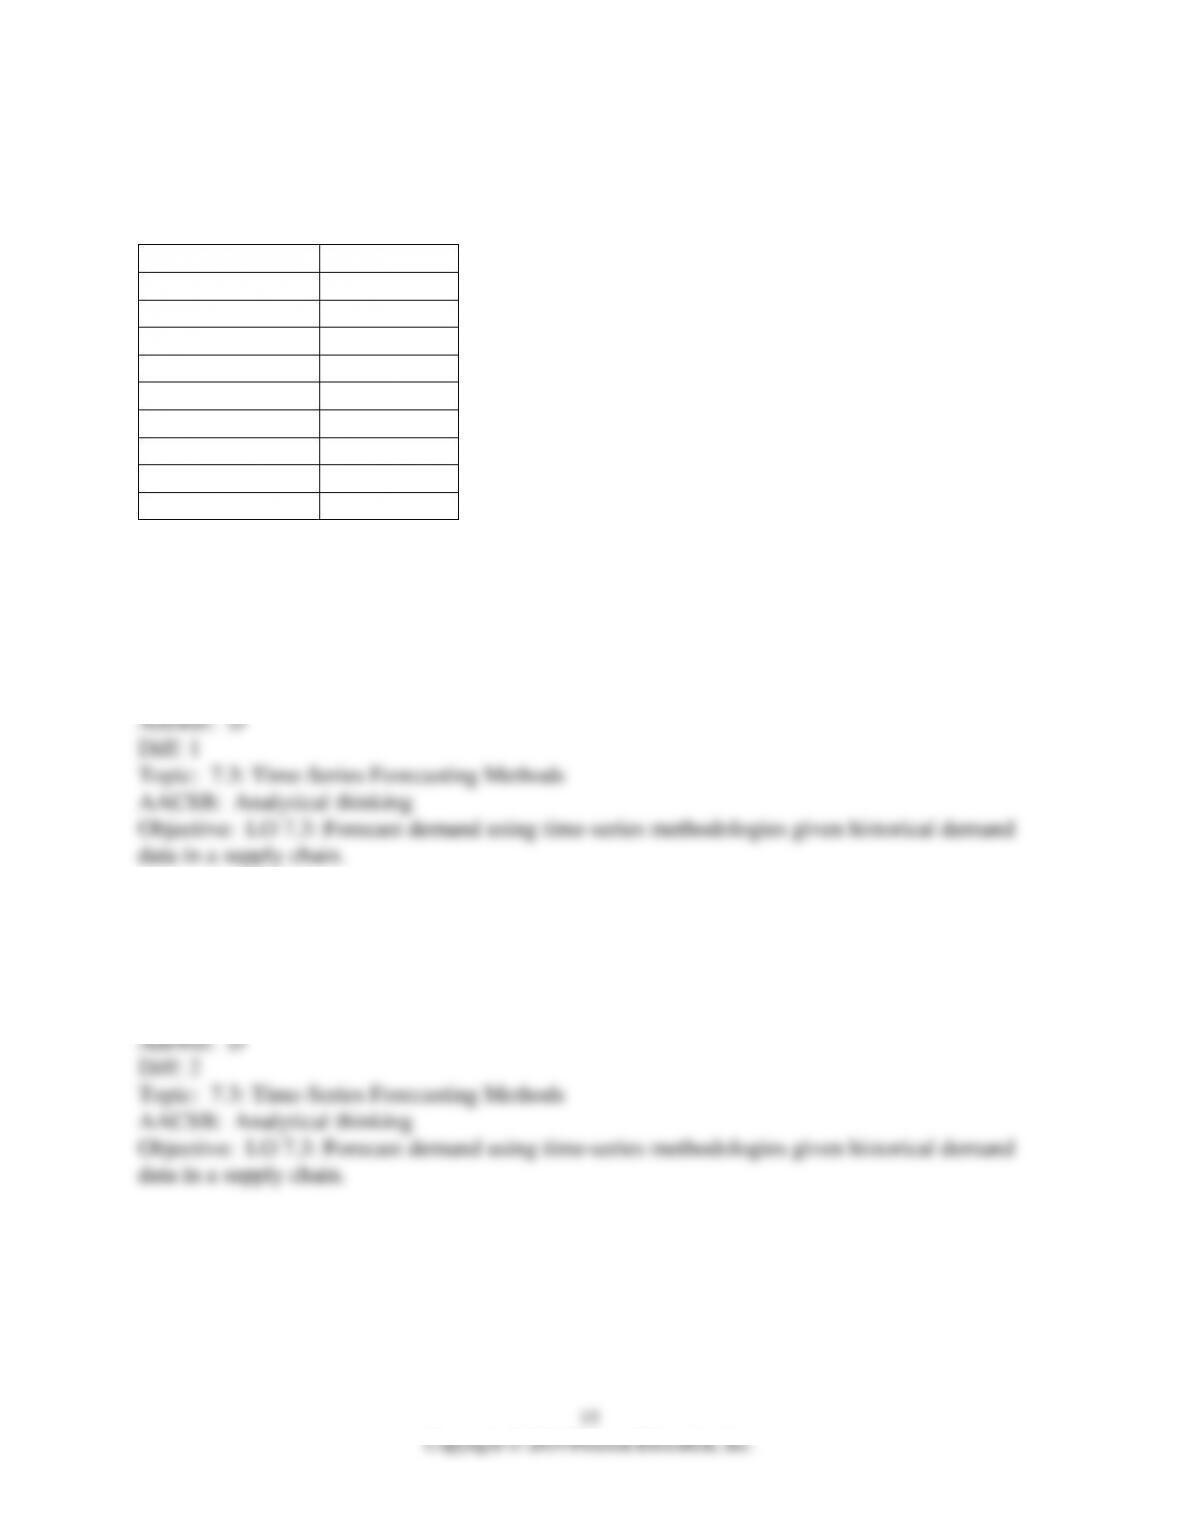
Scenario 7.1 — Marshmallow Madness
Historical demand for Peeps is as displayed in the table.
Month
Demand
January
11
February
18
March
31
April
39
May
44
June
53
July
67
August
82
September
96
35) Use a simple moving average of three periods to forecast the demand for July. What is the
forecast?
A) 67
B) 58
C) 48.5
D) 45.3
36) Use exponential smoothing to forecast the demand for March. What is the forecast if α = 0.7?
A) 17.58
B) 18.26
C) 18.74
D) 19.32