
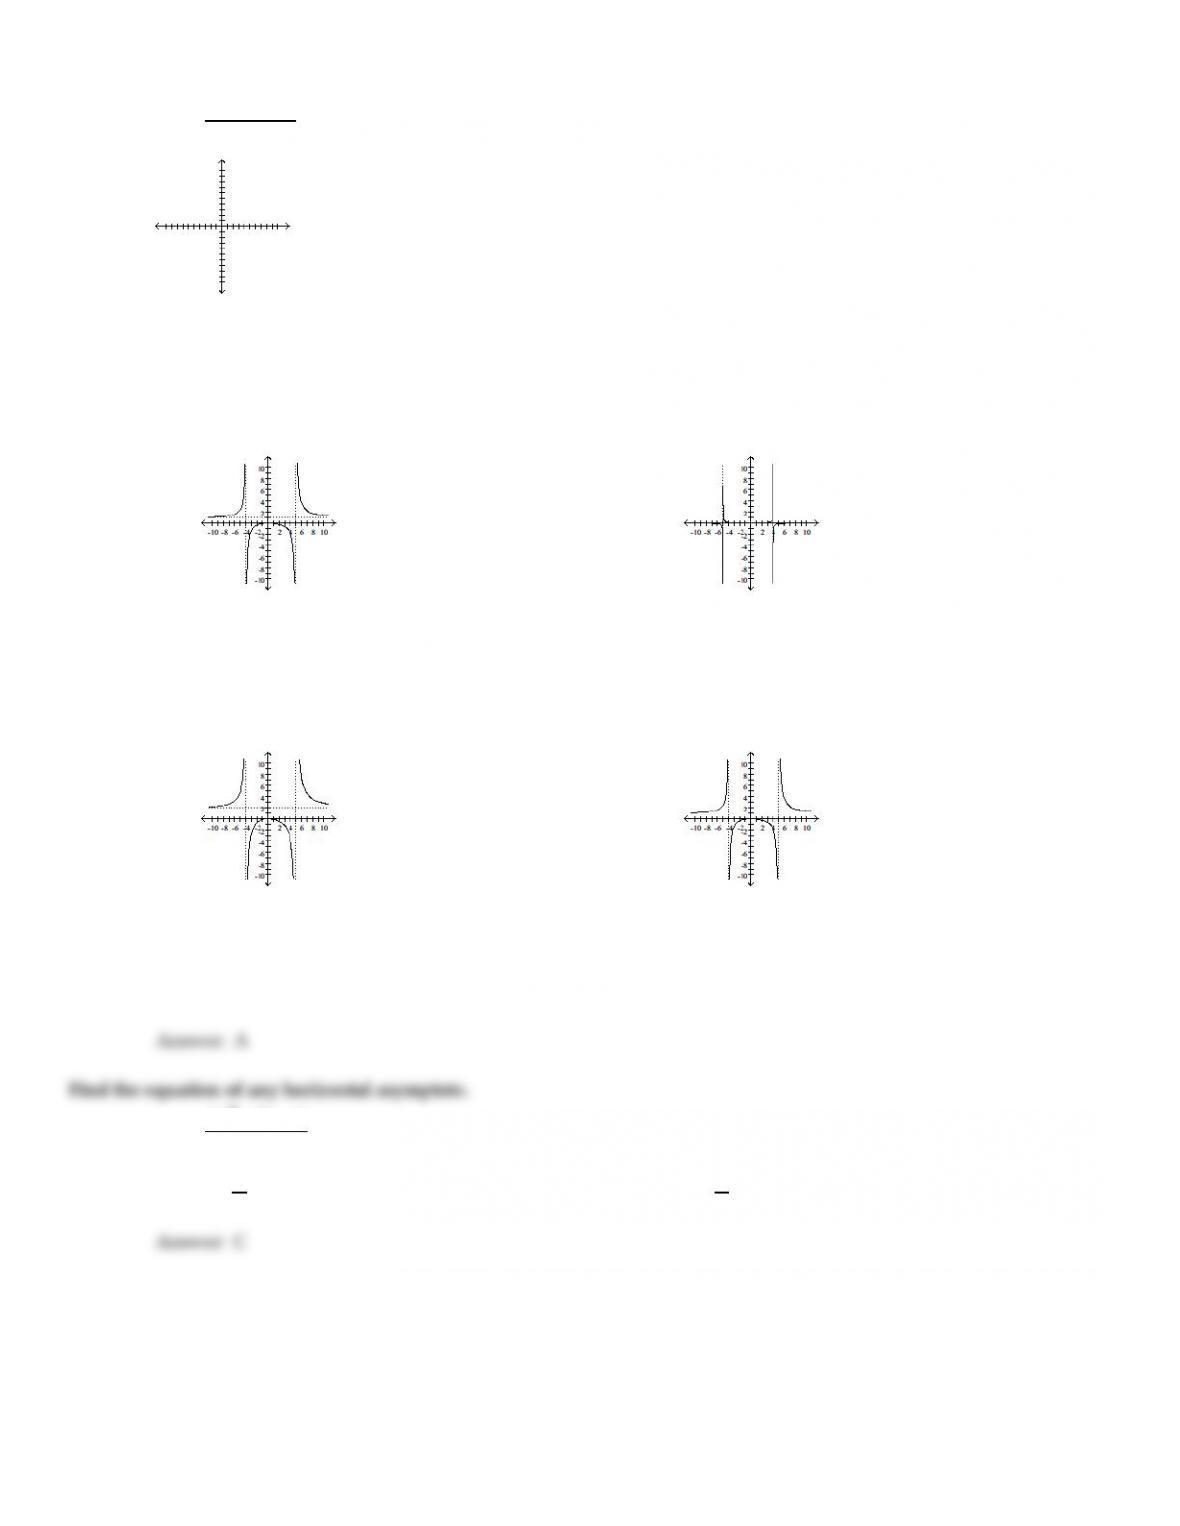
D)
(i) y intercept: 6
(ii) horizontal asymptote: y = 0; vertical asymptotes: x =6 and x = – 6
(iii)
Answer:
A
41

Sketch the graph of the function.
118)
f(x) =x + 1
x2+ x –12
A)
B)
C)
D)
Answer:
B
42
119)
f(x) =x2
x2– x –20
A)
B)
C)
D)
Answer:
A
Find the equation of any horizontal asymptote.
120)
f(x) =2x2– 7x – 9
5x2– 3x + 6
A)
y =7
3
B)
y = 0
C)
y =2
5
D)
None
Answer:
C
43

121)
f(x) =6x2+ 6
6x2– 6
A)
y = 1
B)
y = – 6
C)
y =6
D)
None
Answer:
A
122)
f(x) =x2+ 4x – 8
x – 8
A)
y =3
B)
y =8
C)
None
D)
y = – 4
Answer:
C
Find the equations of any vertical asymptotes.
123)
f(x) =3x – 11
x2+3x –4
A)
y =1, y = – 4
B)
x =1, x = – 4
C)
x = – 1, x =4
D)
y =3
Answer:
B
124)
f(x) =x2– 100
(x – 5)(x + 8)
A)
x =5, x = – 8
B)
x = – 5
C)
y =5, y = – 8
D)
x = 10, x = – 10
Answer:
A
125)
f(x) =x2+4x
x2–2x –24
A)
x =6, x = – 4
B)
x = – 6, x =4
C)
x =6
D)
None
Answer:
C
126)
f(x) =x – 4
x2+ 8
A)
x =8
B)
x = – 8
C)
x =2, x = – 2
D)
None
Answer:
D
44
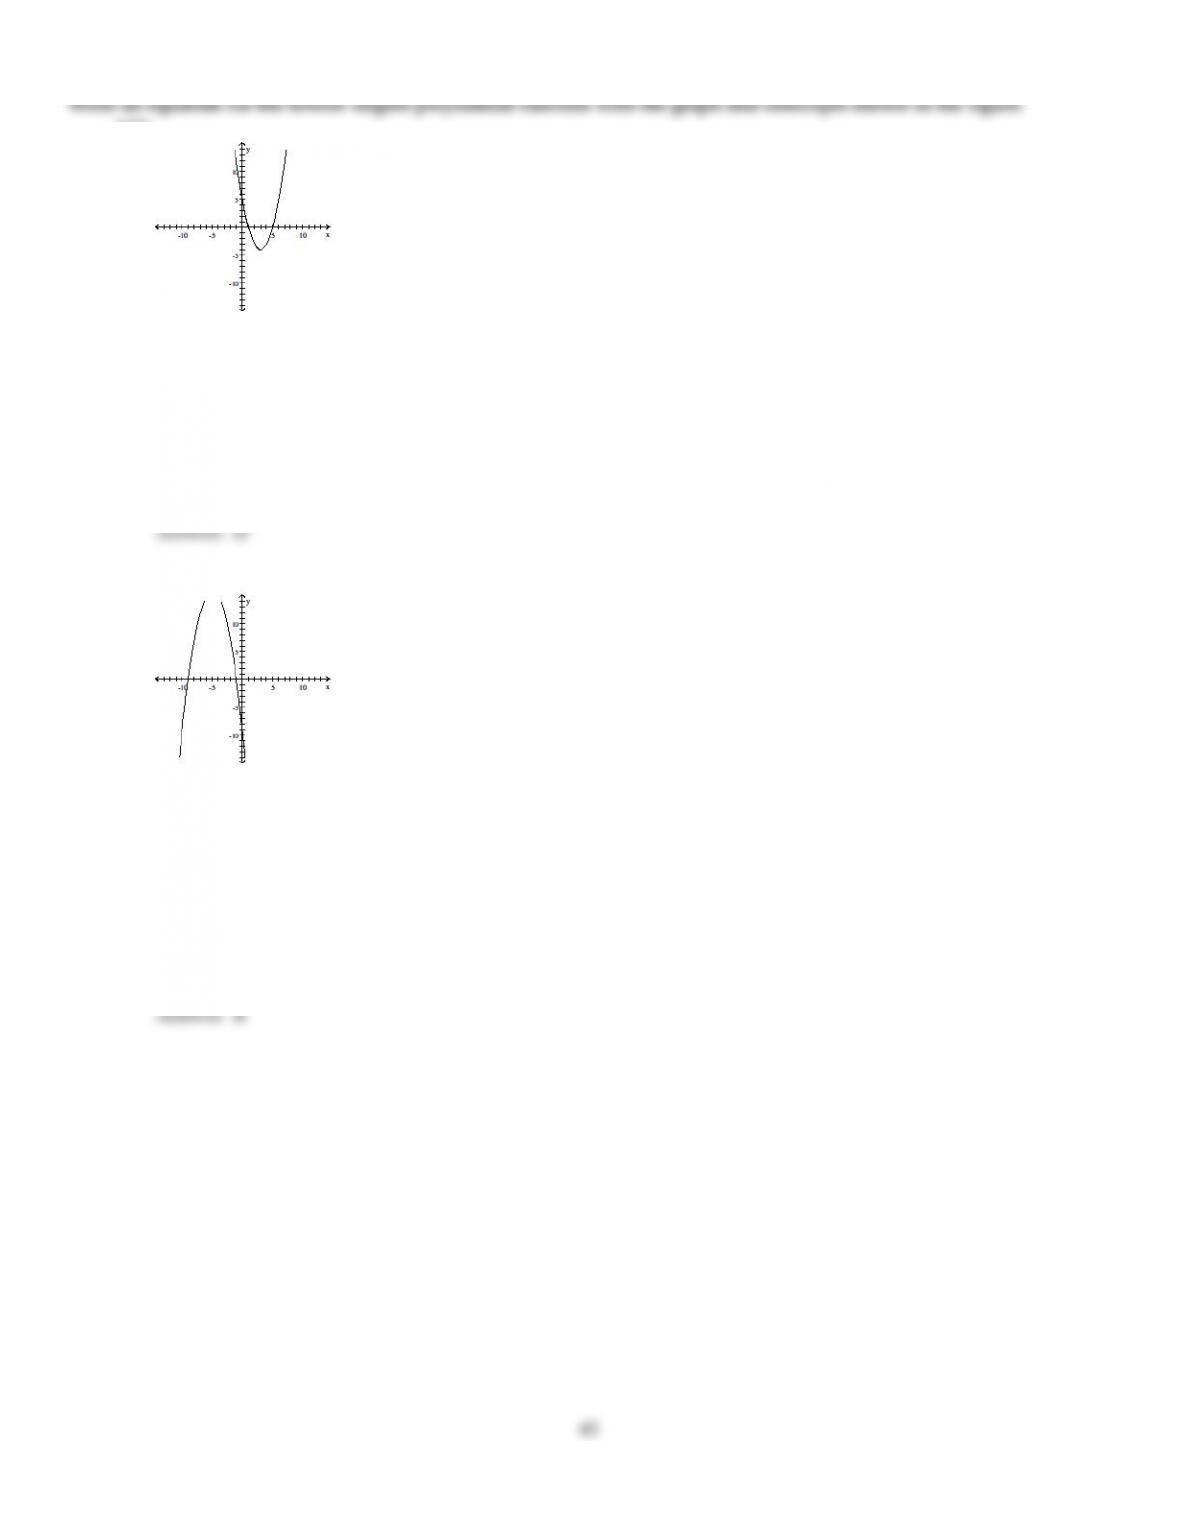
Write an equation for the lowest–degree polynomial function with the graph and intercepts shown in the figure.
127)
A)
f(x) =x2+ 6x + 5
B)
f(x) =x2+ 5x – 6
C)
f(x) =x2+ 5x + 6
D)
f(x) =x2– 6x + 5
Answer:
D
128)
A)
f(x) =x2+ 9x – 10
B)
f(x) = – x2– 10x –9
C)
f(x) =x2+ 10x + 9
D)
f(x) =x2+ 9x + 10
Answer:
B
45
129)
A)
f(x) =x3+ 16x
B)
f(x) = – x3– 16x
C)
f(x) = – x3+ 16x
D)
f(x) = – x3– 16x
Answer:
C
Solve the problem.
130)
Financial analysts in a company that manufactures ovens arrived at the following daily cost equation for
manufacturing x ovens per day: C(x) =x2+ 4x + 1800. The average cost per unit at a production level of x ovens
per day is C(x) = C(x)/x. (i) Find the rational function C. (ii) Sketch a graph of C(x) for 10
x 125. (iii) For what
daily production level (to the nearest integer) is the average cost per unit at a minimum, and what is the
minimum average cost per oven (to the nearest cent)? HINT: Refer to the sketch in part (ii) and evaluate C(x) at
appropriate integer values until a minimum value is found.
A)
(i) C(x) =x2+ 4x + 1800
x
(ii)
(iii) 44 units; $185.61 per oven
B)
(i) C(x) =x2+ 4x + 1800
x
(ii)
(iii) 61 units; $133.29 per oven
46
C)
(i) C(x) =x2+ 4x + 1800
x
(ii)
(iii) 42 units; $88.86 per oven
D)
(i) C(x) =x2+ 4x + 1800
x
(ii)
(iii) 22 units; $48.93 per oven
Answer:
C
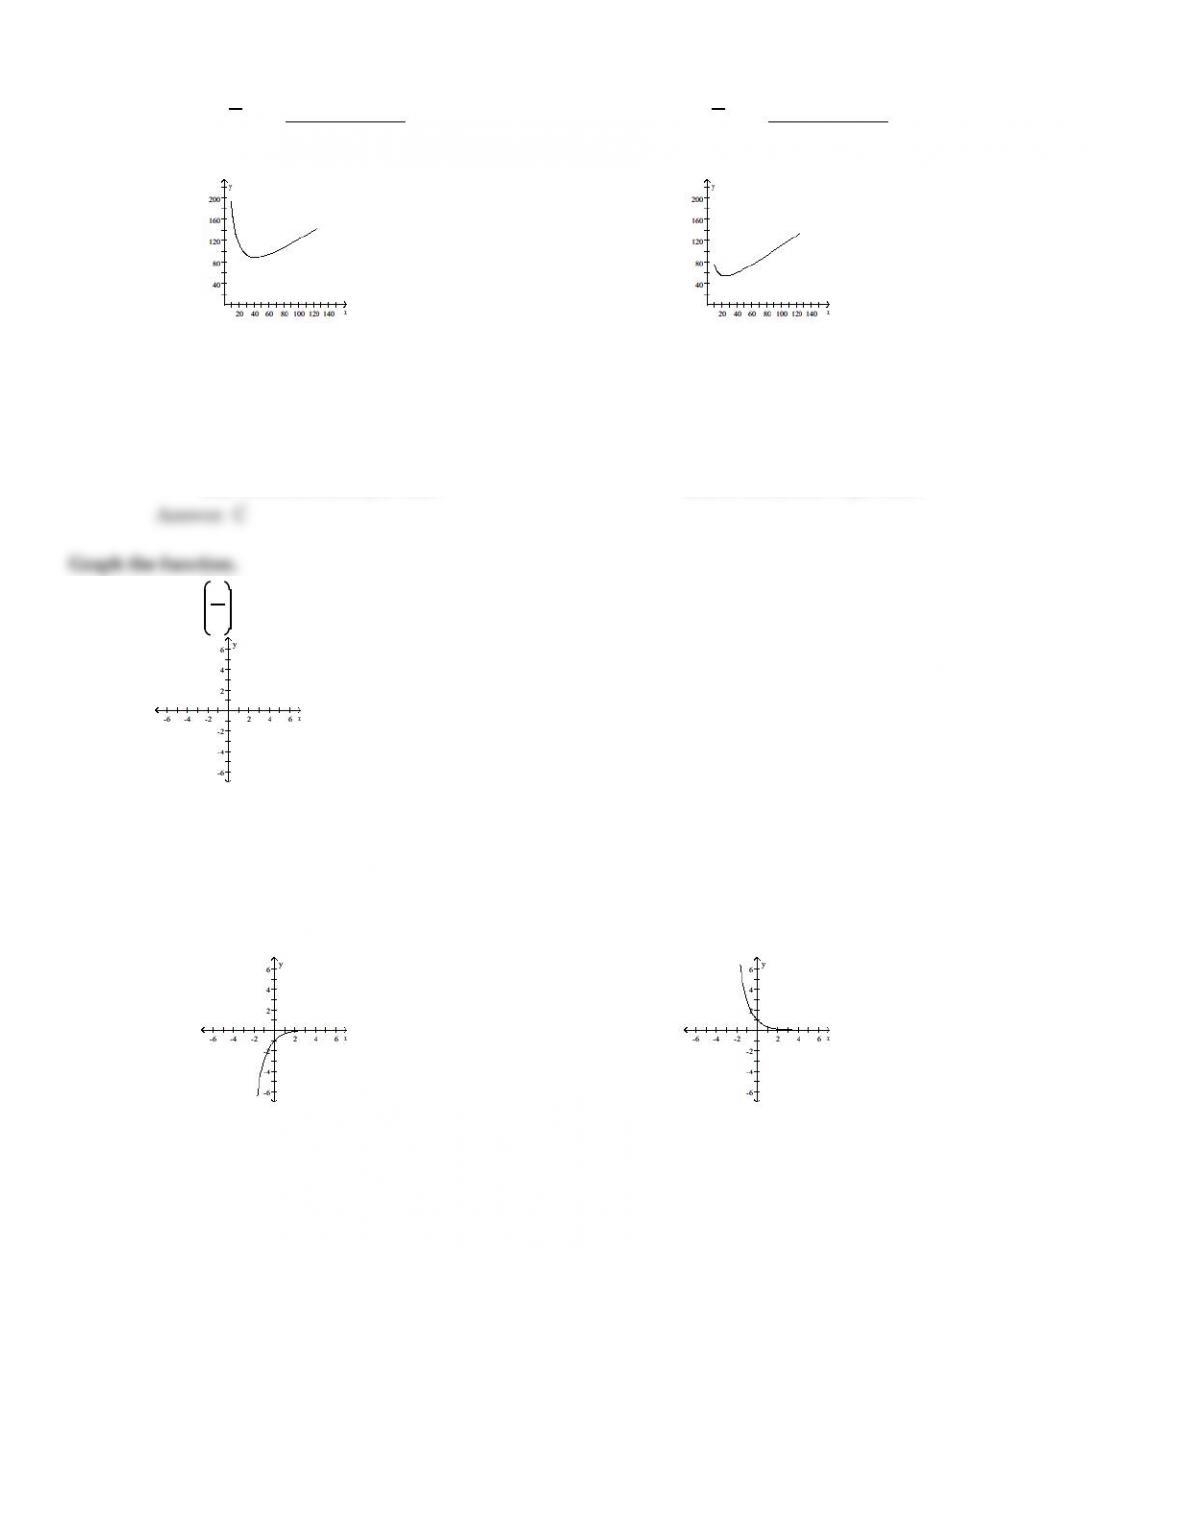
Graph the function.
131)
f(x) =1
3
x
A)
B)
47
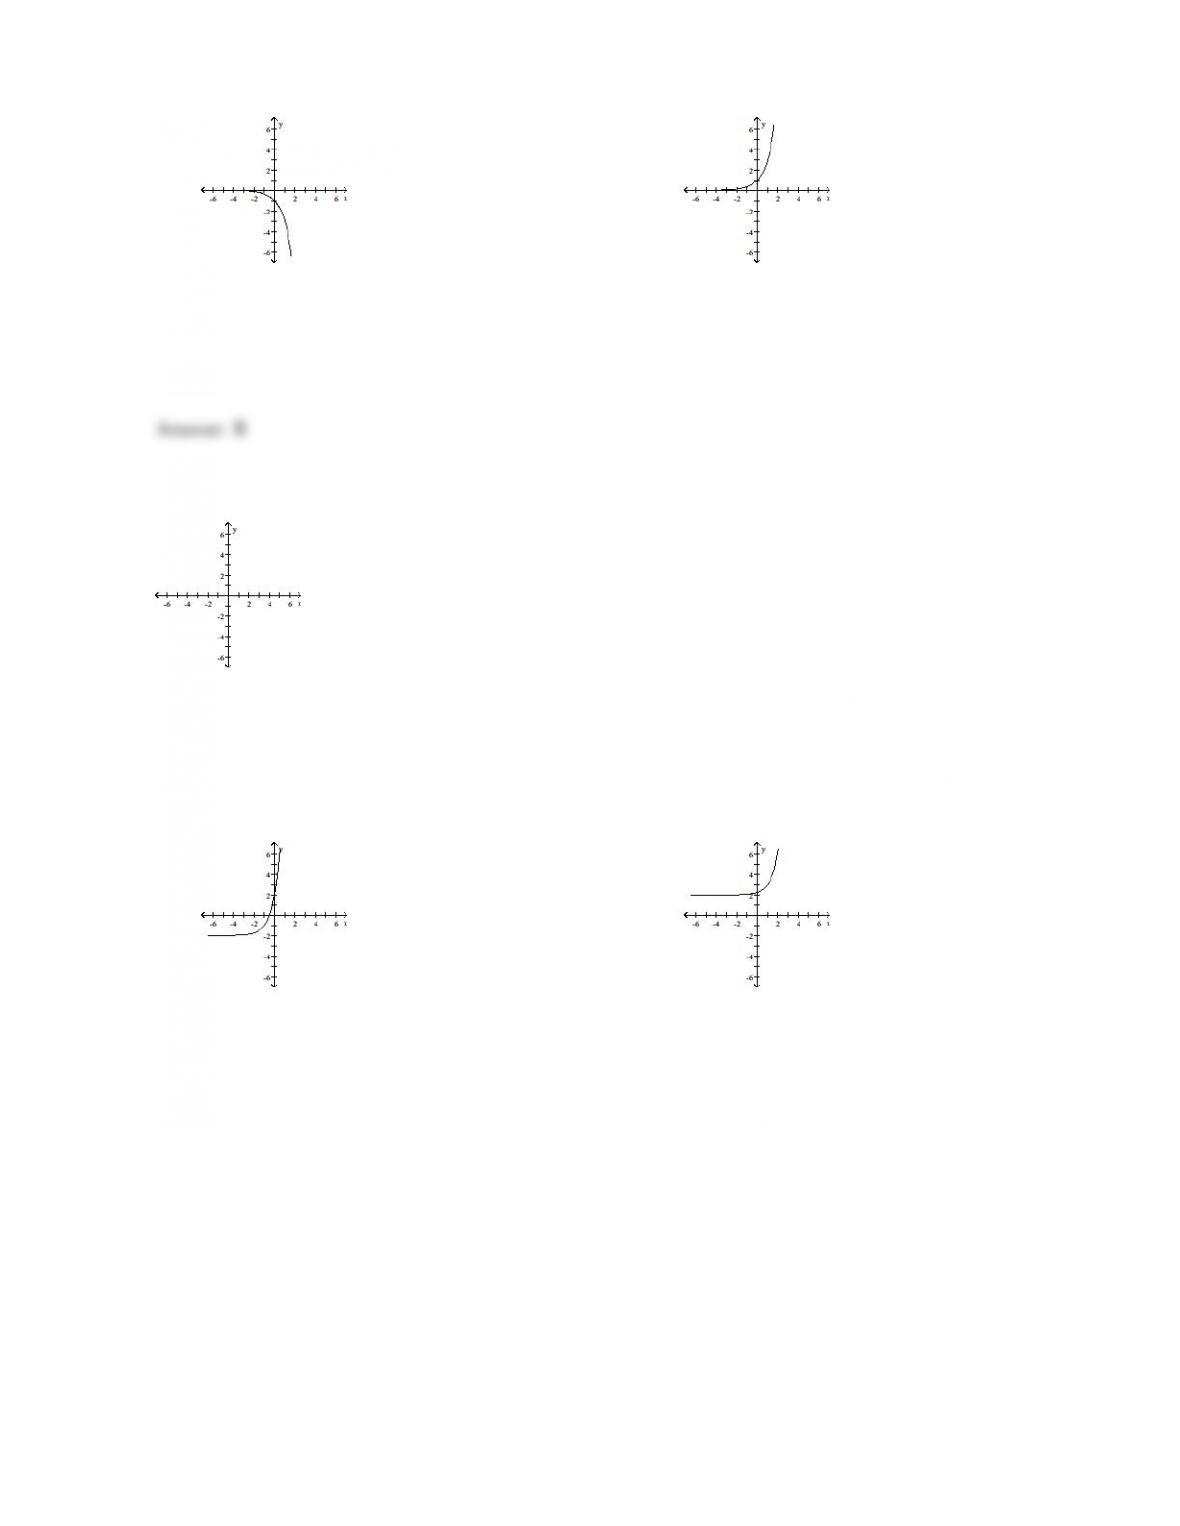
C)
D)
Answer:
B
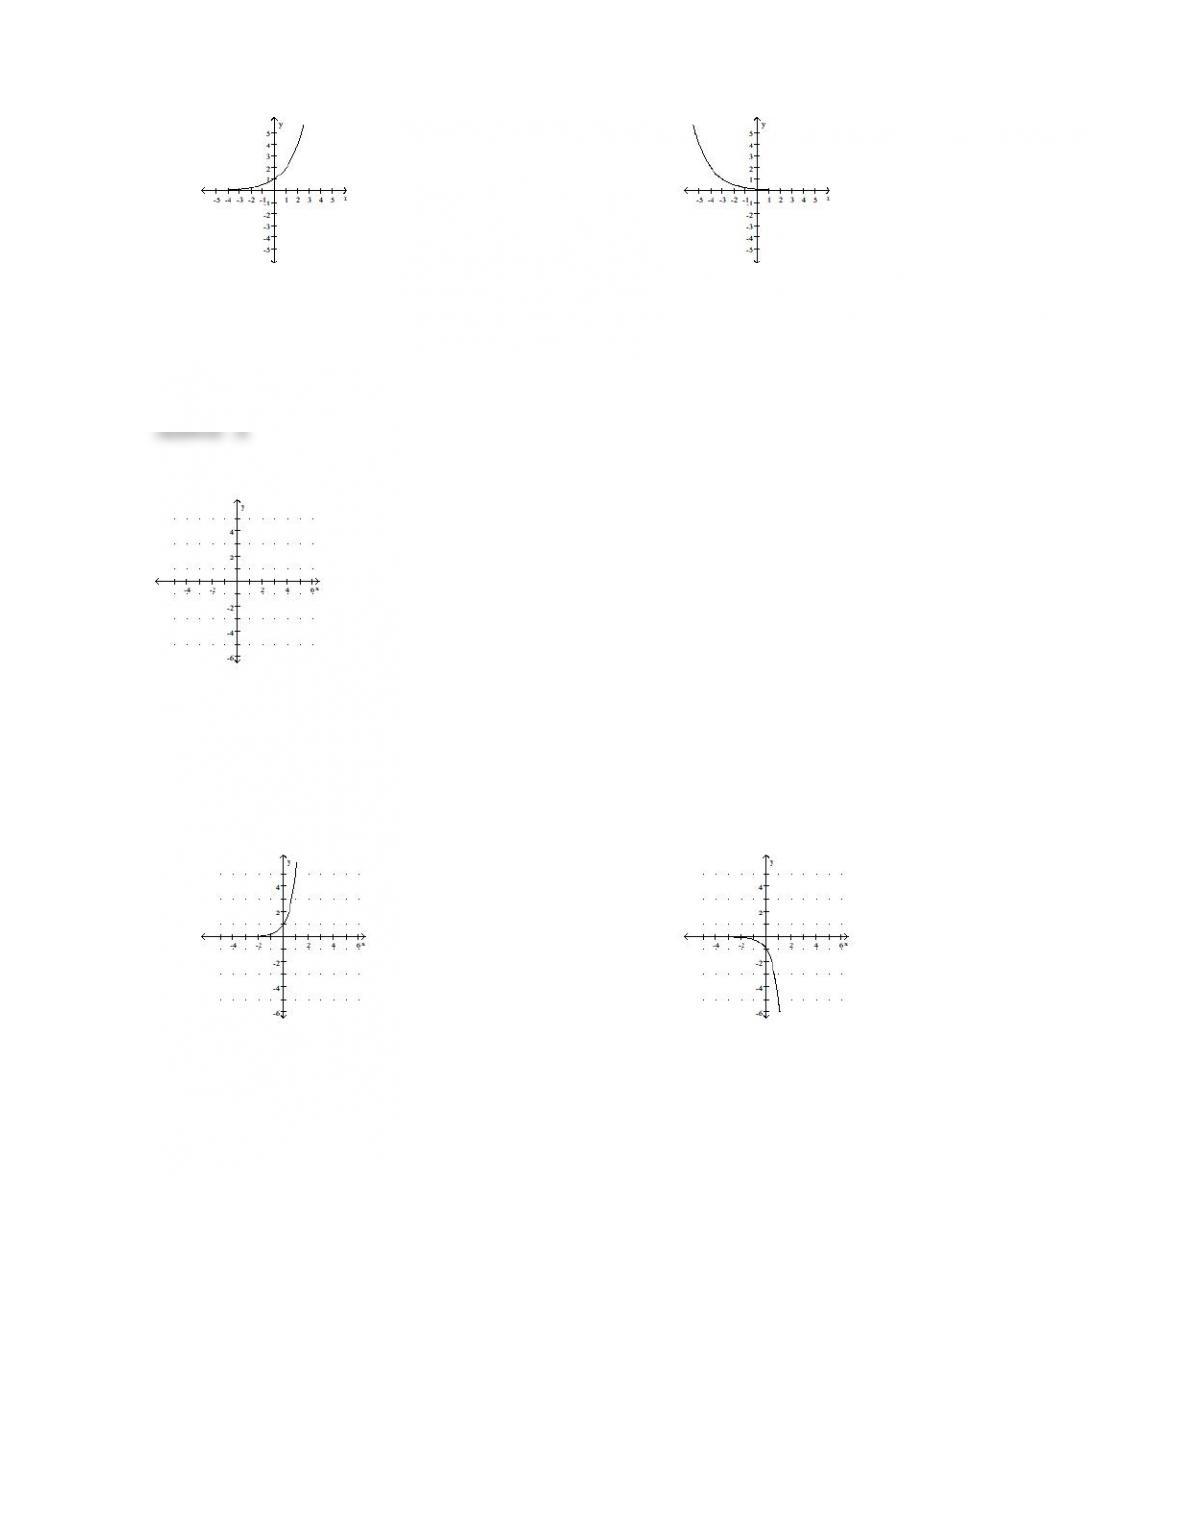
132)
f(x) =4(x + 1)+ 2
A)
B)
48

C)
D)
Answer:
D
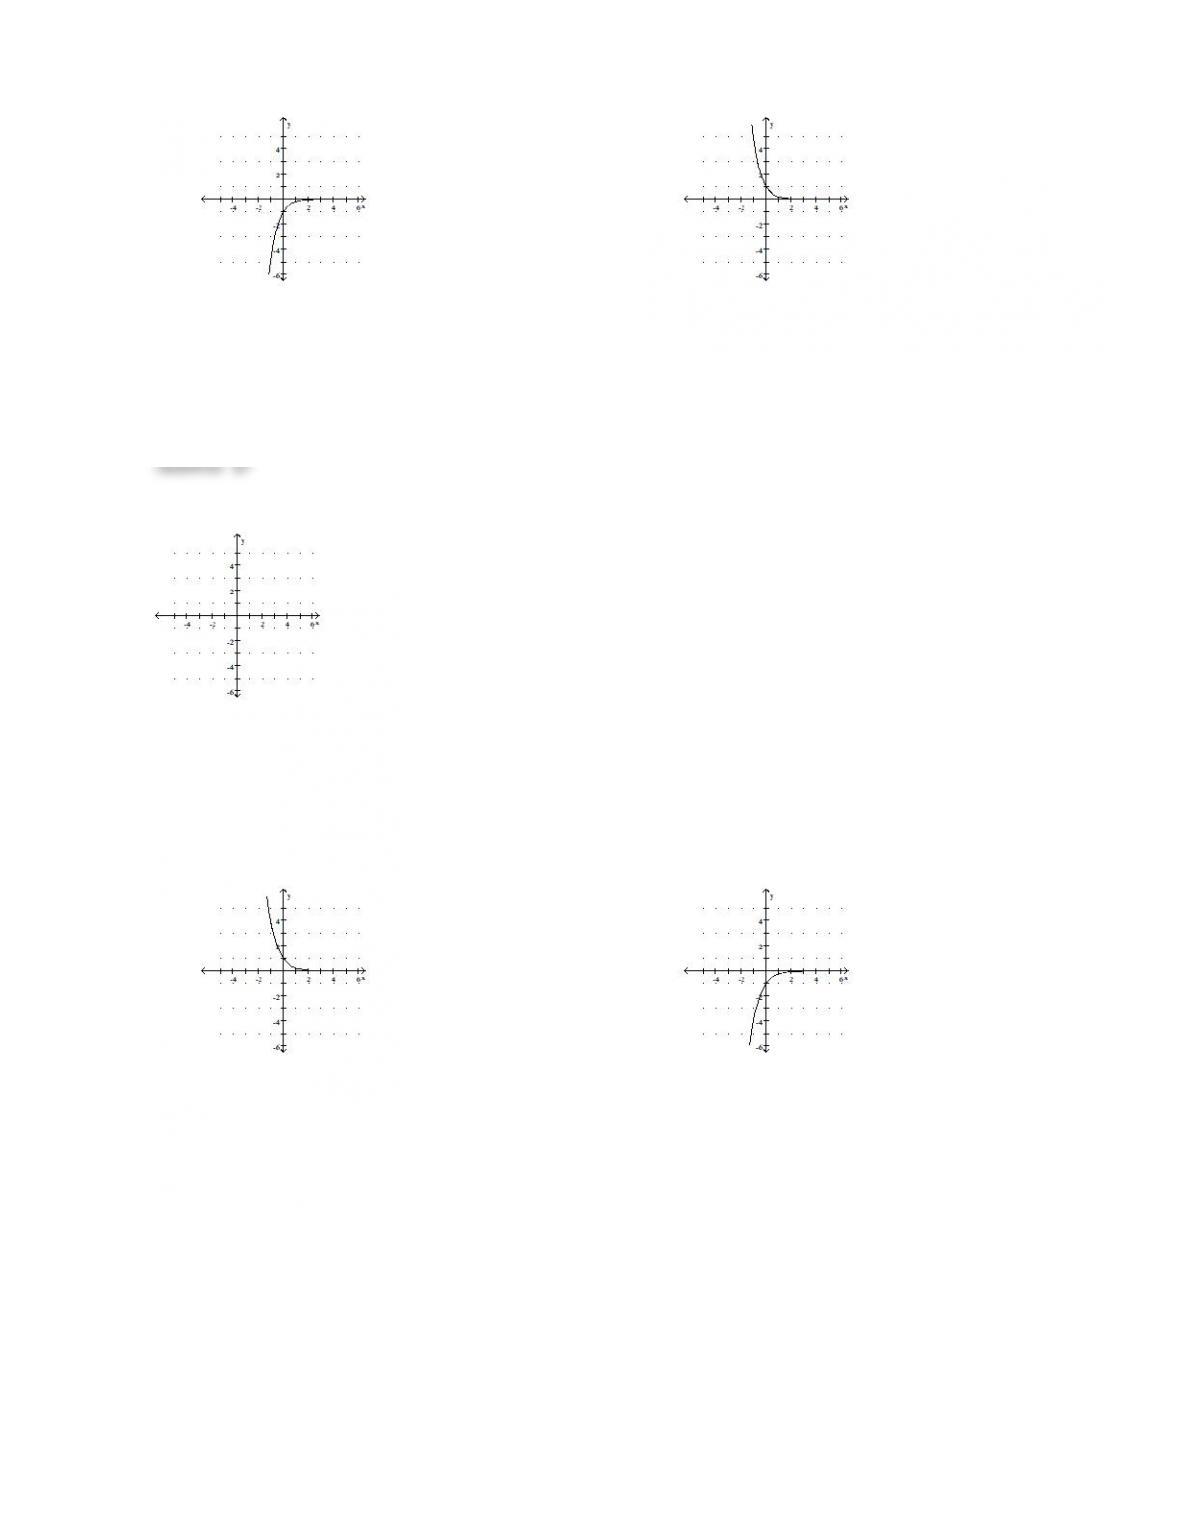
133)
f(x) =2– x –3
A)
B)
49
C)
D)
Answer:
A
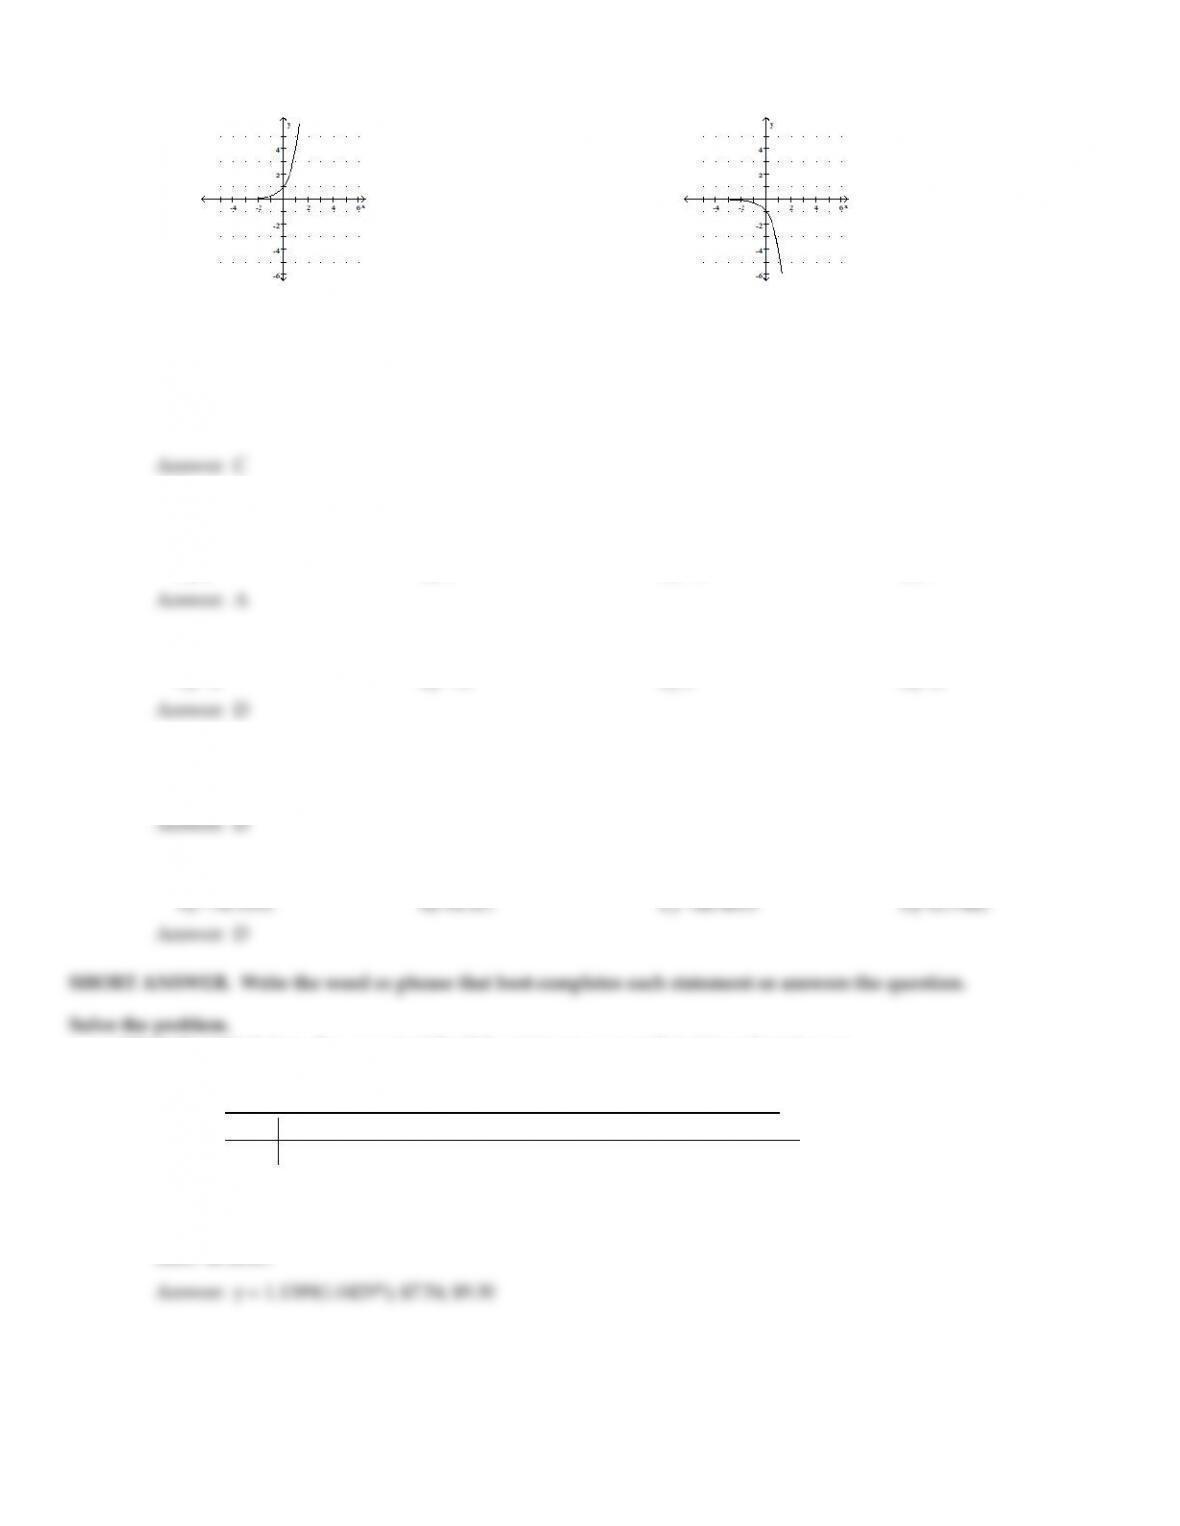
134)
f(x) =0.2x
A)
B)
50
C)
D)
Answer:
D
135)
f(x) =4x
A)
B)
51
C)
D)
Answer:
C
Solve the equation.
136)
Solve for x: 3(1 + 2x) = 27
A)
1
B)
3
C)
–1
D)
9
Answer:
A
137)
Solve for x: 24x =8x + 5
A)
–5
B)
–15
C)
5
D)
15
Answer:
D
138)
Solve for x: (ex)x·e20 =e9x
A)
{–5, –4}
B)
{5}
C)
{4}
D)
{5, 4}
Answer:
D
139)
Solve for t: e–0.07t = 0.05 Round your answer to four decimal places.
A)
–70.1312
B)
44.321
C)
–66.4815
D)
42.7962
Answer:
D
SHORT ANSWER. Write the word or phrase that best completes each statement or answers the question.
Solve the problem.
140)
In the table below, the amount of the U.S. minimum wage is listed for selected years.
U.S. Minimum Wage
Year 1961 1967 1974 1980 1981 1990 1991 1996 1997
Wage $1.15 $1.40 $2.00 $3.10 $3.35 $3.80 $4.25 $4.75 $5.15
Find an exponential regression model of the form y = a ·bx, where y represents the U.S. minimum wage x years
after 1960. Round a and b to four decimal places. According to this model, what will the minimum wage be in
2005? In 2010?
Answer:
y = 1.1389(1.0429x); $7.54; $9.30
52