14) Shelcal, Inc. provides the following data for the year 2019:
Net Sales Revenue
437,960
Cost of Goods Sold
257,000
The cost of goods sold as a percentage of net sales revenue is ________. (Round your answer to two
decimal places.)
A) 58.84%
B) 58.96%
C) 58.41%
D) 58.68%
15) Mercer, Inc. provides the following data for 2019:
Net Sales Revenue
602,000
Cost of Goods Sold
380,000
The gross profit as a percentage of net sales is ________. (Round your answer to two decimal places.)
A) 35.24%
B) 36.88%
C) 63.12%
D) 38.21%
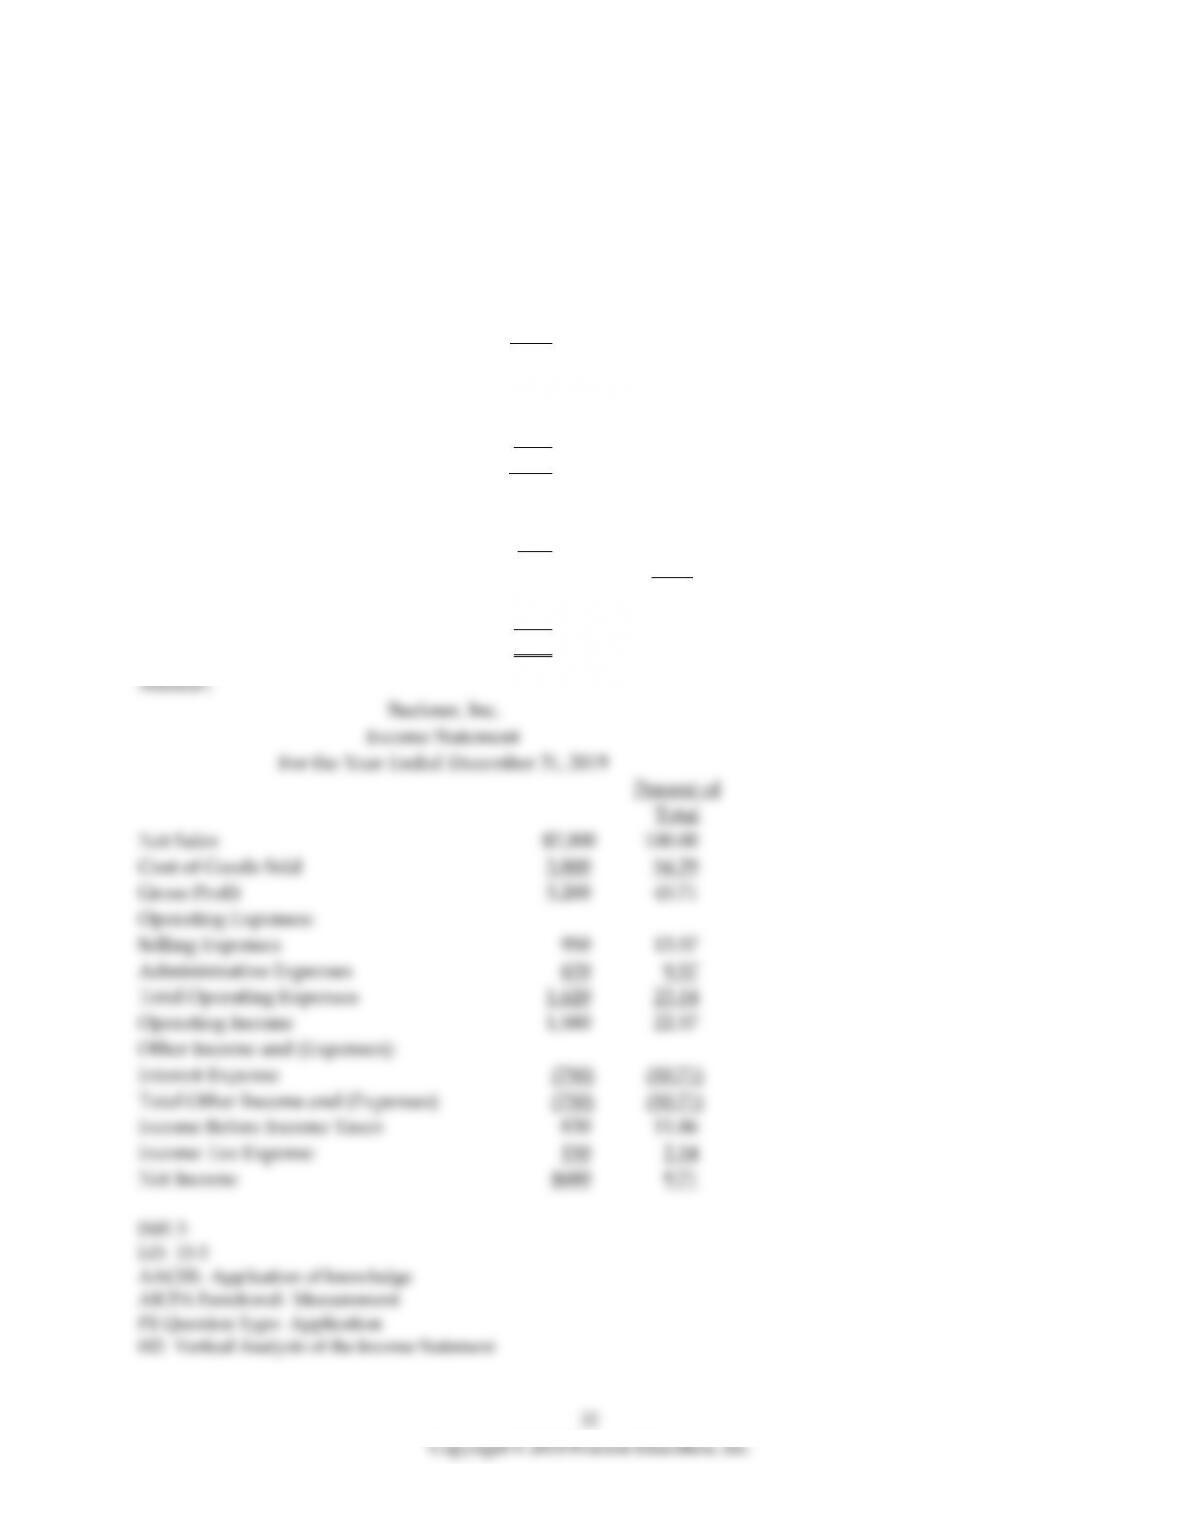
16) Prepare a vertical analysis of the income statement shown below. (Round to two decimal places.)
Buckner, Inc.
Income Statement
For the Year Ended December 31, 2019
Net Sales $7,000
Cost of Goods Sold 3,800
Gross Profit 3,200
Operating Expenses:
Selling Expenses 950
Administrative Expenses 670
Total Operating Expenses 1,620
Operating Income 1,580
Other Income and (Expenses):
Interest Expense 750)
Total Other Income and (Expenses) (750)
Income Before Income Taxes 830
Income Tax Expense 150
Net Income $680
17) In a vertical analysis of the balance sheet, the base amount is total liabilities.
18) For the vertical analysis of the balance sheet, the base amount is also the total of liabilities and
stockholders’ equity.
19) Reliable Moving Company reported the following amounts on its balance sheet as of December 31,
2019 and December 31, 2018:
2019
2018
Cash and Receivables
$75,000
$135,000
Merchandise Inventory
155,000
220,000
Property, Plant and Equipment, net
770,000
770,000
Total Assets
$1,000,000
$1,125,000
Total Liabilities
$465,000
$435,000
For the vertical analysis, what is the percentage of total liabilities for December 31, 2018? (Round your
answer to two decimal places.)
A) 100.00%
B) 46.50%
C) 31.03%
D) 38.67%
20) Allstate Moving Company reported the following amounts on its balance sheet as of December 31,
2019 and December 31, 2018:
2019
2018
Cash and Receivables
$75,000
$145,000
Merchandise Inventory
175,000
250,000
Property, Plant and Equipment, net
820,000
710,000
Total Assets
$1,070,000
$1,105,000
Total Liabilities
$455,000
$405,000
For the vertical analysis, what is the percentage of current assets as of December 31, 2019? (Round your
answer to two decimal places.)
A) 23.36%
B) 35.75%
C) 55.63%
D) 30.49%
21) Modern Moving Company reported the following amounts on its balance sheet as of December 31,
2019 and December 31, 2018:
2019
2018
Cash and Receivables
$175,000
$135,000
Merchandise Inventory
235,000
170,000
Property, Plant and Equipment, net
780,000
790,000
Total Assets
$1,190,000
$1,095,000
Total Liabilities
$485,000
$445,000
For the vertical analysis, what is the percentage of stockholders’ equity as of December 31, 2019? (Round
your answer to two decimal places.)
A) 100.00%
B) 59.36%
C) 59.24%
D) There is not enough information provided to make this computation.

36
22) Prepare a vertical analysis for the balance sheet data given below. (Round to two decimal places.)
Petals, Inc.
Balance Sheet
December 31, 2019
Assets
Current Assets:
Cash and Cash Equivalents $10,000
Accounts Receivable, Net 15,600
Merchandise Inventory 38,000
Total Current Assets 63,600
Long-term Investments 15,000
Property, Plant, and Equipment, Net 195,000
Total Assets $273,600
Liabilities
Current Liabilities:
Accounts Payable $8,500
Notes Payable 1,400
Total Current Liabilities 9,900
Long-term Liabilities 54,000
Total Liabilities 63,900
Stockholders’ Equity
Common Stock 161,000
Retained Earnings 48,700
Total Stockholders’ Equity 209,700
Total Liabilities and Stockholders’ Equity $273,600
37
Copyright © 2018 Pearson Education, Inc.
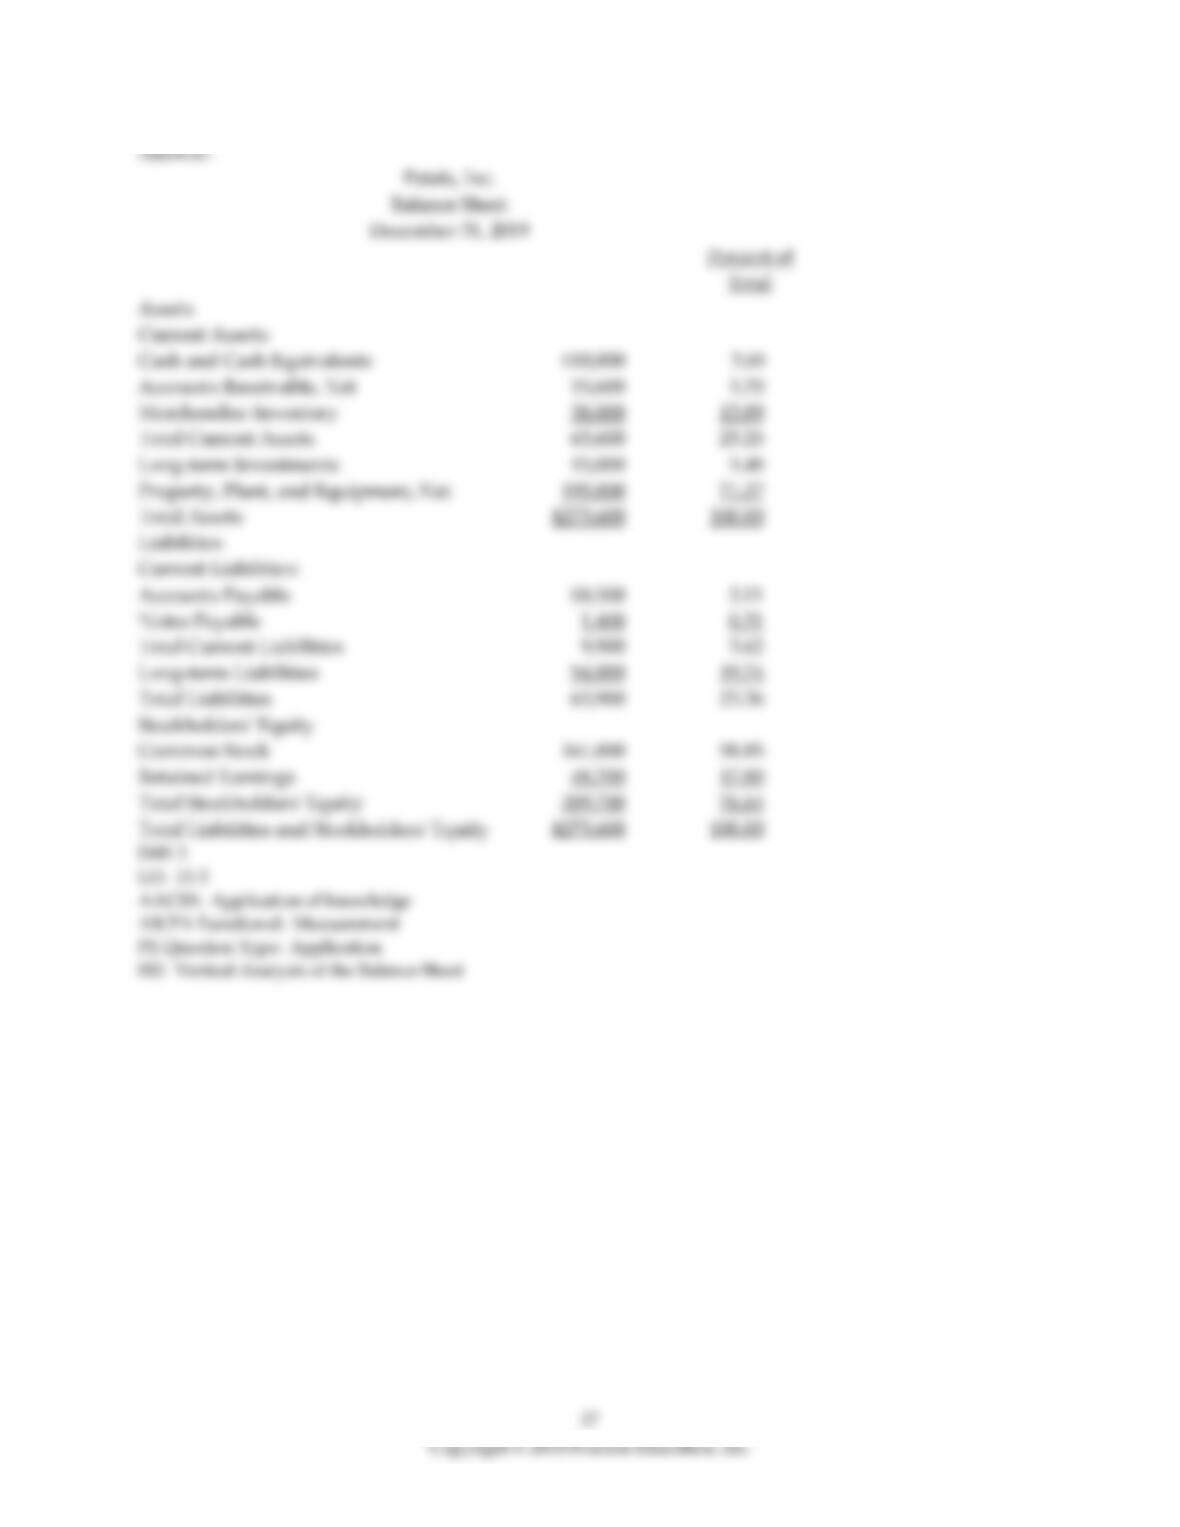
Answer:
Petals, Inc.
Balance Sheet
December 31, 2019
Percent of
Total
Assets
Current Assets:
Cash and Cash Equivalents $10,000 3.65
Accounts Receivable, Net 15,600 5.70
Merchandise Inventory 38,000 13.89
Total Current Assets 63,600 23.25
Long-term Investments 15,000 5.48
Property, Plant, and Equipment, Net 195,000 71.27
Total Assets $273,600 100.00
Liabilities
Current Liabilities:
Accounts Payable $8,500 3.11
Notes Payable 1,400 0.51
Total Current Liabilities 9,900 3.62
Long-term Liabilities 54,000 19.74
Total Liabilities 63,900 23.36
Stockholders’ Equity
Common Stock 161,000 58.85
Retained Earnings 48,700 17.80
Total Stockholders’ Equity 209,700 76.64
Total Liabilities and Stockholders’ Equity $273,600 100.00
Diff: 3
LO: 15-3
AACSB: Application of knowledge
AICPA Functional: Measurement
PE Question Type: Application
H2: Vertical Analysis of the Balance Sheet
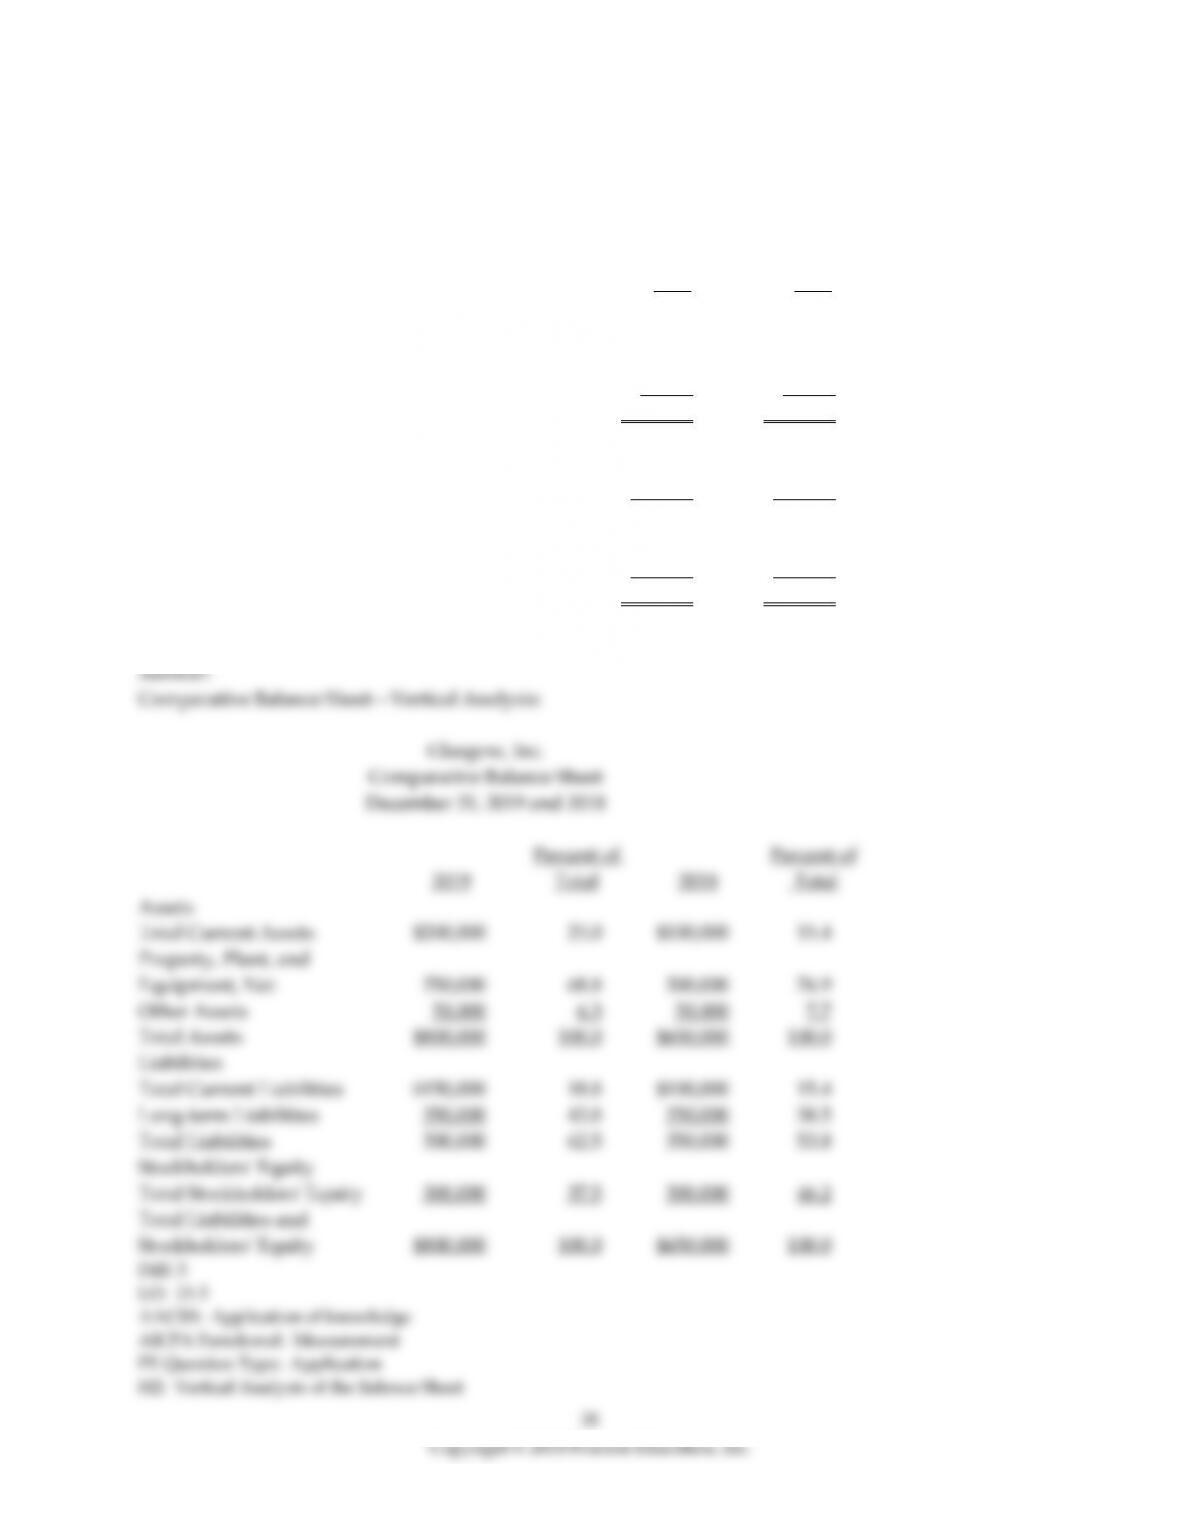
23) Glasgow, Inc. provides the following:
Glasgow, Inc.
Comparative Balance Sheet
December 31, 2019 and 2018
2019 2018
Assets
Total Current Assets $200,000 $100,000
Property, Plant, and Equipment, Net 550,000 500,000
Other Assets 50,000 50,000
Total Assets $800,000 $650,000
Liabilities
Total Current Liabilities $150,000 $100,000
Long-term Liabilities 350,000 250,000
Total Liabilities 500,000 350,000
Stockholders’ Equity
Total Stockholders’ Equity 300,000 300,000
Total Liabilities and Stockholders’ Equity $800,000 $650,000
Perform a vertical analysis of Glasgow‘s balance sheet for each year. (Round to one decimal place.)
24) A common-size statement reports the same percentages that appear in a vertical analysis.
25) Dollar value bias is the bias one sees from comparing numbers in relative (dollars) rather than
absolute (percentage) terms.
26) A common-size statement reports the same percentages that appear in a ________.
A) horizontal analysis
B) financial statement
C) vertical analysis
D) cost statement
27) Common-size statements ________.
A) allow the users to compare numbers in relative terms rather than absolute amounts
B) report dollar amounts and percentages
C) create a dollar value bias
D) show the same percentages that appear in a horizontal analysis
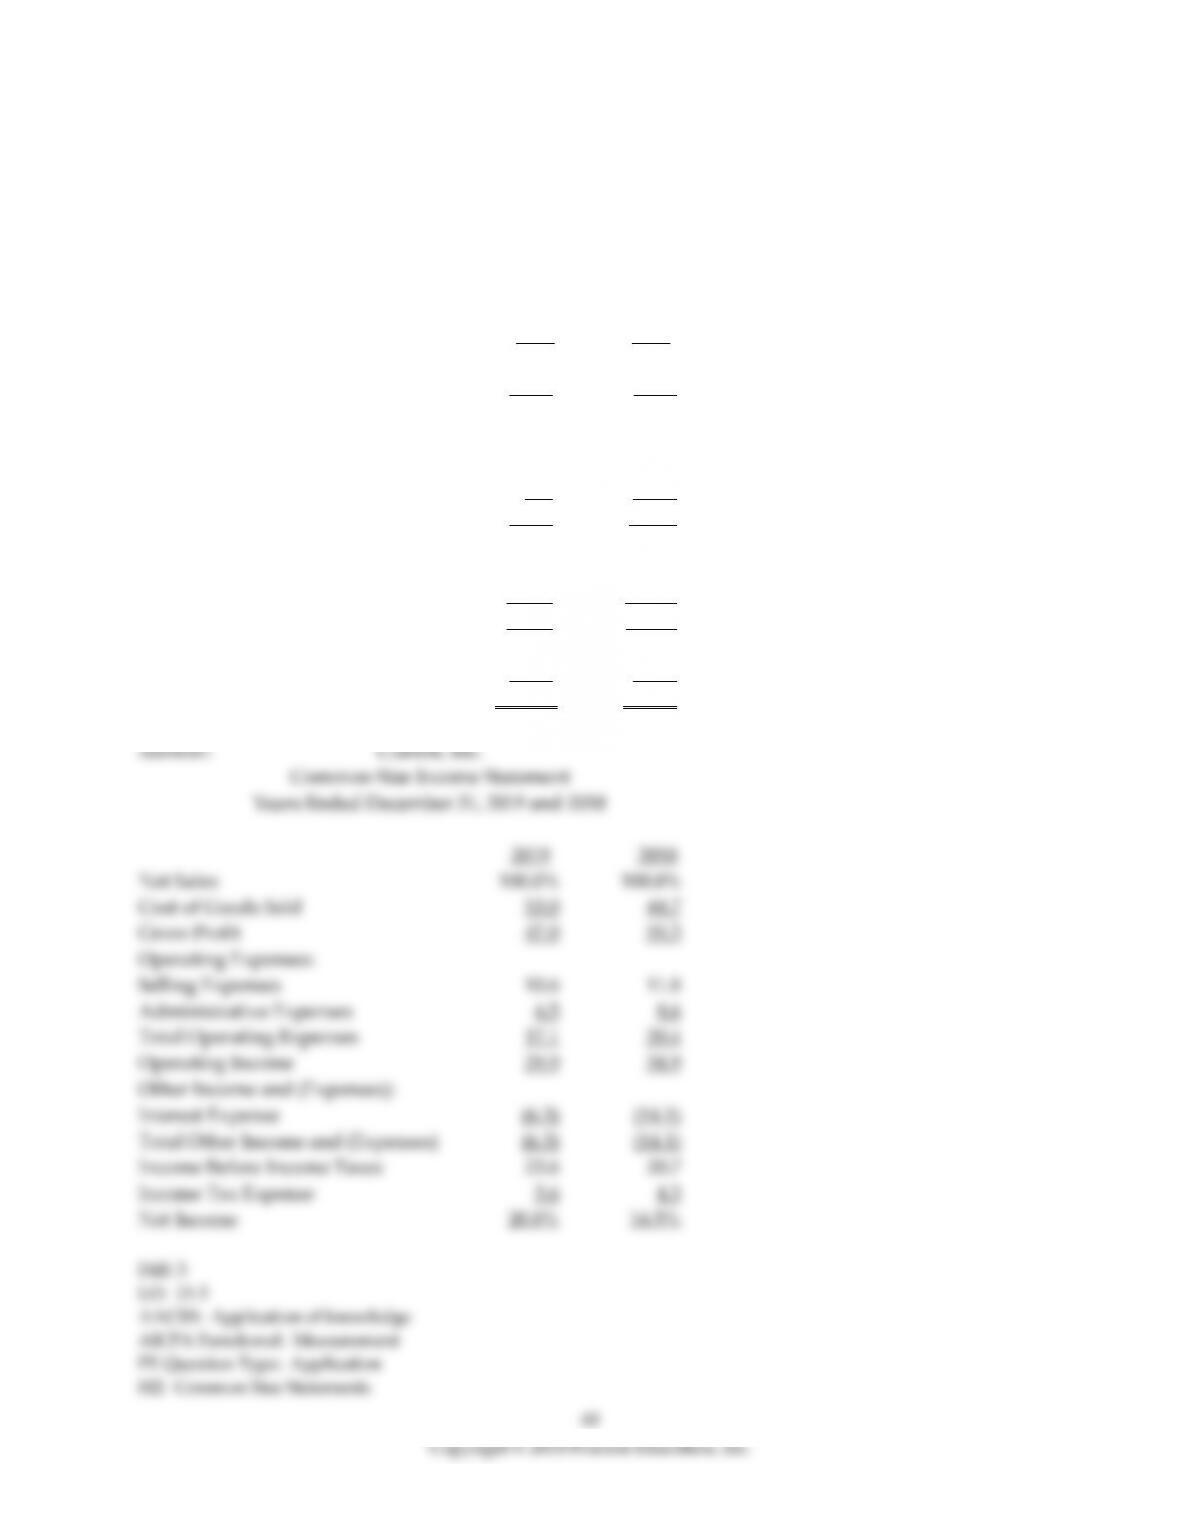
28) Prepare a comparative common-size income statement for Clarion, Inc. for 2019 and 2018 data.
(Round percentages to one decimal place.)
Clarion, Inc.
Comparative Income Statement
Years Ended December 31, 2019 and 2018
2019 2018
Net Sales $ 6,355 $ 4,920
Cost of Goods Sold 3,370 2,200
Gross Profit 2,985 2,720
Operating Expenses:
Selling Expenses 675 580
Administrative Expenses 410 425
Total Operating Expenses 1,085 1,005
Operating Income 1,900 1,715
Other Income and (Expenses):
Interest Expense (400) (695)
Total Other Income and (Expenses) (400) (695)
Income Before Income Taxes 1,500 1,020
Income Tax Expense 230 210
Net Income $ 1,270 $ 810