21
Copyright © 2018 Pearson Education, Inc.
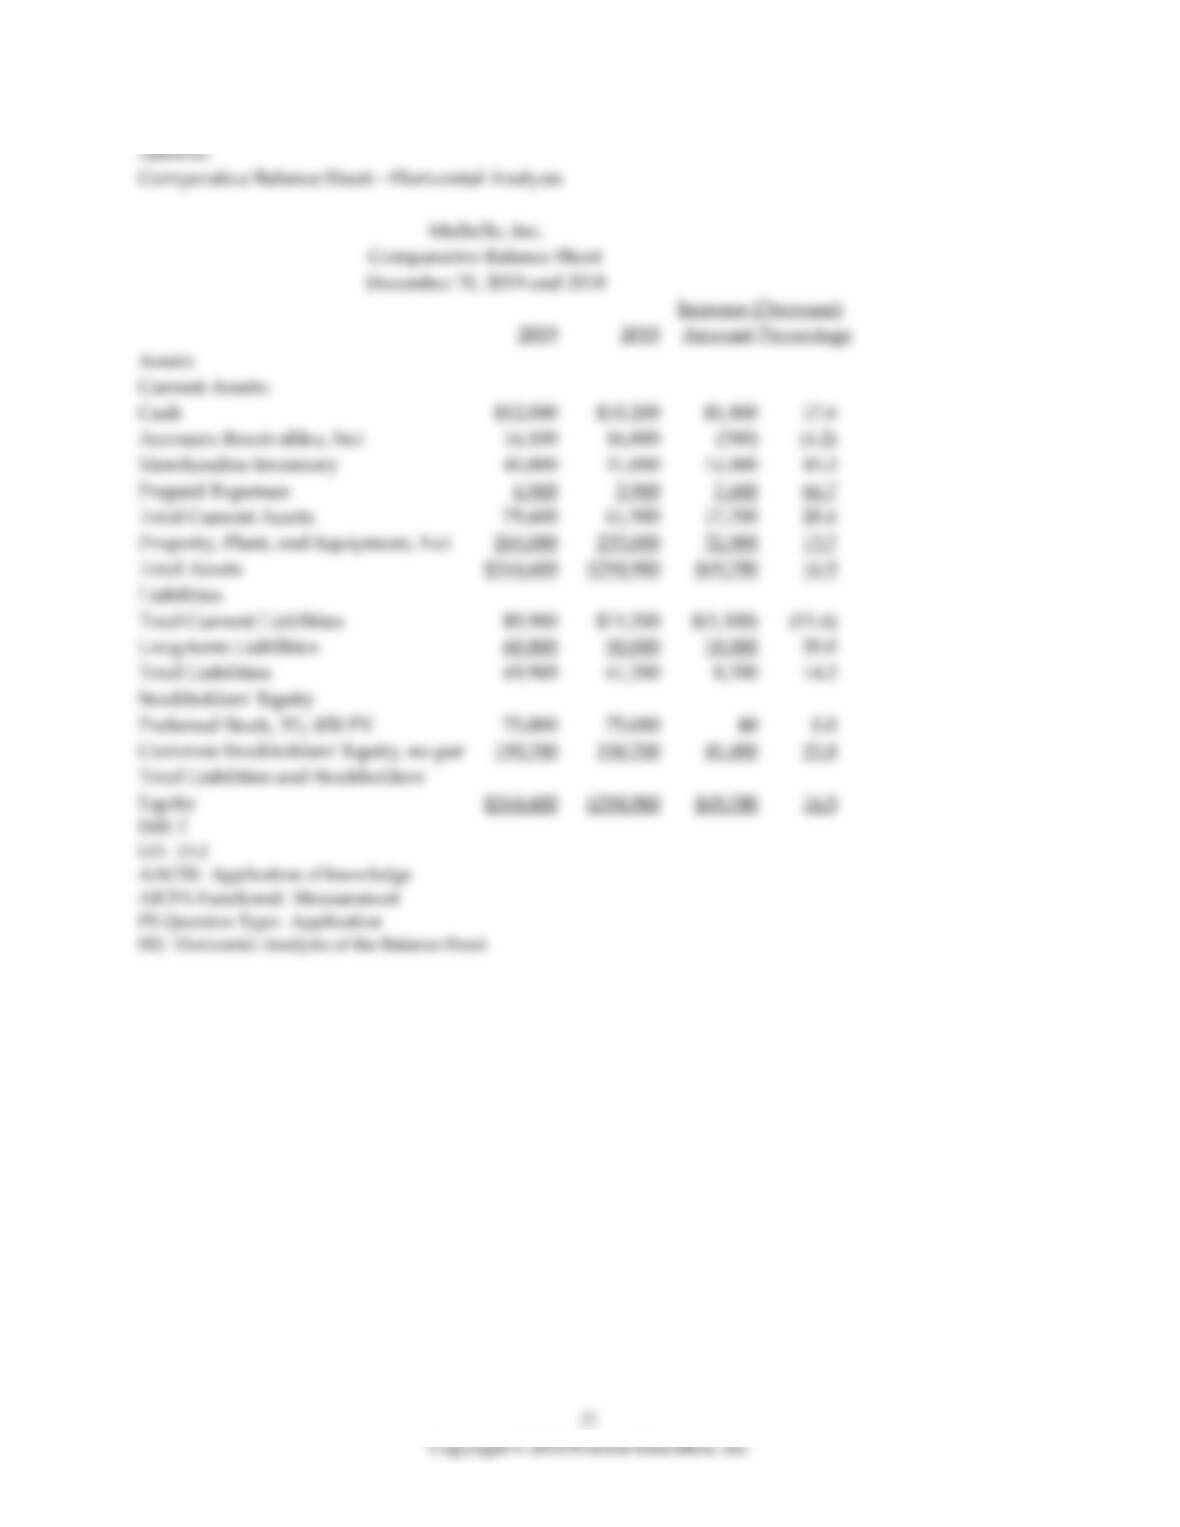
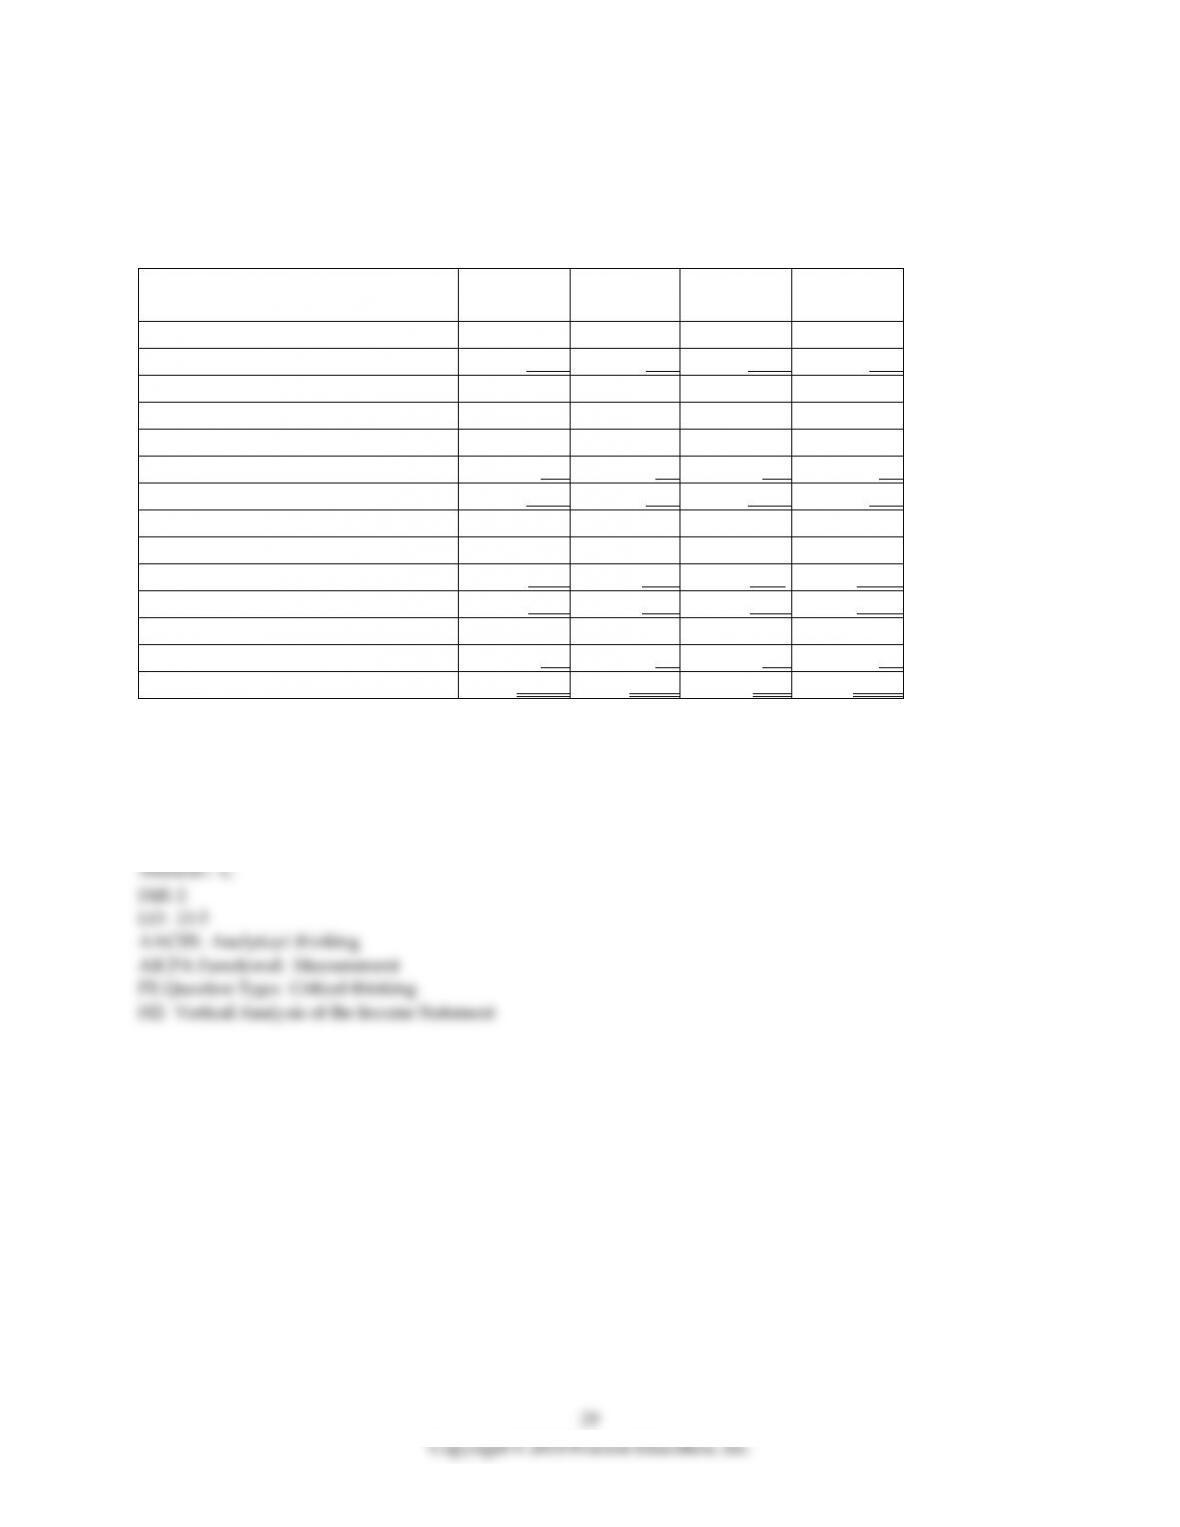
Answer:
Comparative Balance Sheet—Horizontal Analysis
Michelle, Inc.
Comparative Balance Sheet
December 31, 2019 and 2018
Increase (Decrease)
2019 2018 Amount Percentage
Assets
Current Assets:
Cash $12,000 $10,200 $1,800 17.6
Accounts Receivables, Net 16,100 16,800 (700) (4.2)
Merchandise Inventory 45,000 31,000 14,000 45.2
Prepaid Expenses 6,500 3,900 2,600 66.7
Total Current Assets 79,600 61,900 17,700 28.6
Property, Plant, and Equipment, Net 265,000 233,000 32,000 13.7
Total Assets $344,600 $294,900 $49,700 16.9
Liabilities
Total Current Liabilities $9,900 $11,200 $(1,300) (11.6)
Long-term Liabilities 60,000 50,000 10,000 20.0
Total Liabilities 69,900 61,200 8,700 14.2
Stockholders’ Equity
Preferred Stock, 3%, $50 PV 75,000 75,000 $0 0.0
Common Stockholders‘ Equity, no par 199,700 158,700 41,000 25.8
Total Liabilities and Stockholders’
Equity $344,600 $294,900 $49,700 16.9
Diff: 3
LO: 15-2
AACSB: Application of knowledge
AICPA Functional: Measurement
PE Question Type: Application
H2: Horizontal Analysis of the Balance Sheet
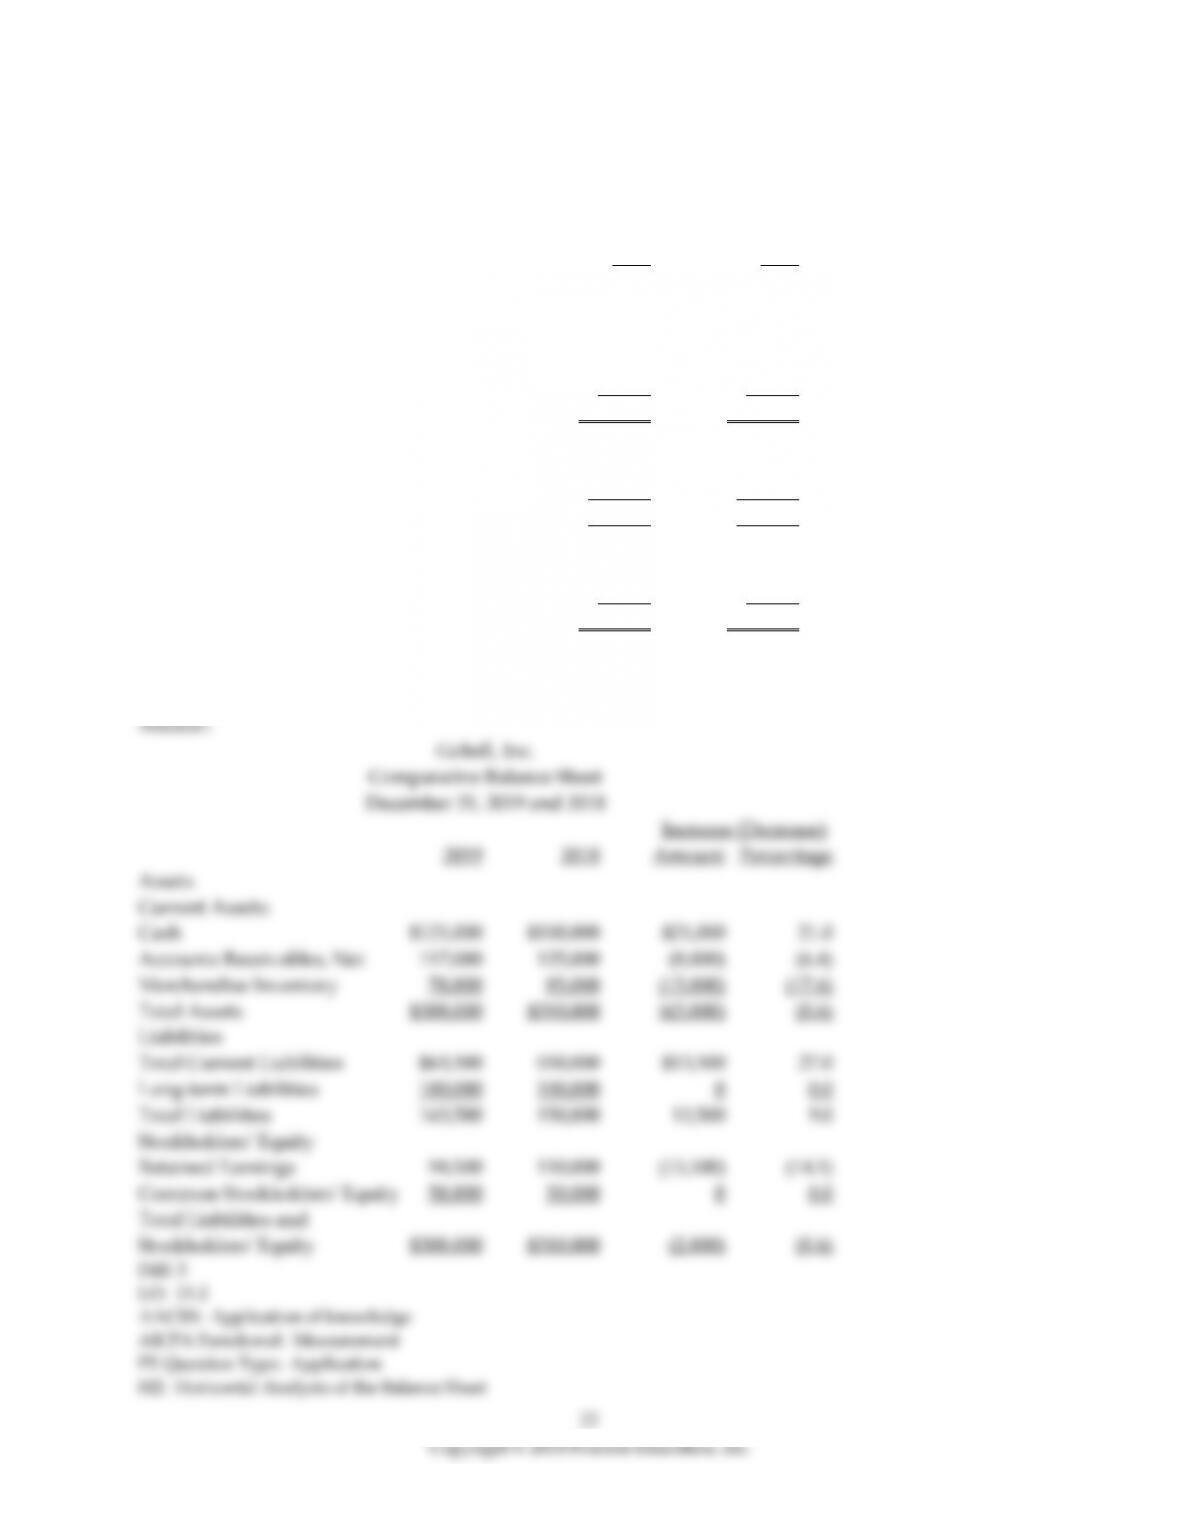
20) Data for Gobell, Inc. follow:
Gobell, Inc.
Comparative Balance Sheet
December 31, 2019 and 2018
2019 2018
Assets
Current Assets:
Cash $121,000 $100,000
Accounts Receivables, Net 117,000 125,000
Merchandise Inventory 70,000 85,000
Total Assets $308,000 $310,000
Liabilities
Total Current Liabilities $63,500 $50,000
Long-term Liabilities 100,000 100,000
Total Liabilities 163,500 150,000
Stockholders’ Equity
Retained Earnings 94,500 110,000
Common Stockholders‘ Equity 50,000 50,000
Total Liabilities and Stockholders’ Equity $308,000 $310,000
Prepare a horizontal analysis of the comparative balance sheet of Gobell, Inc. (Round to one decimal
place.)
21) Trend analysis is a form of horizontal analysis.
22) A trend analysis would be used if an analyst wants to see how the gross profit of a company has
changed from one year to the next.
23) A horizontal analysis would be used if an analyst wants to see how the assets of a company have
changed from one year to the next.
24) Which of the following best describes trend analysis?
A) calculating key ratios to evaluate performance
B) expressing each financial statement amount as a percentage of a budgeted amount
C) comparing a company’s financial statements with that of other companies
D) expressing each year’s financial statement line item as a percentage of the base year amount
25) The trend analysis report of Poplar, Inc. is given below (in millions):
2019
2018
2017
2016
2015
Net income
$700
$606
$459
$406
$400
Trend percentages
175%
152%
115%
102%
100%
Which of the following is a correct conclusion from the above analysis?
A) Net income for 2019 is 175% of net income for 2015.
B) Net income for 2018 is 152% of the previous year.
C) Net income for 2018 decreased by 152% from 2017.
D) Net income for 2019 increased by 175% from 2018.
26) The trend analysis report of Marswell, Inc. is given below (in millions):
2019
2018
2017
2016
2015
Net income
$700
$605
$456
$407
$400
Trend percentages
175%
151%
114%
102%
100%
Which of the following is a correct conclusion from the above analysis?
A) Net income for 2017 has increased by 114% over that for 2015.
B) Net income for 2017 has decreased by 14% over that for 2015.
C) Net income for 2017 has decreased by 114% over that for 2015.
D) Net income for 2017 has increased by 14% over that for 2015.
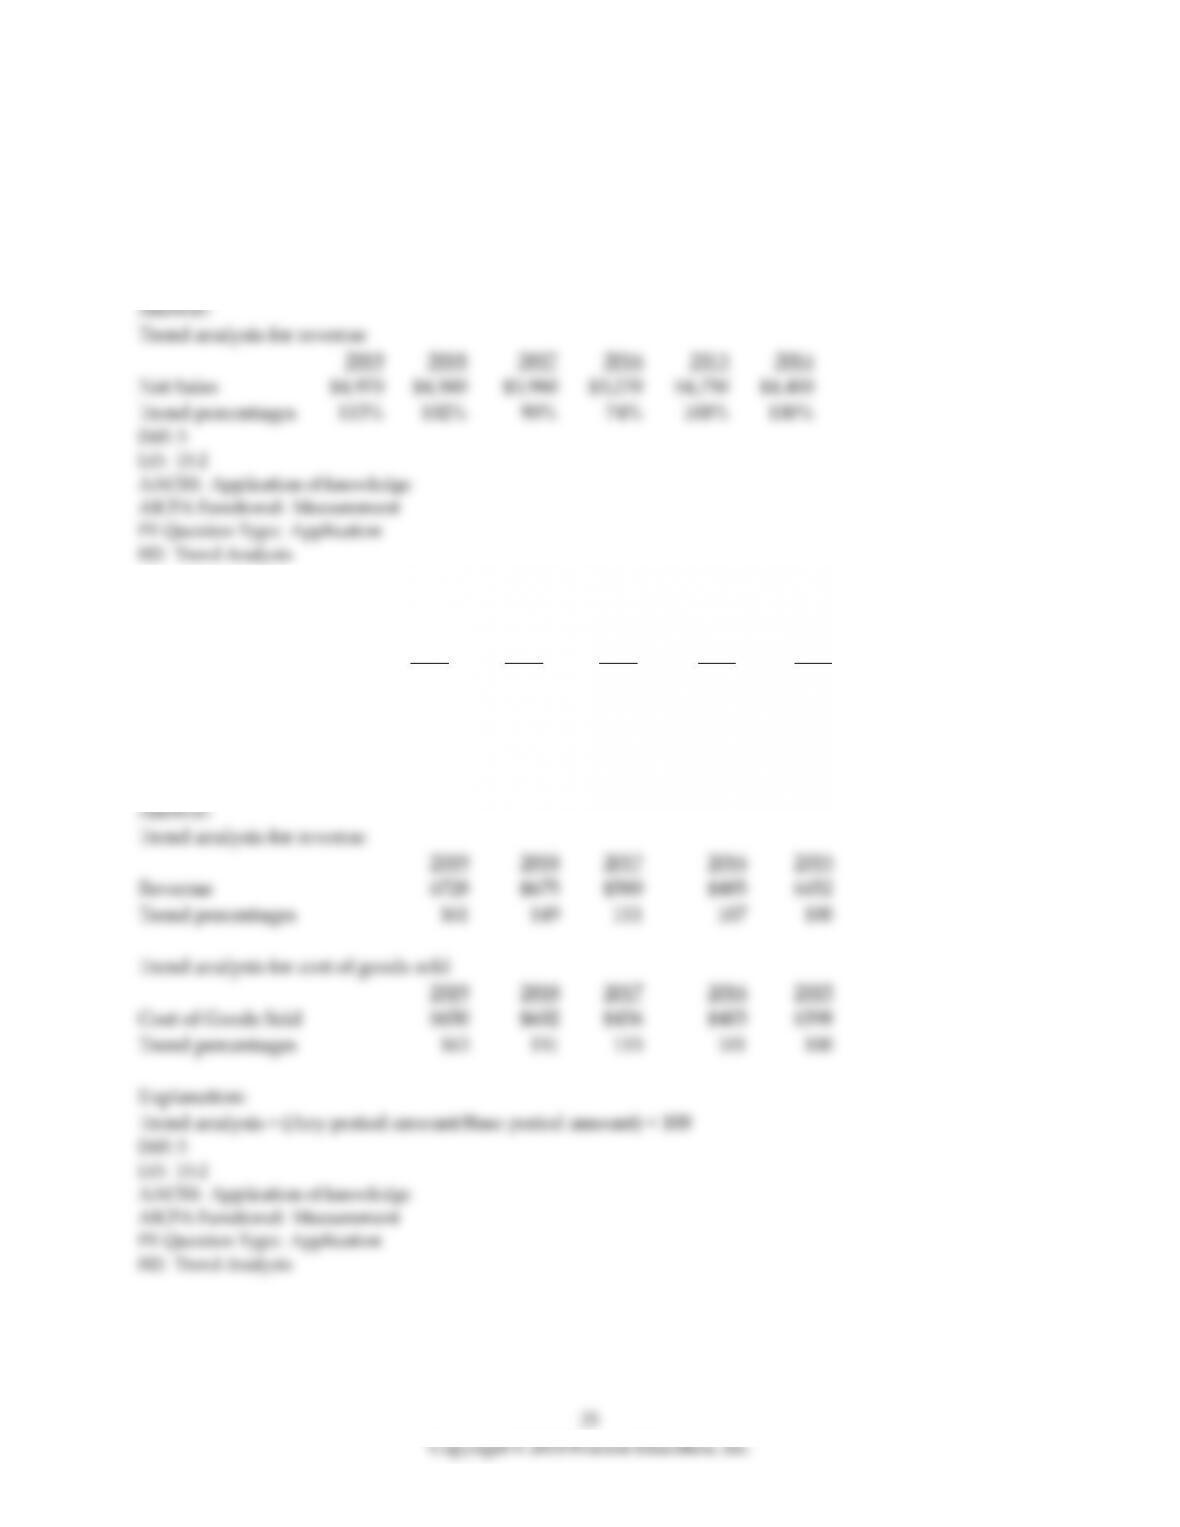
27) Beary, Inc. provides the following historical data:
2019 2018 2017 2016 2015 2014
Net sales $4,970 $4,500 $3,980 $3,270 $4,750 $4,400
Prepare the trend analysis report. Use 2014 as the base year, and round answers to the nearest percent.
28) Sapphire Corp. reported the following revenues and net income amounts.
2019 2018 2017 2016 2015
Revenue $728 $675 $500 $485 $452
Cost of goods sold 650 602 456 403 398
Calculate Sapphire‘s trend analysis for revenues and cost of goods sold. Use 2015 as the base year, and
round to the nearest percent.
26
Copyright © 2018 Pearson Education, Inc.
Learning Objective 15-3
1) A vertical analysis of a financial statement reveals the relationship of each statement item to its base
amount, which is the 100% figure.
2) A vertical analysis percent is computed by dividing the base amount by the specific item and then
multiplying by 100.
3) In a vertical analysis of the income statement, each line item is shown as a percentage of net sales
revenue.
4) In a vertical analysis of the balance sheet, each line item is shown as a percentage of stockholders’
equity.
5) Vertical analysis involves comparing an amount for a line item in the financial statements with a
corresponding amount for the line item of the previous year.
6) When performing vertical analysis of an income statement, the base amount is ________.
A) total expenses
B) net sales revenue
C) sales revenue
D) gross profit
7) When performing vertical analysis of a balance sheet, the base amount is ________.
A) total assets
B) total cash and cash equivalents
C) net income
D) gross profit
8) Which of the following is used to see how a company’s operating expenses, as a percentage of net sales,
have changed from one year to the next?
A) vertical analysis
B) horizontal analysis
C) ratio analysis
D) analysis of internal control system
9) In a vertical analysis of the income statement, each line item is shown as a percentage of net income.
10) Martin Company’s cost of goods sold is 40% of net sales revenue. This means that for every $1 of net
sales revenue, Martin has $0.60 of gross profit.
11) In 2018, Spirit Company’s net income was 10% of net sales revenue. In 2019, the net income was 5% of
net sales revenue. There is no need for investors to be alarmed because a drop from 10% to 5% is not
significant.
12) The vertical analysis of the income statement of Bates, Inc. is as shown below:
Bates, Inc.
Comparative Income Statement
Years Ended December 31, 2019 and 2018
(In millions)
2019
Percent of
Total
2018
Percent of
Total
Net Sales
$6,355
100.0%
$4,920
100.0%
Cost of Goods Sold
3,370
53.0
2,200
44.7
Gross Profit
2,985
47.0
2,720
55.3
Operating Expenses:
Selling Expenses
675
10.6
580
11.8
Administrative Expenses
410
6.5
425
8.6
Total Operating Expenses
1,085
17.1
1,005
20.4
Operating Income
1,900
29.9
1,715
34.9
Other Income and (Expenses):
Interest Expense
(400)
(6.3)
(695)
(14.1)
Total Other Income and (Expenses)
(400)
(6.3)
(695)
(14.1)
Income Before Income Taxes
1,500
23.6
1,020
20.7
Income Tax Expense
230
3.6
210
4.3
Net Income
$1,270
20.0%
$810
16.5%
The figure 47.0% shown for gross profit in 2019 signifies that the gross profit is ________.
A) equal to 47.0% of net income
B) increased by 47.0% over the previous year
C) 47.0% of net sales revenue
D) 47.0% of cost of goods sold

13) The vertical analysis of the income statement of Settler, Inc. is as shown below:
Settler, Inc.
Comparative Income Statement
Years Ended December 31, 2019 and 2018
(In millions)
2019
Percent of
Total
2018
Percent of
Total
Net Sales
$6,355
100.0%
$4,920
100.0%
Cost of Goods Sold
3,370
53.0
2,200
44.7
Gross Profit
2,985
47.0
2,720
55.3
Operating Expenses:
Selling Expenses
675
10.6
580
11.8
Administrative Expenses
410
6.5
425
8.6
Total Operating Expenses
1,085
17.1
1,005
20.4
Operating Income
1,900
29.9
1,715
34.9
Other Income and (Expenses):
Interest Expense
(400)
(6.3)
(695)
(14.1)
Total Other Income and (Expenses)
(400)
(6.3)
(695)
(14.1)
Income Before Income Taxes
1,500
23.6
1,020
20.7
Income Tax Expense
230
3.6
210
4.3
Net Income
$1,270
20.0%
$810
16.5%
The 20% shown for net income in 2019 signifies that net income ________.
A) is 20% of net sales revenues
B) increased by 20% over the previous year
C) is 20% of gross profit
D) equals 20 times of the income before income tax