8) The following is a summary of information presented on the financial statements of a company on
December 31, 2019.
Account
2019
2018
Net Sales Revenue
$600,000
$504,000
Cost of Goods Sold
456,000
405,000
Gross Profit
$144,000
$99,000
Selling Expenses
51,000
54,000
Net Income Before Income Tax Expense
$93,000
$45,000
Income Tax Expense
39,000
23,000
Net Income
$54,000
$22,000
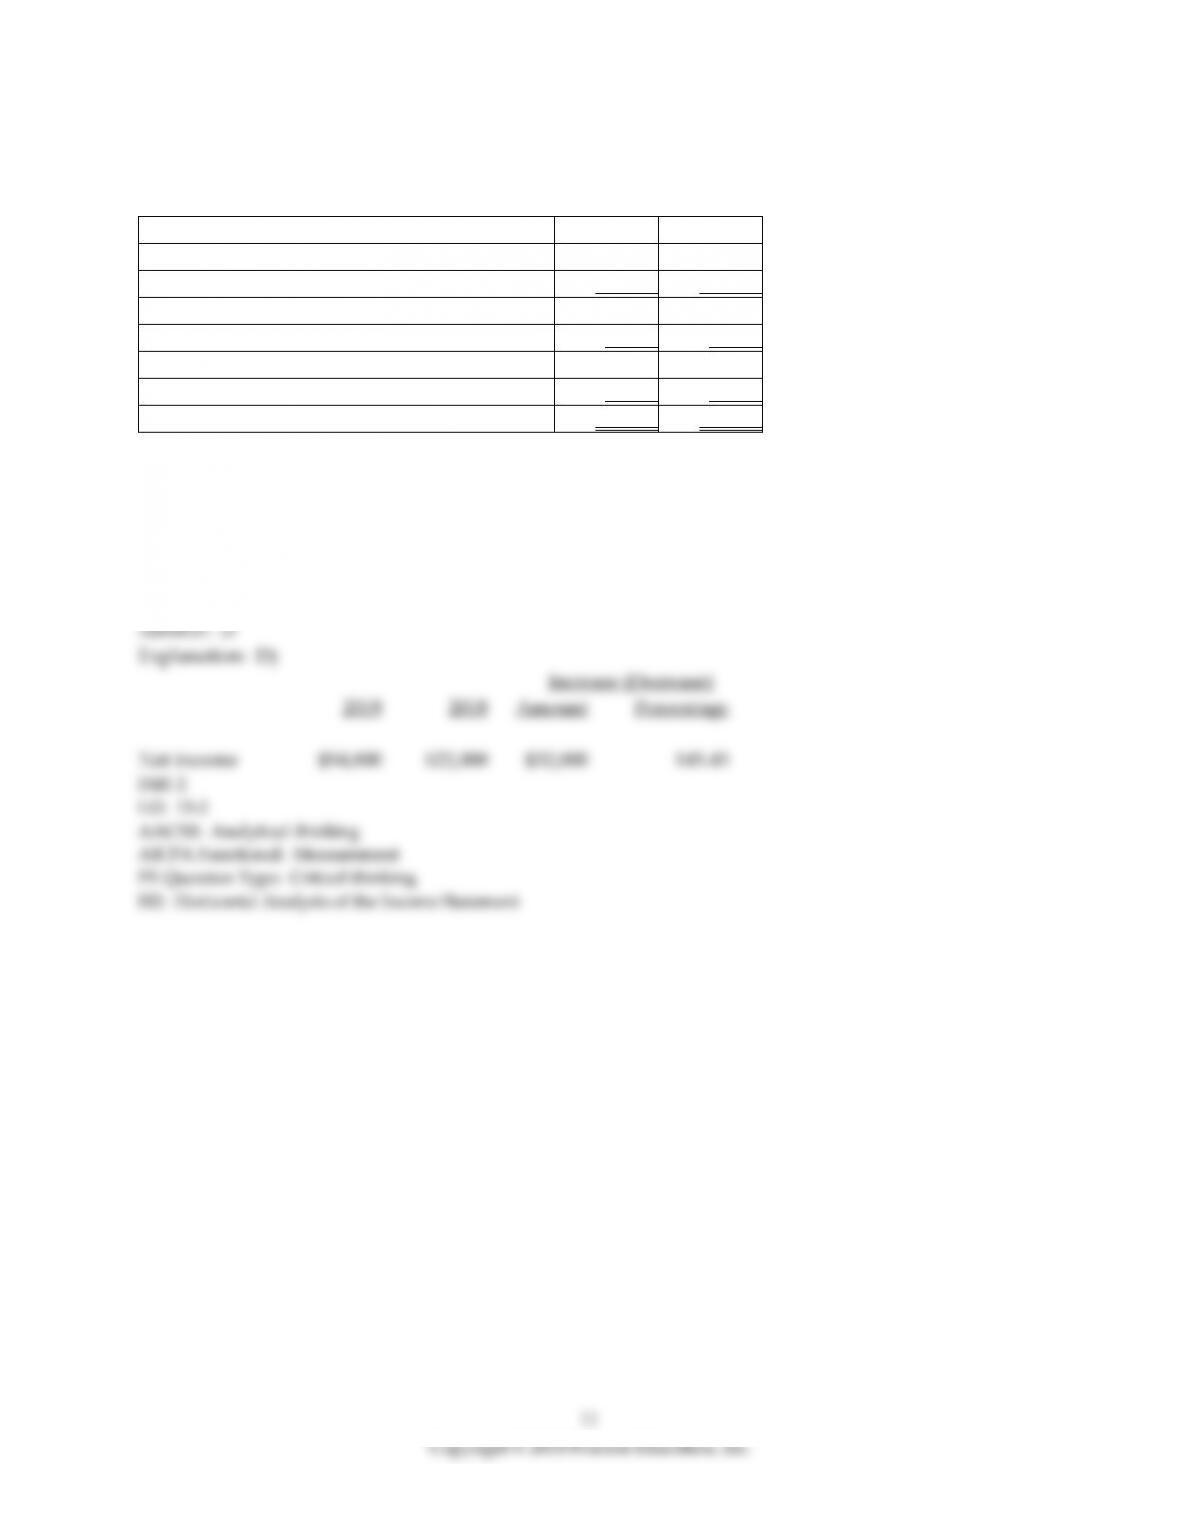
With respect to net income, a horizontal analysis reveals ________. (Round your answer to two decimal
places.)
A) that net income is 14.55% of net sales revenue
B) a $22,000 increase in net income
C) a 145.45% decrease in net income
D) a 145.45% increase in net income
9) The following is a summary of information presented on the financial statements of a company on
December 31, 2019.
Account
2019
2018
Net Sales Revenue
$607,000
$502,000
Cost of Goods Sold
450,000
406,000
Gross Profit
157,000
96,000
Selling Expenses
54,000
52,000
Net Income Before Income Tax Expense
103,000
44,000
Income Tax Expense
38,000
24,000
Net Income
$65,000
$20,000
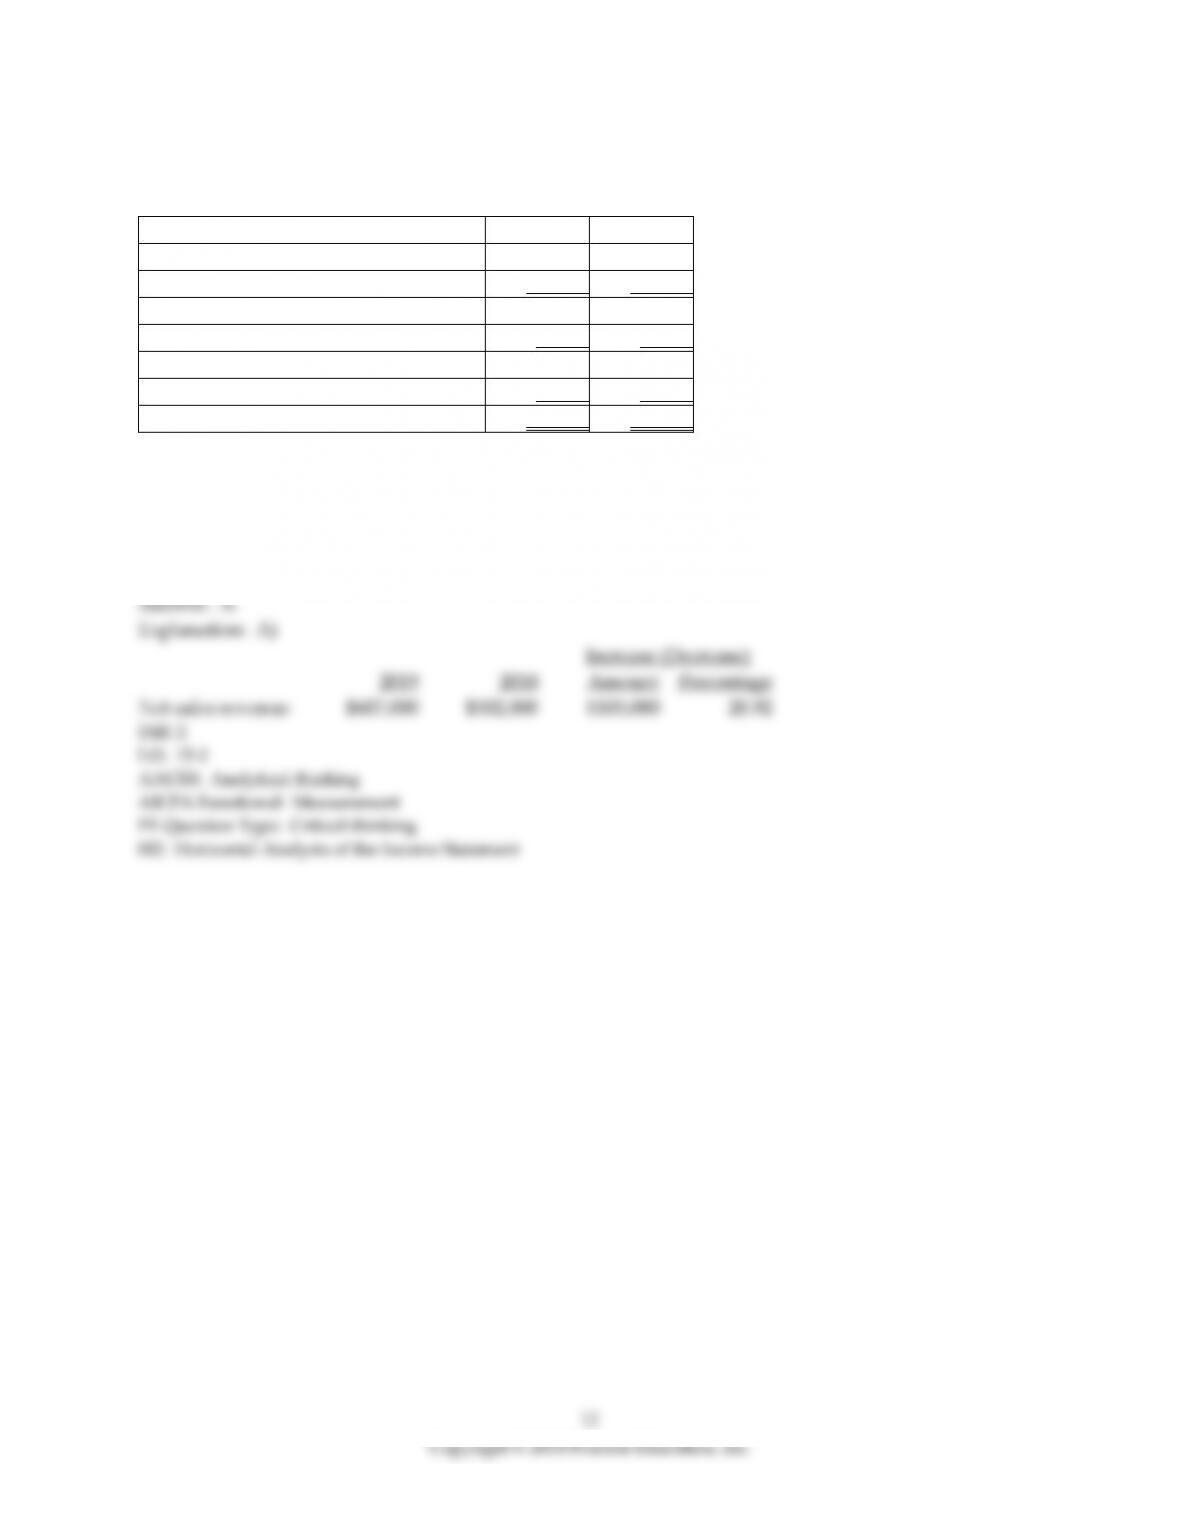
With respect to net sales revenue, a horizontal analysis reveals ________.
A) a 20.92% increase in net sales revenue
B) a 240.62% decrease in net sales revenue
C) a decrease of $44,000 in net sales revenue
D) a $44,000 increase in net sales revenue
10) MacMan, Inc. reported the following data:
2019
2018
Amount
Percentage
Revenues
$6370
$4940
$1430
28.95%
Cost of goods sold
3450
2200
1250
56.82%
Gross profit
2920
2740
180
6.57%
Operating expenses:
Sales and marketing expense
710
630
80
12.7%
General and administrative
expenses
410
425
-15
-3.53%
Research and development
expense
480
490
-10
-2.04%
Other expense
440
710
(270)
(38.03)%
Total operating expenses
2040
2255
(215)
(9.53)%
Income before income tax
880
485
395
81.44%
Income tax expense
260
240
$20
8.33%
Net income (loss)
$620
$245
$375
153.06%
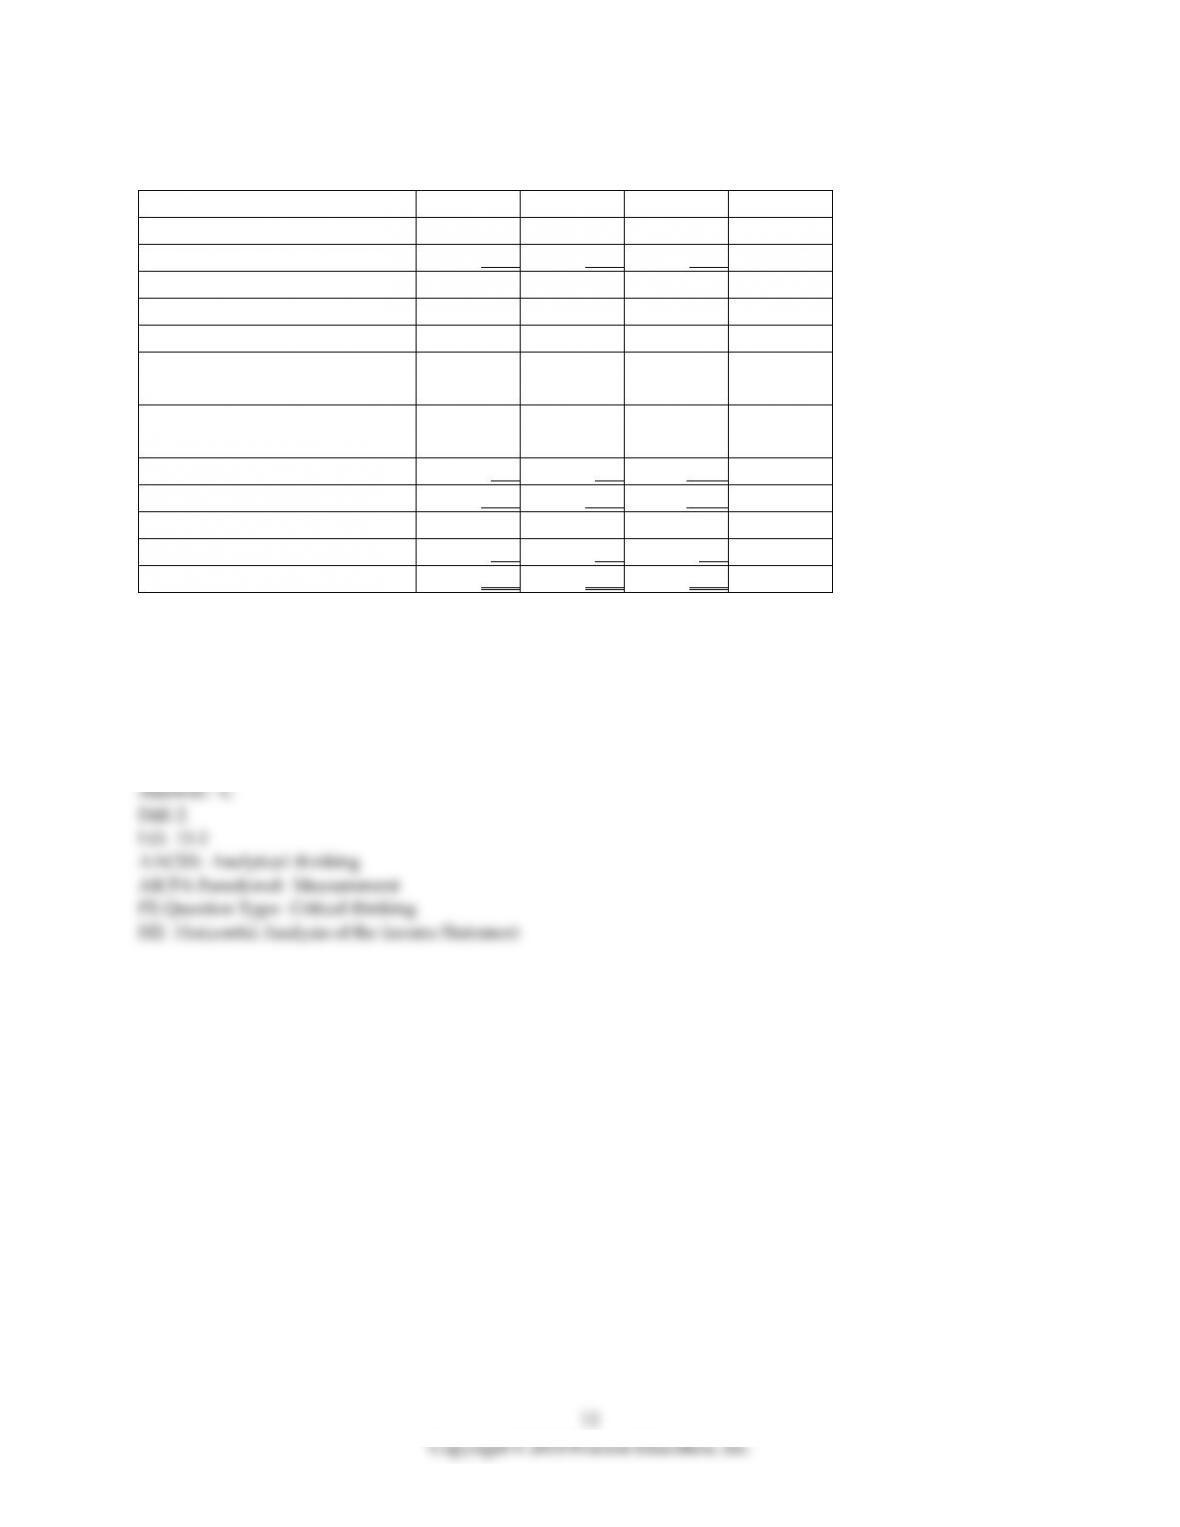
The horizontal analysis shows that cost of goods sold has ________. (Round your answer to two decimal
places.)
A) increased by 28.95%
B) decreased by 28.95%
C) increased by 56.82%
D) decreased by 56.82%
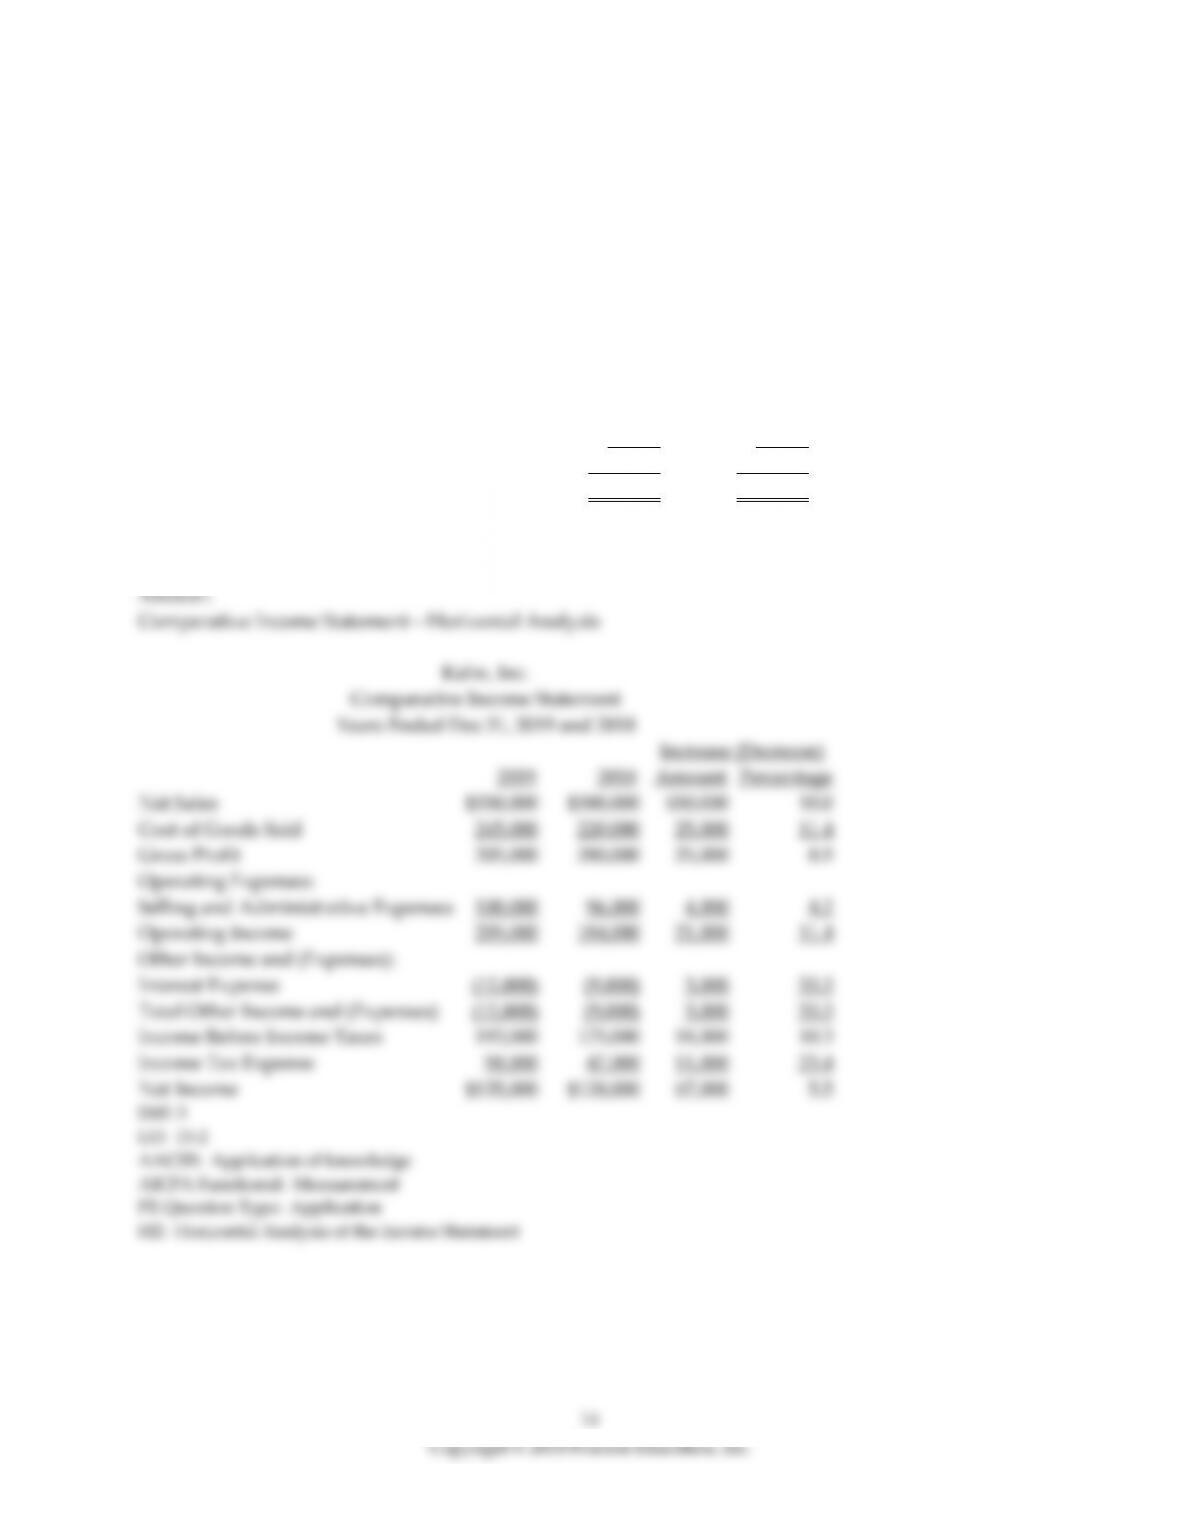
11) Data for Kahn, Inc. follows:
Kahn, Inc.
Comparative Income Statement
Years Ended Dec. 31, 2019 and 2018
2019 2018
Net Sales Revenue $550,000 $500,000
Expenses:
Cost of Goods Sold 245,000 220,000
Selling and Administrative Expenses 100,000 96,000
Other Expenses (Interest Expense) 12,000 9,000
Income Tax Expense 58,000 47,000
Total Expenses $415,000 $372,000
Net Income $135,000 $128,000
Prepare a horizontal analysis of the comparative income statement of Kahn, Inc. (Round to one decimal
place.) Use a multi-step format for the income statement.
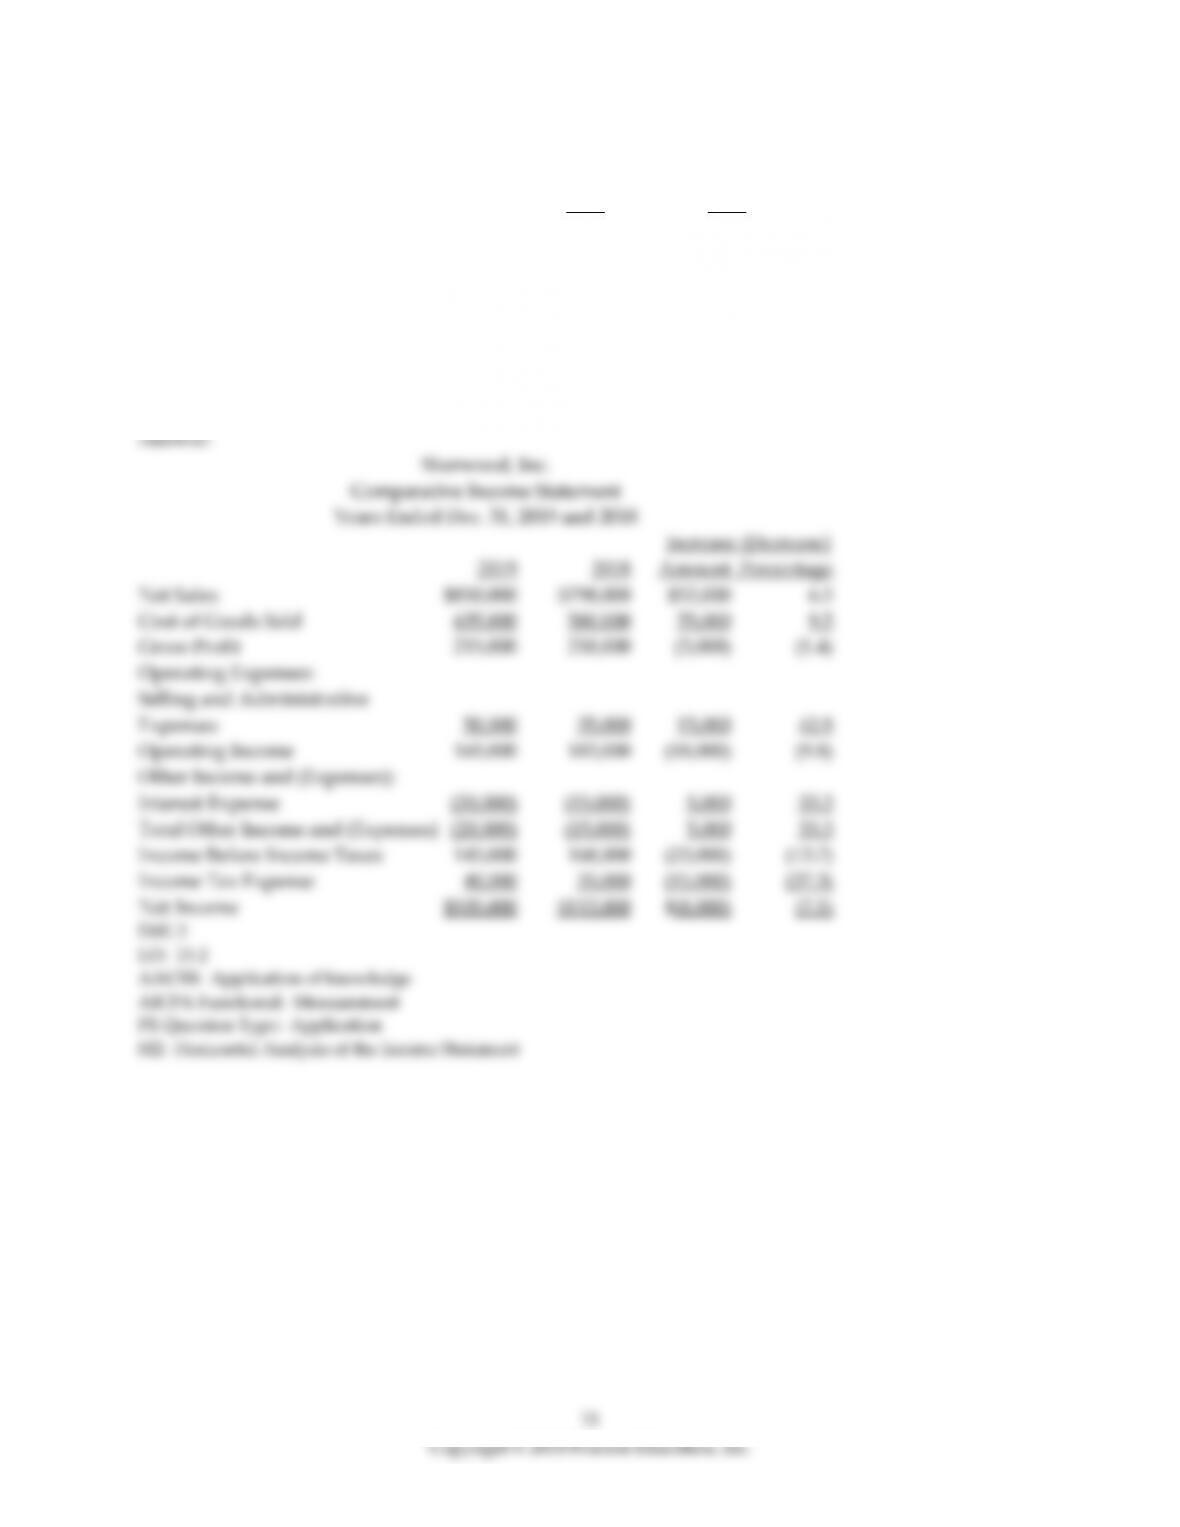
12) Data for Sherwood, Inc. for the years ended December 31, 2019 and 2018 are as follows:
2019 2018
Net Sales $850,000 $798,000
Cost of Goods Sold 635,000 580,000
Selling and Administrative Expenses 50,000 35,000
Other Expenses (Interest Expense) 20,000 15,000
Income Tax 40,000 55,000
Prepare a horizontal analysis of the comparative income statement of Sherman, Inc. (Round to one
decimal place.) Use a multi-step income statement.
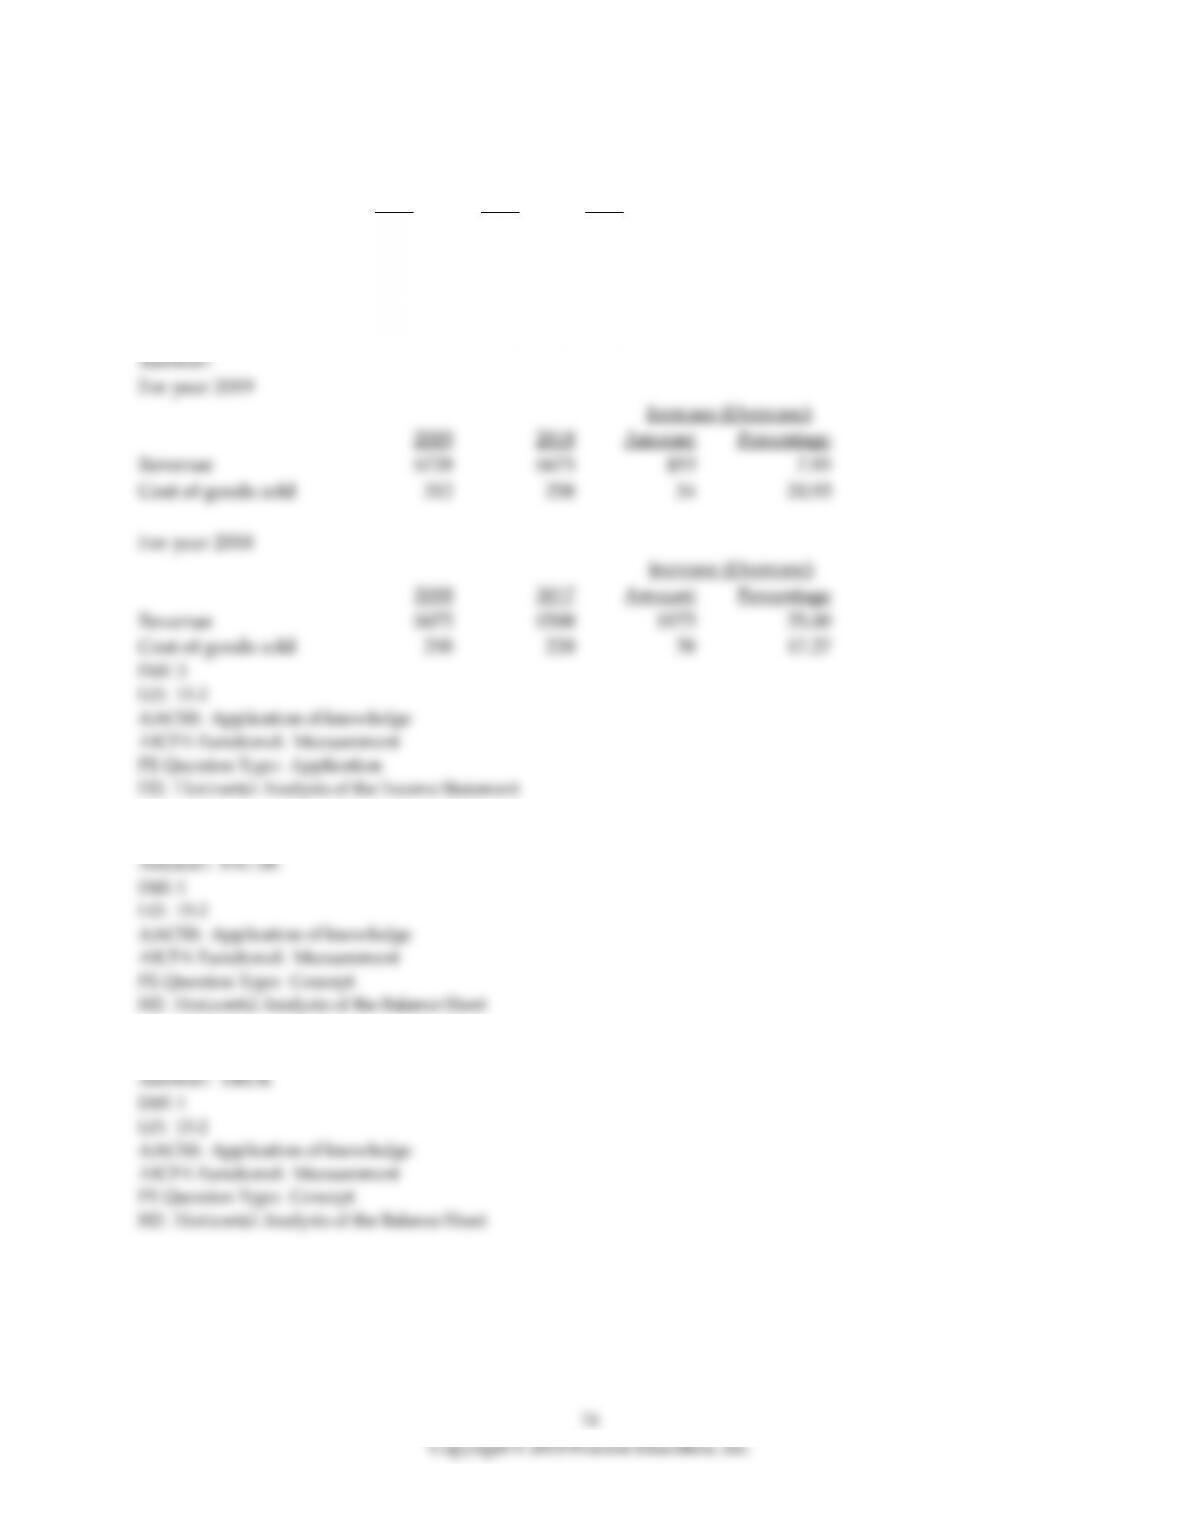
13) McDonald Corp. reported the following on its comparative income statement (in millions):
2019 2018 2017
Revenue $728 $675 $500
Cost of goods sold 312 258 220
Prepare a horizontal analysis of revenues and cost of goods sold, both in dollar amounts and in
percentages, for 2019 and 2018. (Round your percentage answers to two decimal places.)
14) The horizontal analysis of the balance sheet shows the changes in net sales and net income.
15) The horizontal analysis of the balance sheet is based on the comparative balance sheet.
16) The following is summary of information presented on the financial statements of a company on
December 31, 2019.
Account
2019
2018
Current Assets
$66,000
$50,000
Accounts Receivable
83,000
78,000
Merchandise Inventory
53,000
44,000
Current Liabilities
75,000
52,000
Long-term Liabilities
31,000
53,000
Common Stock
51,000
40,000
Retained Earnings
45,000
27,000
Net Sales Revenue
$527,000
$506,000
Cost of Goods Sold
400,000
401,000
Gross Profit
$127,000
$105,000
Selling Expenses
48,000
50,000
Net Income Before Income Tax Expense
$79,000
$55,000
Income Tax Expense
25,000
$17,000
Net Income
$54,000
$38,000
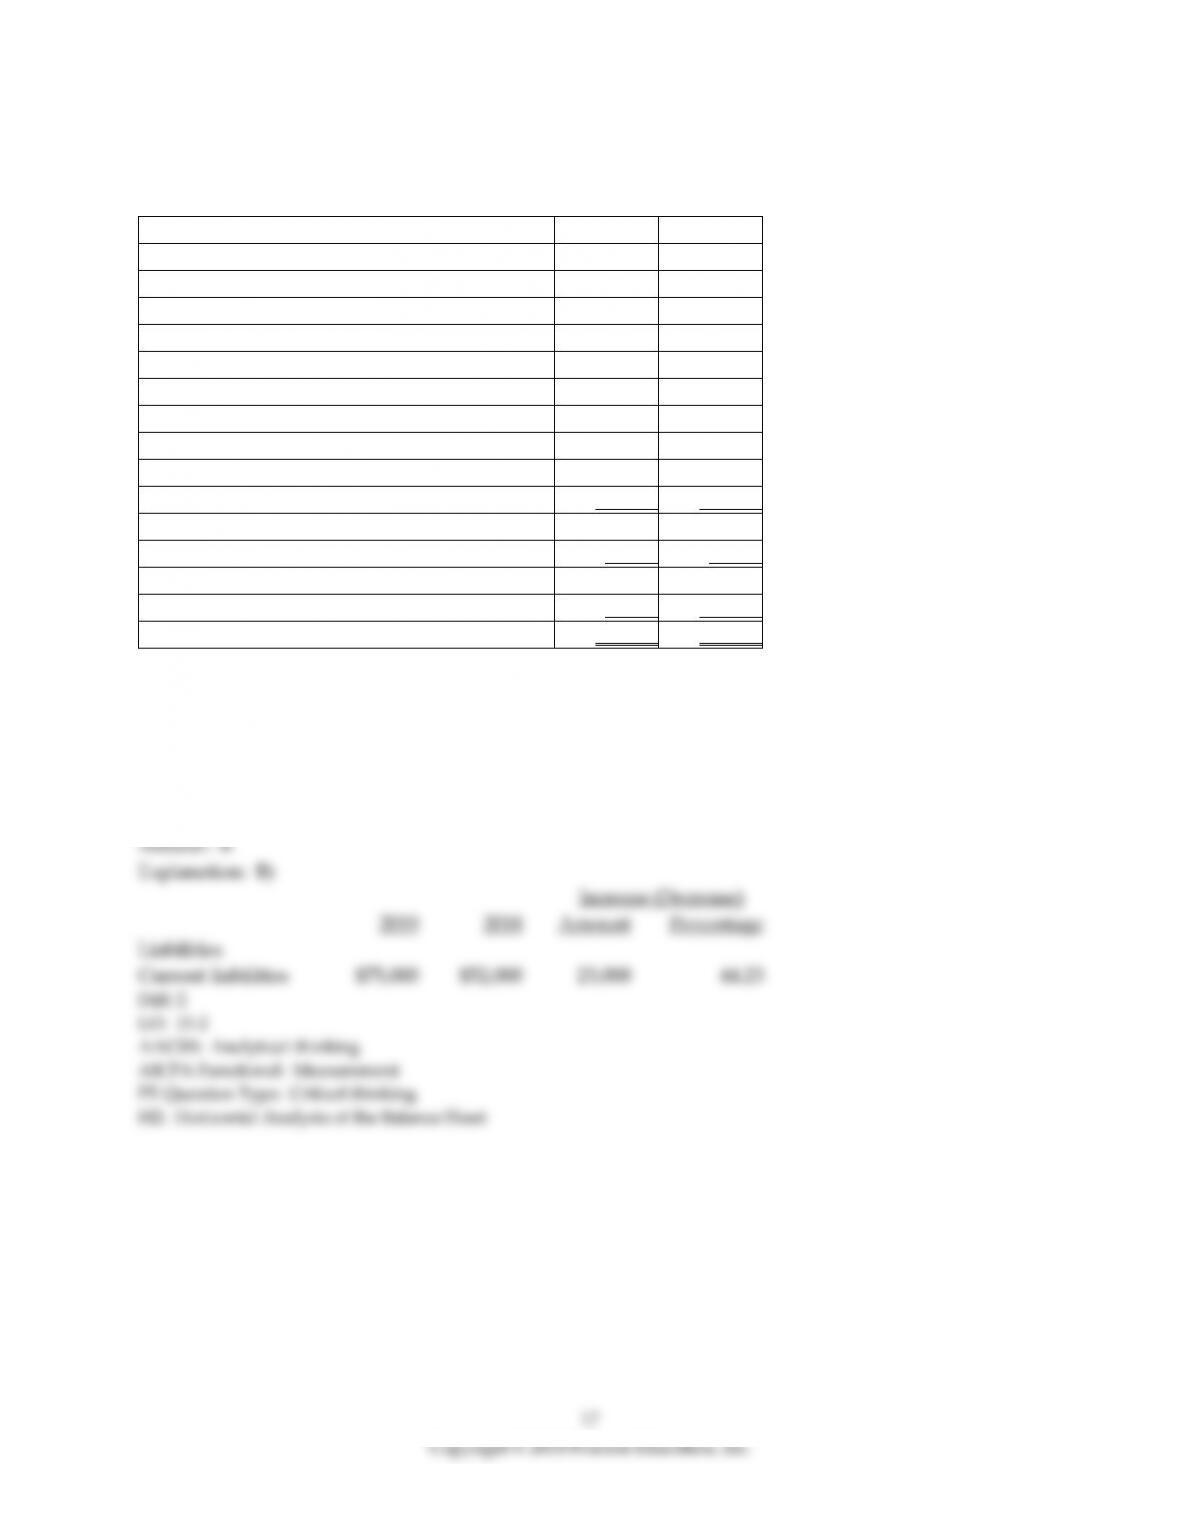
With respect to current liabilities, a horizontal analysis reveals ________. (Round your answer to two
decimal places.)
A) that current liabilities are 37.13% of total equity
B) a 44.23% increase in current liabilities
C) a current ratio of 0.88
D) a 30.67% increase in current liabilities
17) The following is a summary of information presented on the financial statements of a company on
December 31, 2019.
Account
2019
2018
Current Assets
$87,000
$73,000
Accounts Receivable
85,000
81,000
Merchandise Inventory
63,000
56,000
Current Liabilities
53,000
51,000
Long-term Liabilities
44,000
52,000
Common Stock
70,000
57,000
Retained Earnings
68,000
50,000
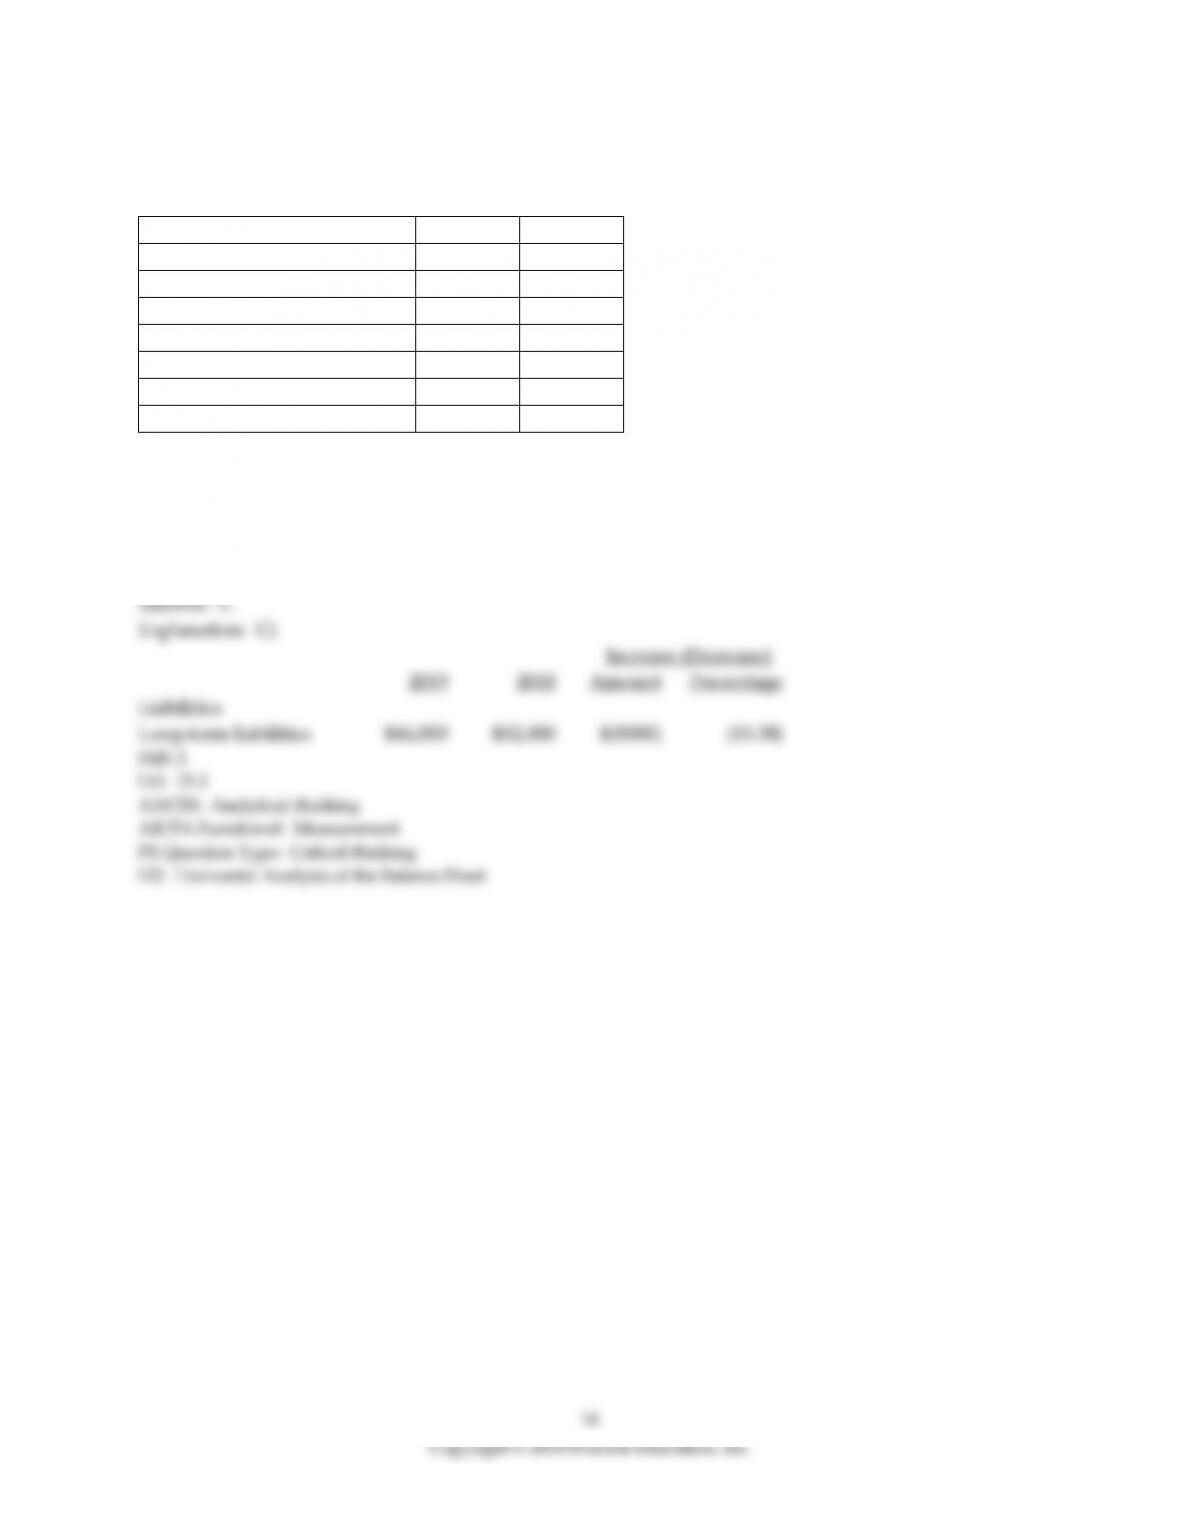
With respect to long-term liabilities, a horizontal analysis reveals ________.
A) long-term liabilities decreased by $13,000
B) long-term liabilities decreased by 22.81%
C) long-term liabilities decreased by 15.38%
D) long-term liabilities decreased by $2000
18) Night Owl, Inc. reported the following data:
Increase (Decrease)
(in millions)
2019
2018
Amount
Percentage
Assets
Current assets:
Cash
$10,000
$7,200
$2,800
38.9%
Accounts receivable, net
15,600
16,800
(1,200)
(7.1)%
Merchandise inventory
38,000
31,000
7,000
22.6%
Total current assets
63,600
55,000
8,600
15.6%
Property, plant and equipment, net
195,000
168,000
27,000
16.1%
Other long-term assets
15,000
27,100
(12,100)
(44.6%)
Total assets
$273,600
$250,100
$23,500
9.4%
Liabilities
Current liabilities:
Accounts payable
$8500
$7,300
$1,200
16.4%
Other current liabilities
1100
3900
(2800)
(71.8)%
Total current liabilities
9600
11,200
(1600)
(14.3)%
Long-term notes payable
54,700
30,100
24,600
81.7%
Total liabilities
$64,300
$41,300
$23,000
55.7%
Stockholders‘ Equity
Common stock
$12,000
$12,000
$0
0.0%
Paid-in capital in excess of par
149,000
149,000
0
0.0%
Retained earnings
48,300
47,800
500
1%
Total stockholders’ equity
209,300
208,800
500
0.2%
Total liabilities and stockholders’ equity
$273,600
$250,100
$23,500
9.4%
The horizontal analysis shows that the amount of total liabilities has __________.
A) increased by $23,000
B) increased by $2800
C) decreased by $2800
D) increased by $24,600

20
19) Data for Michelle, Inc. follow:
Michelle, Inc.
Comparative Balance Sheet
December 31, 2019 and 2018
2019 2018
Assets
Current Assets:
Cash $12,000 $10,200
Accounts Receivable, Net 16,100 16,800
Merchandise Inventory 45,000 31,000
Prepaid Expenses 6,500 3,900
Total Current Assets 79,600 61,900
Property, Plant, and Equipment, Net 265,000 233,000
Total Assets $344,600 $294,900
Liabilities
Total Current Liabilities $9,900 $11,200
Long-term Liabilities 60,000 50,000
Total Liabilities 69,900 61,200
Stockholders’ Equity
Preferred Stock, 3%, $50 par 75,000 75,000
Common Stockholders‘ Equity, no par 199,700 158,700
Total Liabilities and Stockholders’ Equity $344,600 $294,900
Prepare a horizontal analysis of the comparative balance sheet of Michelle, Inc. (Round to one decimal
place.)