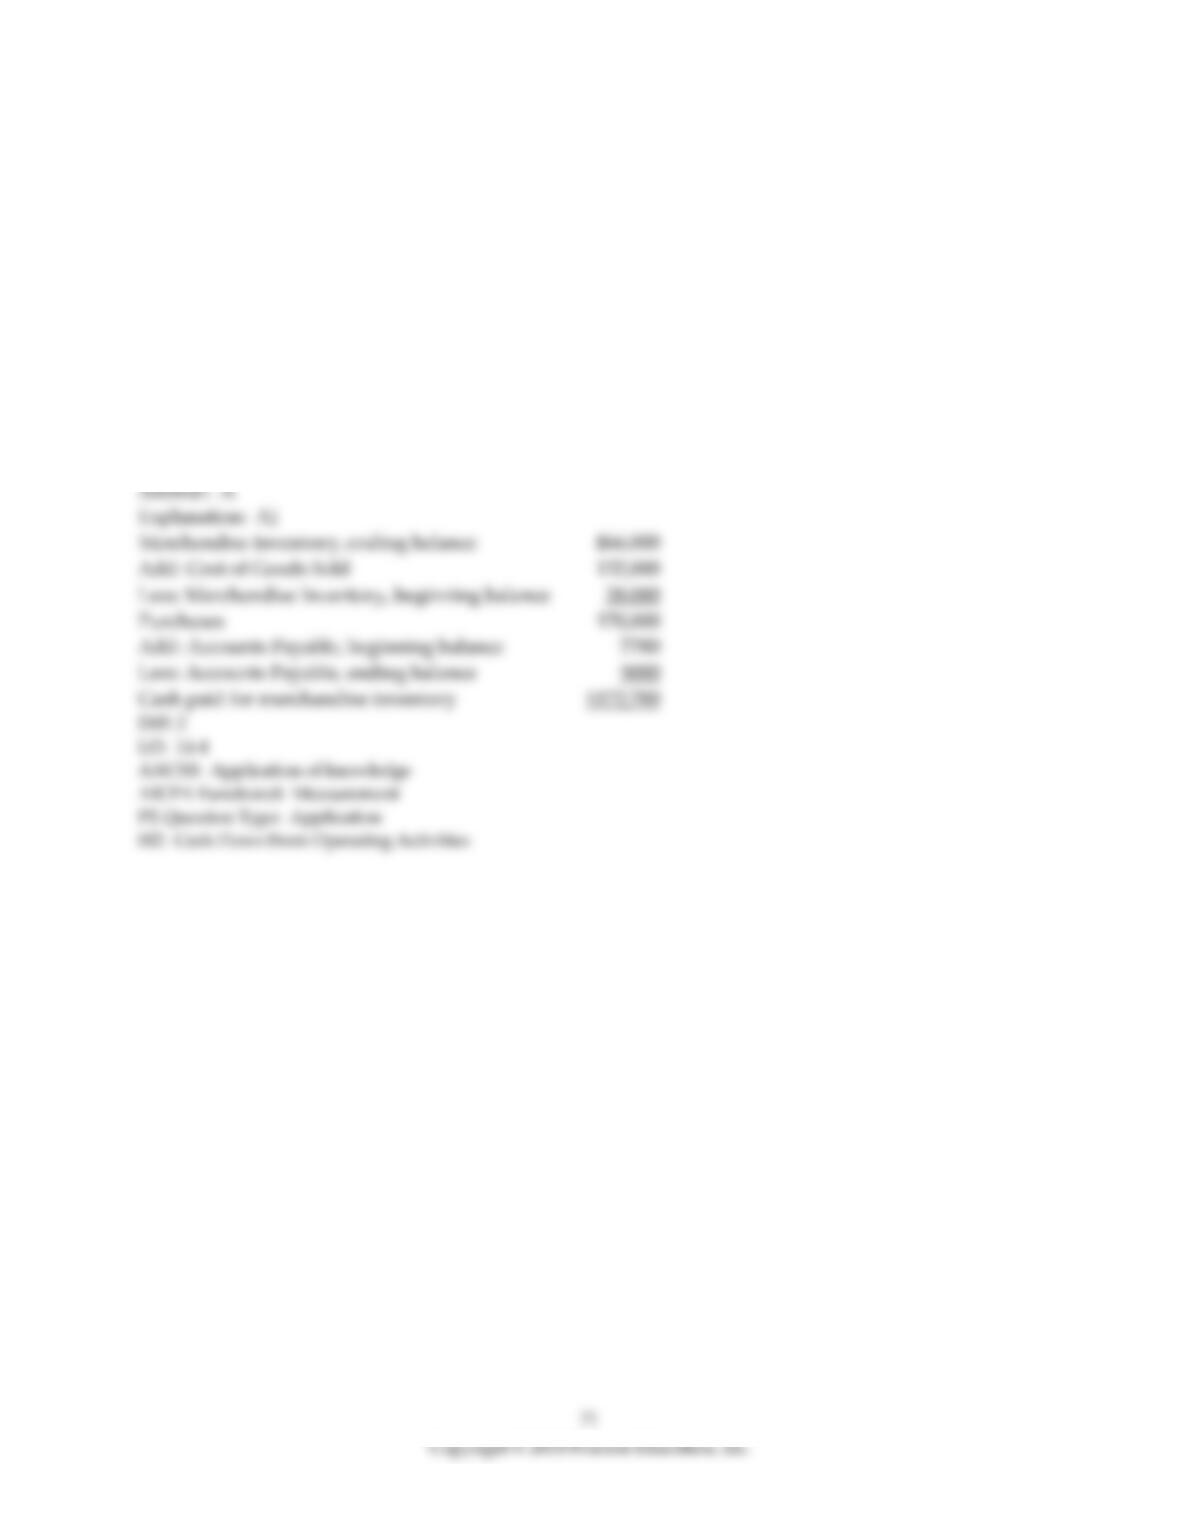
15) Arena, Inc. uses the direct method to prepare its statement of cash flows. Use the following
information reported for 2019 to compute the amount of cash paid for merchandise inventory.
Cost of Goods Sold, $132,000
Merchandise Inventory, beginning balance, $28,000
Merchandise Inventory, ending balance, $66,000
Accounts Payable, beginning balance, $7700
Accounts Payable, ending balance, $5000
A) $172,700
B) $94,000
C) $170,000
D) $167,300
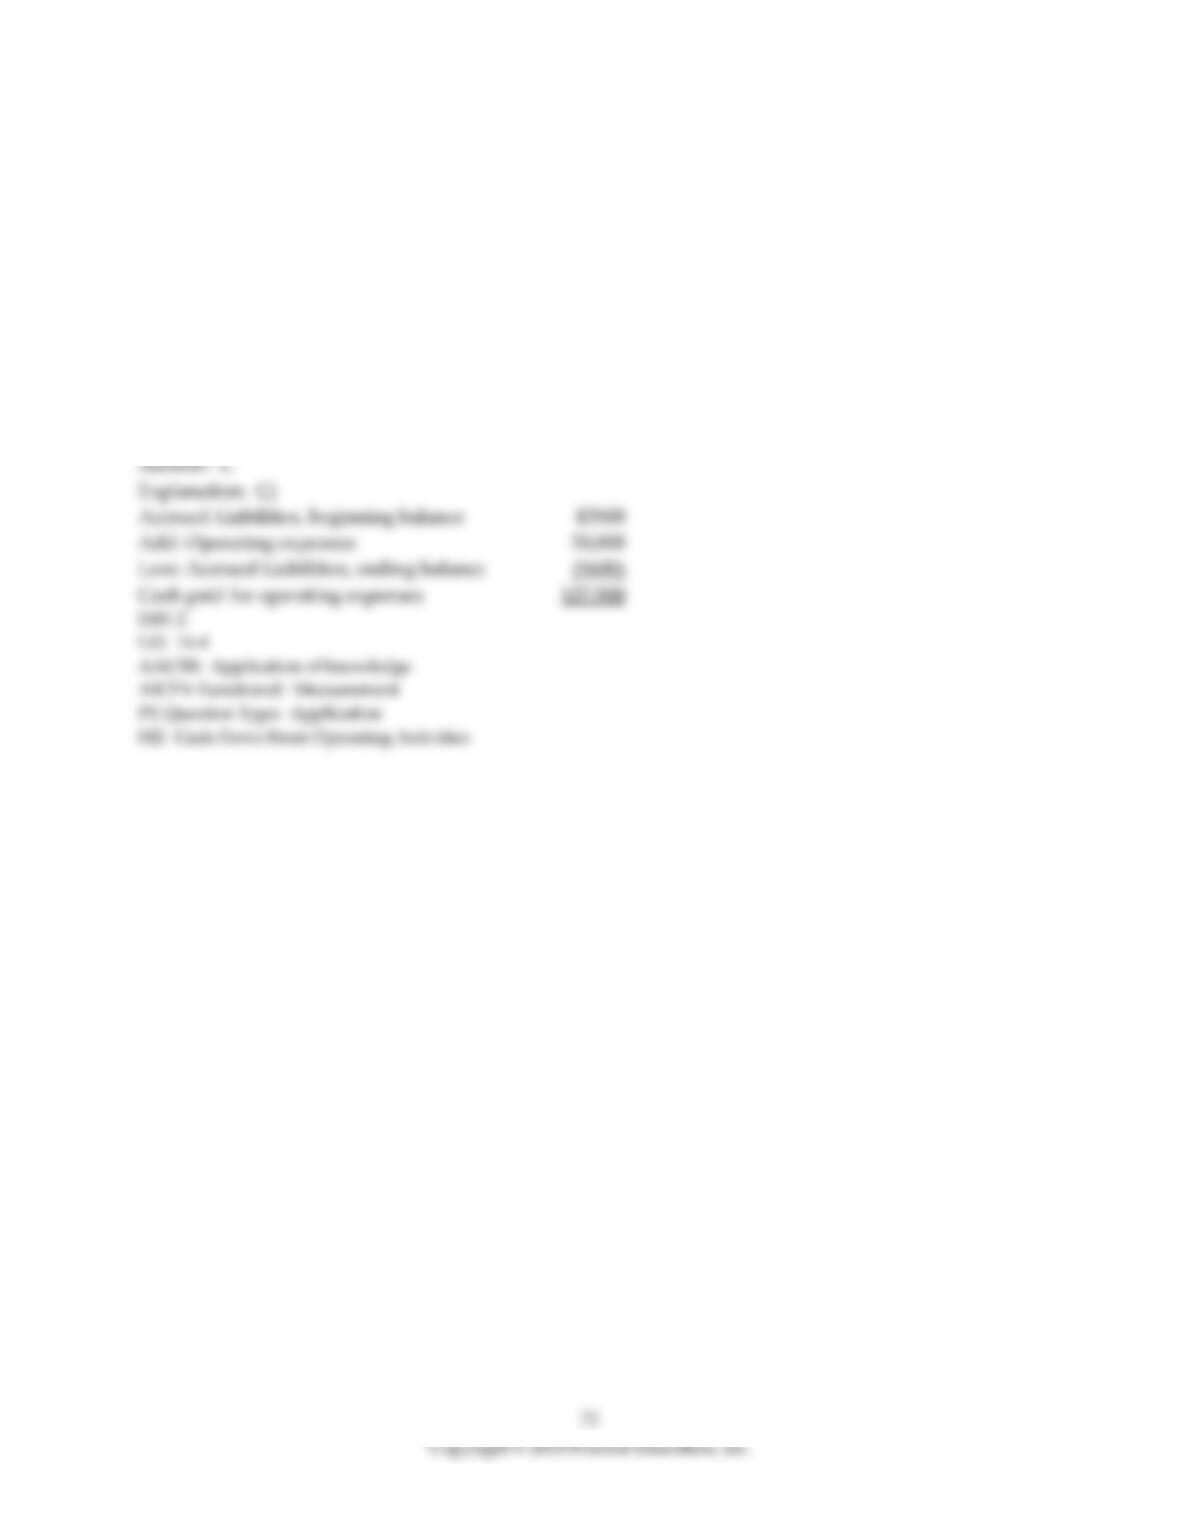
16) Nature Metals Company uses the direct method to prepare its statement of cash flows. Use the
following information reported for the year 2018 to compute the cash paid to suppliers for operating
expenses.
Operating expenses, $30,000
Accrued Liabilities, beginning balance, $3500
Accrued Liabilities, ending balance, $5600
A) $33,500
B) $32,100
C) $27,900
D) $35,600
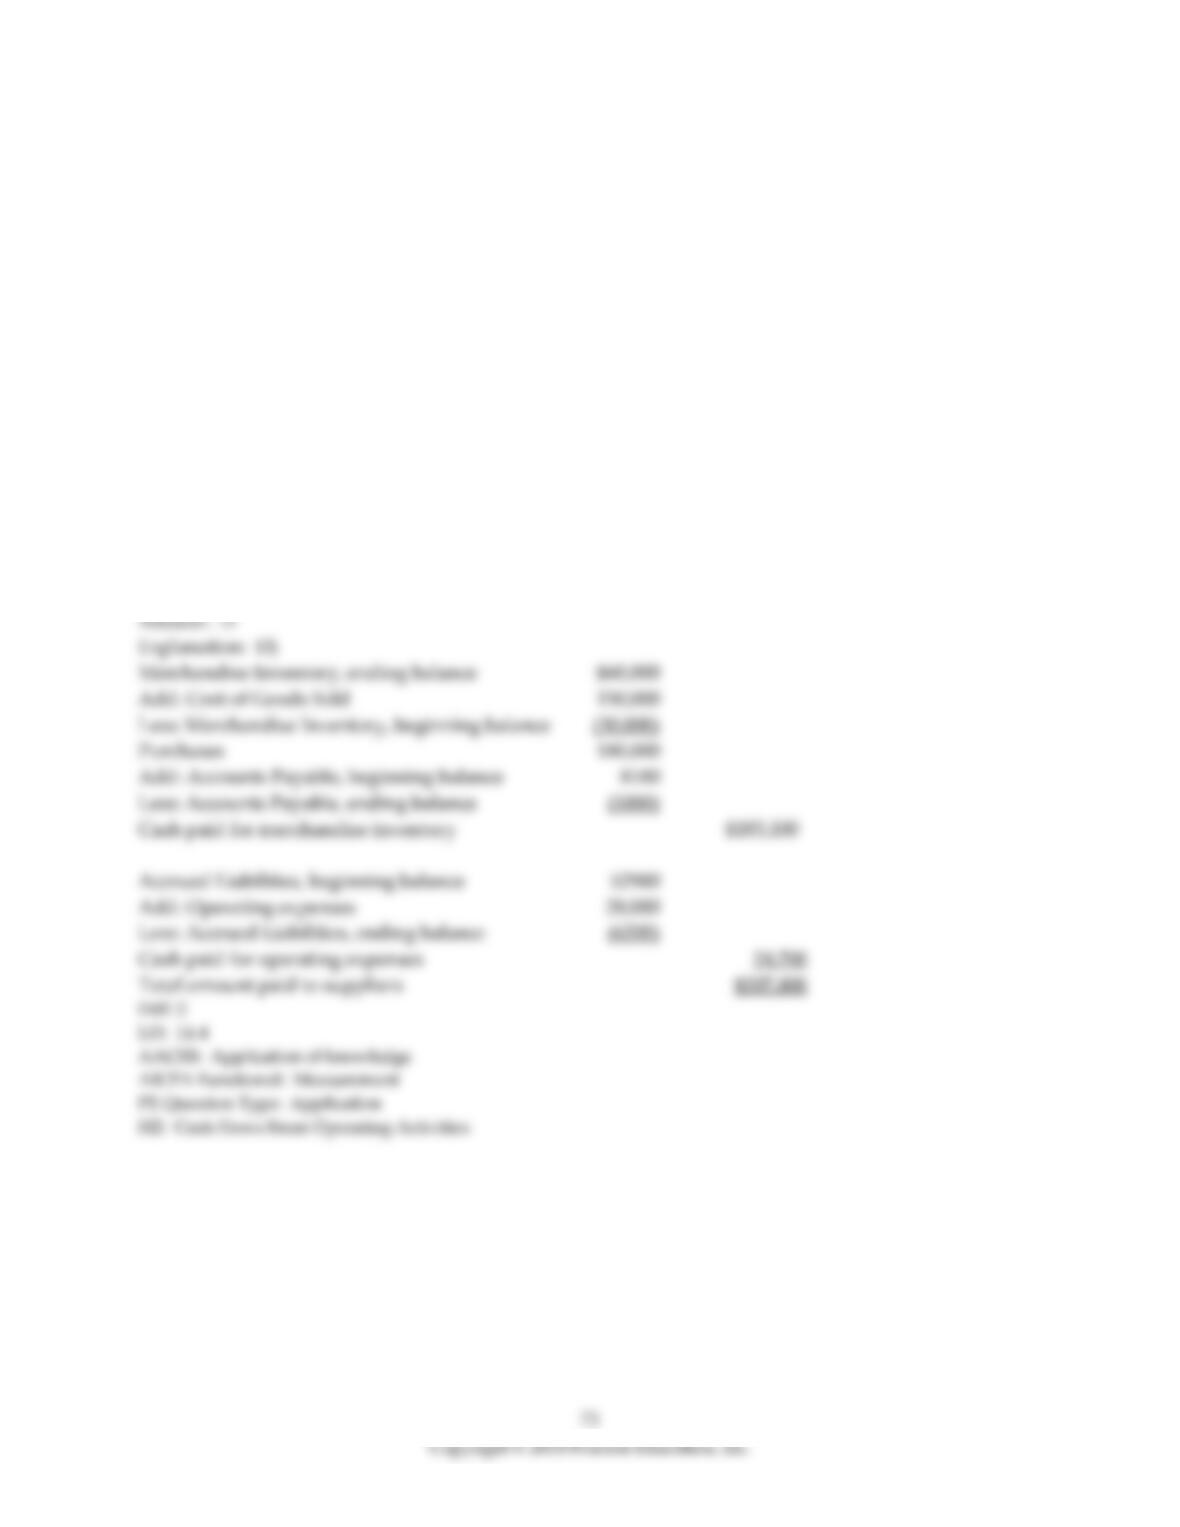
17) Jump Company uses the direct method to prepare its statement of cash flows. Refer to the following
information reported for 2019:
Cost of Goods Sold, $150,000
Merchandise Inventory, beginning balance, $30,000
Merchandise Inventory, ending balance, $60,000
Accounts Payable, beginning balance, $8100
Accounts Payable, ending balance, $5000
Operating expenses, $28,000
Accrued Liabilities, beginning balance, $2900
Accrued Liabilities, ending balance, $6200
Use the direct method to compute the cash paid to suppliers. (Accrued Liabilities relate to operating
expenses.)
A) $158,000
B) $158,400
C) $183,100
D) $207,800
74
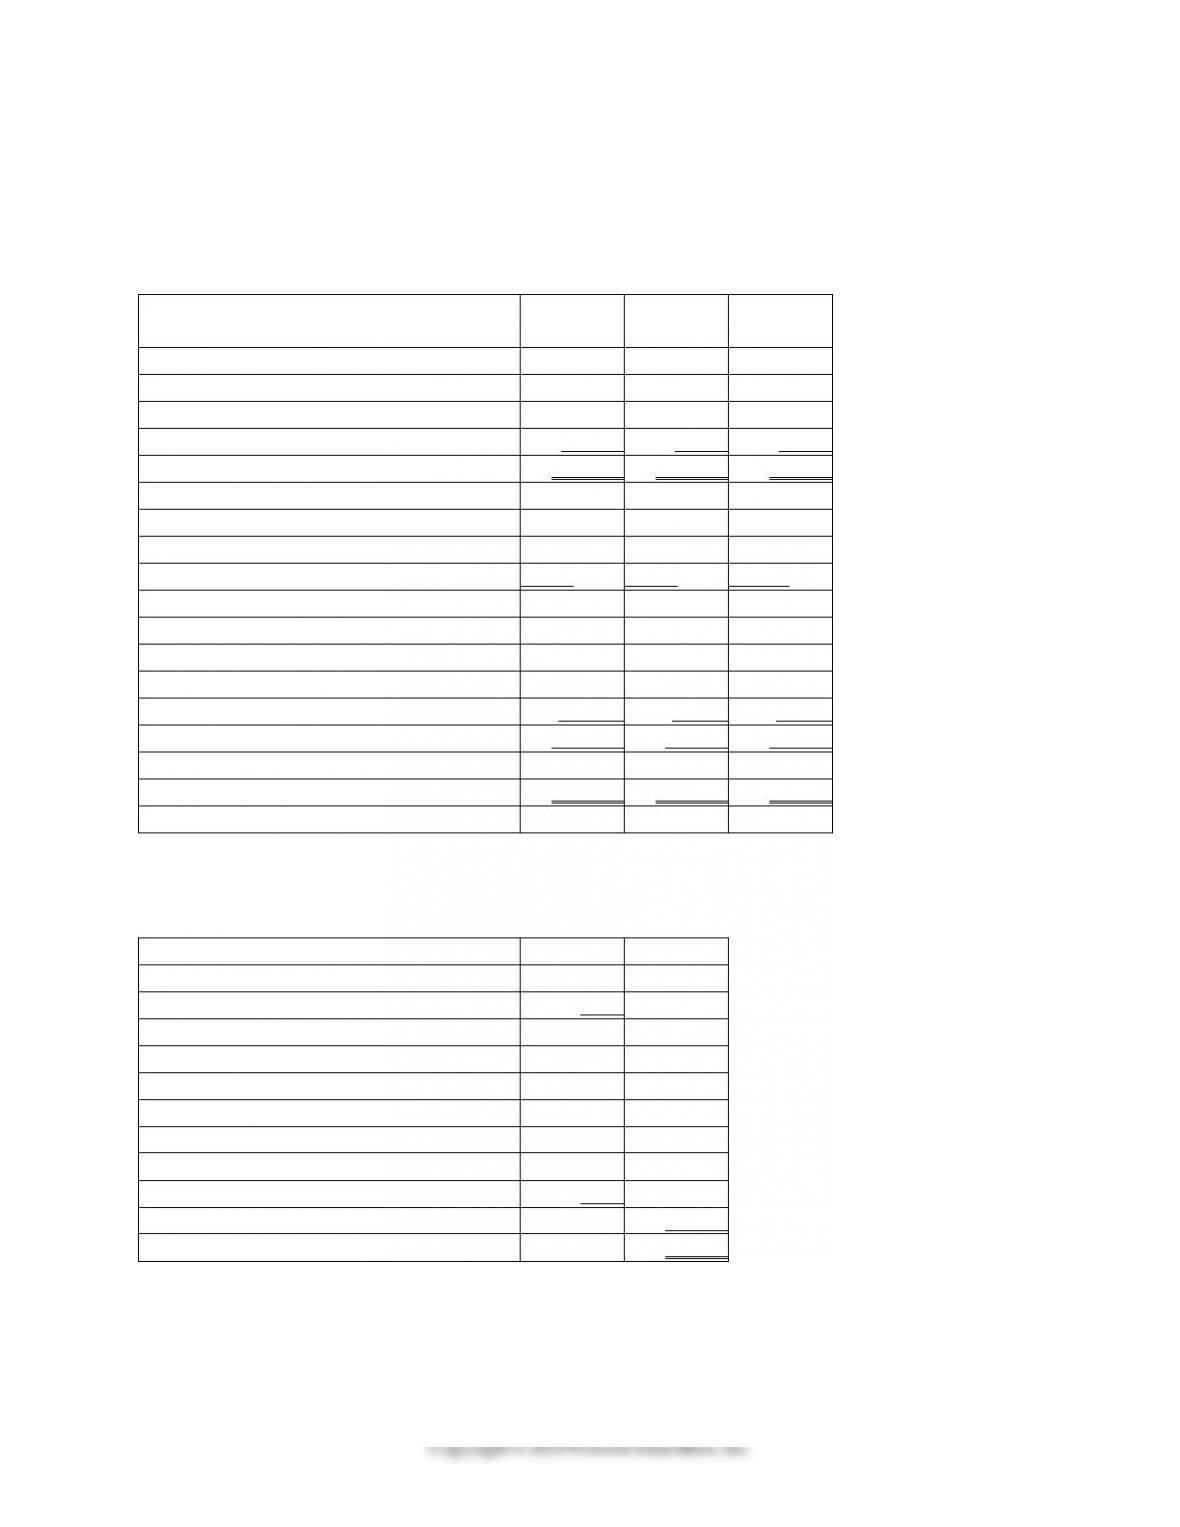
18) Wellington, Inc. uses the direct method to prepare its statement of cash flows. Refer to the following
financial statement information for the year ended December 31, 2019:
Wellington, Inc.
Comparative Balance Sheet
December 31, 2019 and 2018
2019
2018
Increase
(Decrease)
Cash
$32,600
$18,100
$14,500
Accounts Receivable
29,600
31,100
(1500)
Merchandise Inventory
55,800
28,800
27,000
PP&E, net
126,000
92,000
34,000
Total Assets
$244,000
$170,000
$74,000
Accounts Payable
9000
13,000
$(4,000)
Accrued Liabilities
6100
2100
4,000
Long-term Notes Payable
70,900
79,900
$(9000)
Total Liabilities
$86,000
$95,000
$(9,000)
Common Stock
$55,000
$3,000
$52,000
Retained Earnings
115,000
78,000
37,000
Treasury Stock
(12,000)
(6,000)
(6,000)
Total Stockholders’ Equity
$158,000
$75,000
$83,000
Total Liabilities and Stockholders’ Equity
$244,000
$170,000
$74,000
Wellington, Inc.
Income Statement
December 31, 2019
Sales Revenue
$290,200
Interest Revenue
2100
Gain on Sale of Plant Assets
6,000
Total Revenues and Gains
$298,300
Cost of Goods Sold
148,400
Salaries and Wages Expense
46,500
Depreciation Expense—Plant Assets
16,000
Other Operating Expense
24,100
Interest Expense
3,500
Income Tax Expense
7,800
Total Expenses
246,300
Net Income
$52,000
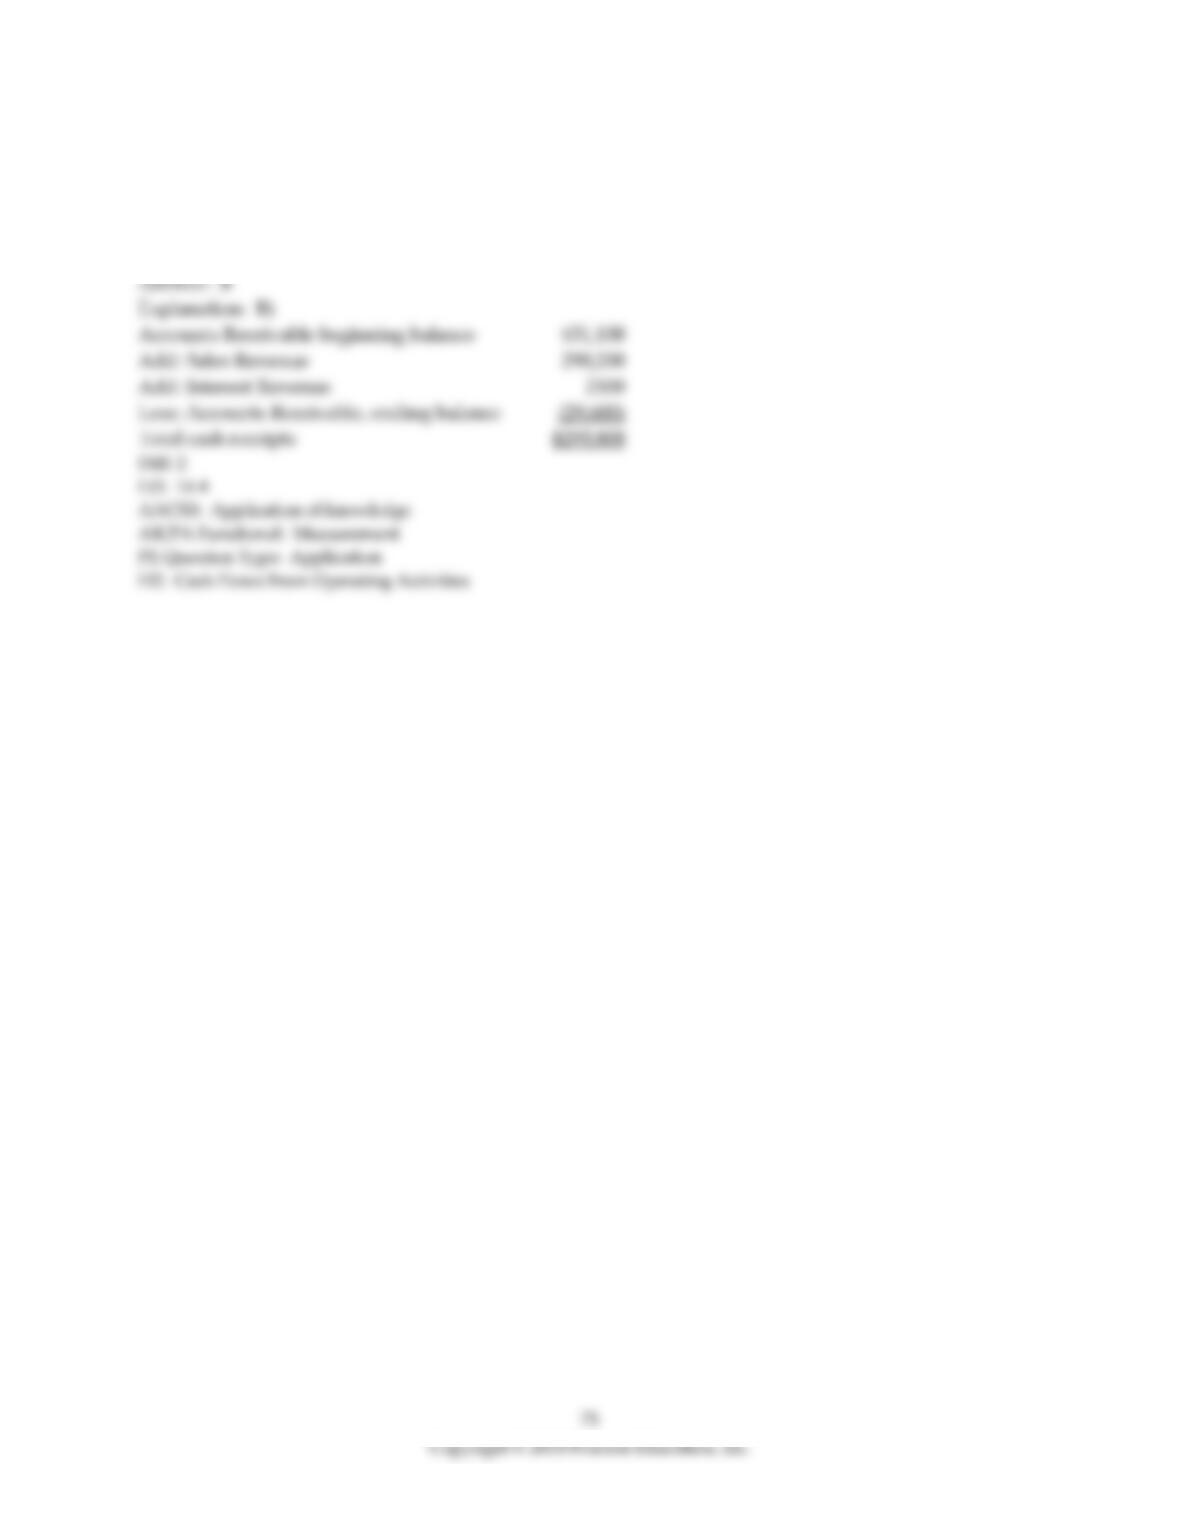
Use the direct method to compute the total cash receipts from operating activities.
A) $288,700
B) $293,800
C) $259,100
D) $296,800
76
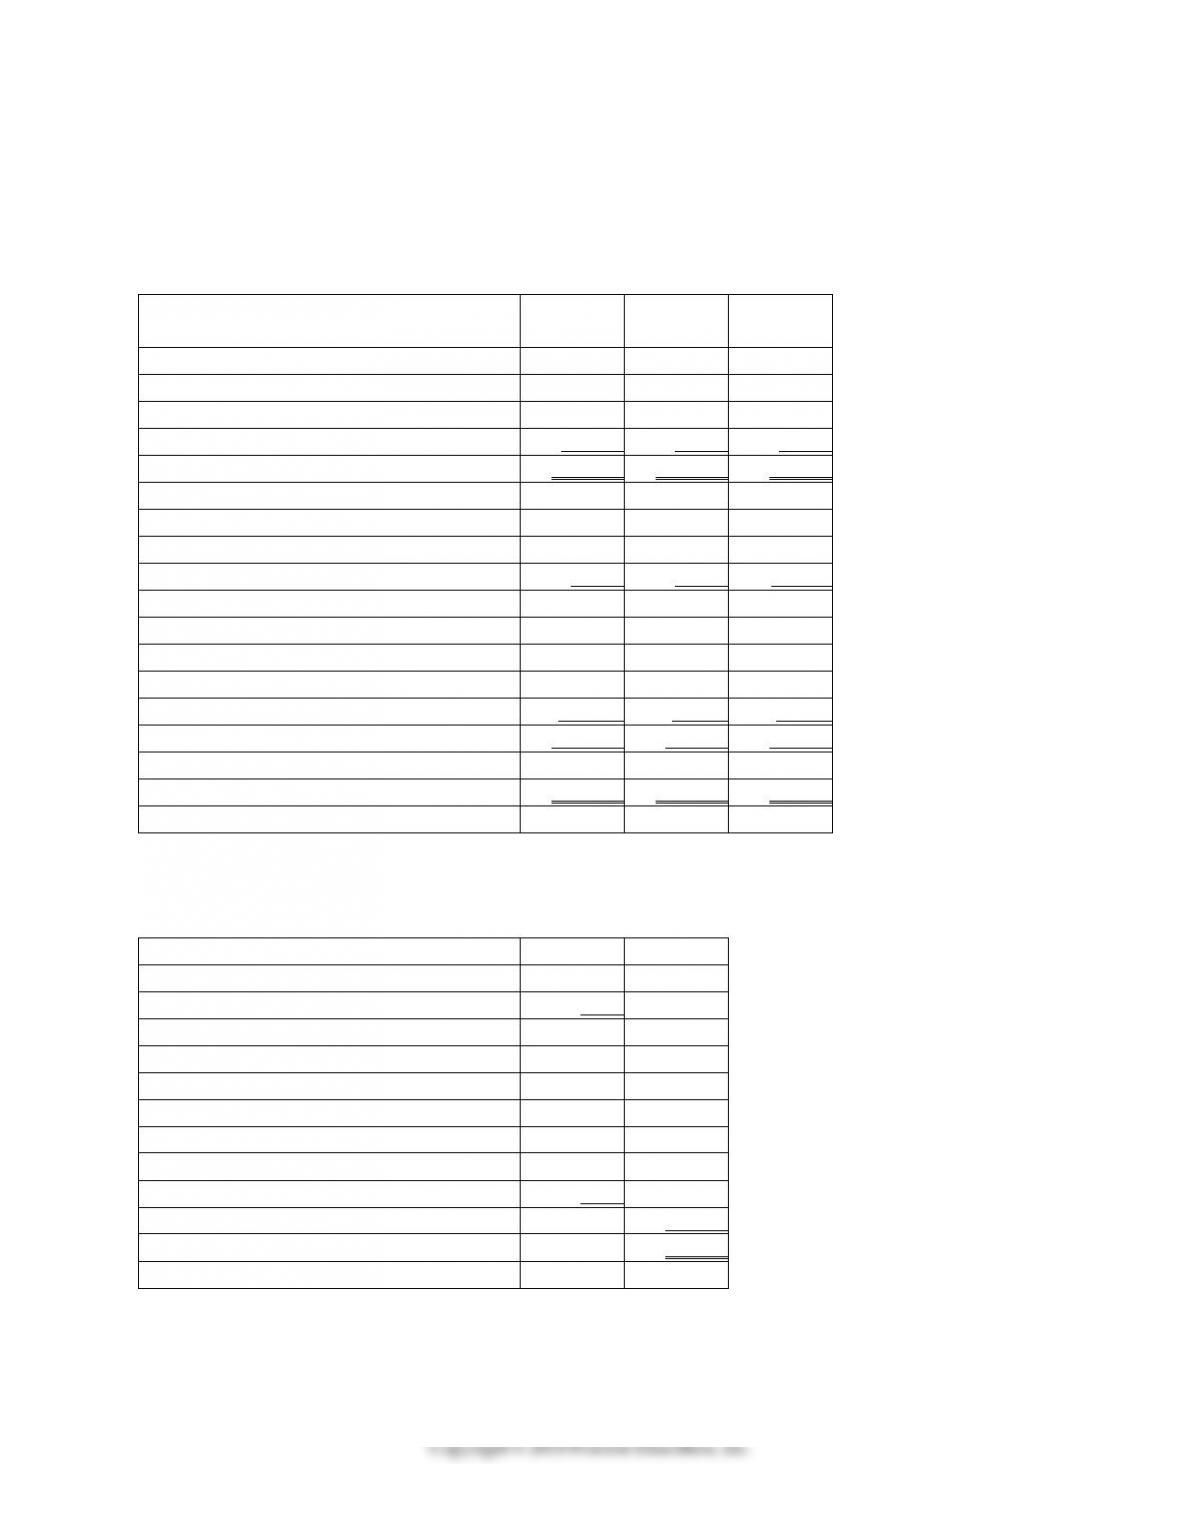
19) Tanglewood, Inc. uses the direct method to prepare its statement of cash flows. Refer to the following
financial statement information for the year ended December 31, 2018:
Tanglewood, Inc.
Comparative Balance Sheet
December 31, 2018 and 2017
2018
2017
Increase
(Decrease)
Cash
$35,200
$15,200
$20,000
Accounts Receivable
29,200
36,200
(7,000)
Merchandise Inventory
53,600
26,600
27,000
PP&E, net
126,000
92,000
34,000
Total Assets
$244,000
$170,000
$74,000
Accounts Payable
8900
12,900
$(4,000)
Accrued Liabilities
6100
2100
4,000
Long-term Notes Payable
71,000
80,000
$(9000)
Total Liabilities
$86,000
$95,000
$(9,000)
Common Stock
$55,000
$3,000
$52,000
Retained Earnings
115,000
78,000
37,000
Treasury Stock
(12,000)
(6,000)
(6,000)
Total Stockholders’ Equity
$158,000
$75,000
$83,000
Total Liabilities and Stockholders’ Equity
$244,000
$170,000
$74,000
Tanglewood, Inc.
Income Statement
December 31, 2018
Sales Revenue
$289,900
Interest Revenue
2400
Gain on Sale of Plant Assets
6,000
Total Revenues and Gains
$298,300
Cost of Goods Sold
148,700
Salaries and Wages Expense
46,600
Depreciation Expense—Plant Assets
16,000
Other Operating Expense
23,700
Interest Expense
3,500
Income Tax Expense
7,800
Total Expenses
246,300
Net Income
$52,000
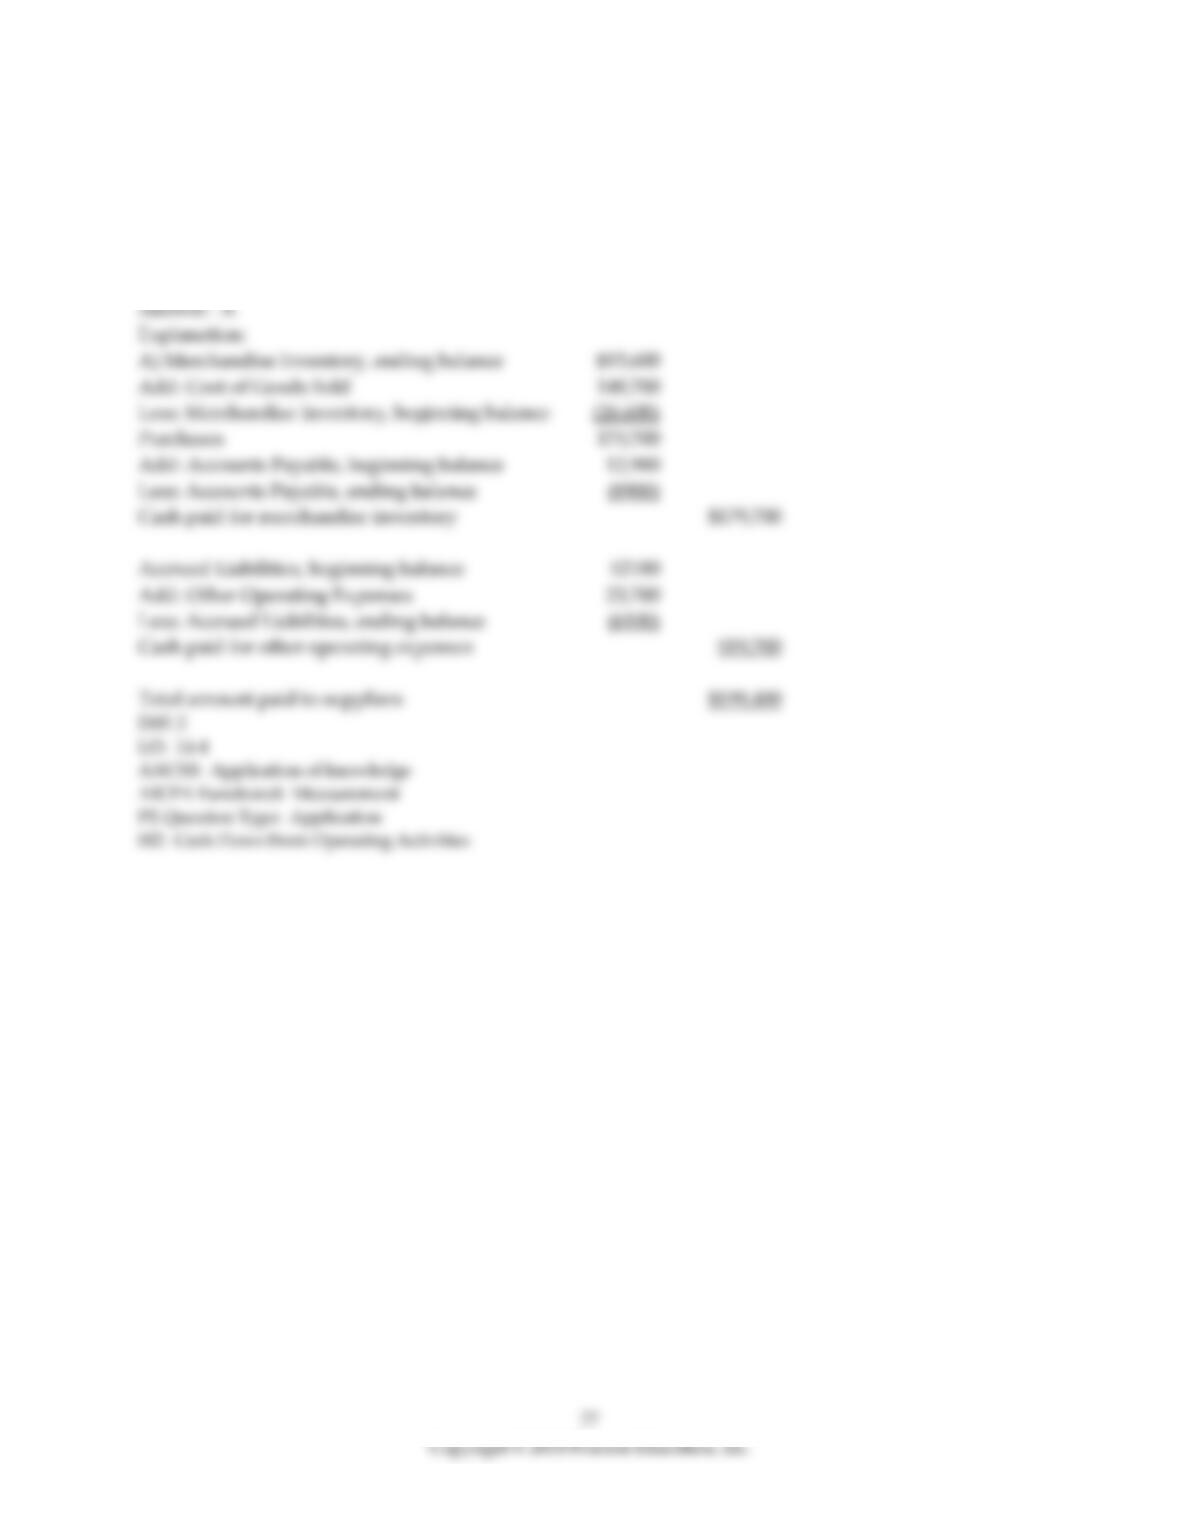
Use the direct method to compute the payments to suppliers for Merchandise Inventory and other
operating expenses. (Accrued Liabilities relate to other operating expense.)
A) $199,400
B) $179,700
C) $19,700
D) $203,400
78
20) Dental, Inc. uses the direct method to prepare its statement of cash flows. Refer to the following
financial statement information for the year ended December 31, 2019:
Dental, Inc.
Comparative Balance Sheet
December 31, 2019 and 2018
2019
2018
Increase
(Decrease)
Cash
$34,000
$14,000
$20,000
Accounts Receivable
26,400
33,400
(7,000)
Merchandise Inventory
57,600
30,600
27,000
PP&E, net
126,000
92,000
34,000
Total Assets
$244,000
$170,000
$74,000
Accounts Payable
9600
13,600
$(4,000)
Accrued Liabilities
6700
2700
4,000
Long-term Notes Payable
69,700
78,700
$(9000)
Total Liabilities
$86,000
$95,000
$(9,000)
Common Stock
$55,000
$3,000
$52,000
Retained Earnings
115,000
78,000
37,000
Treasury Stock
(12,000)
(6,000)
(6,000)
Total Stockholders’ Equity
$158,000
$75,000
$83,000
Total Liabilities and Stockholders’ Equity
$244,000
$170,000
$74,000
Dental, Inc.
Income Statement
December 31, 2019
Sales Revenue
$291,000
Interest Revenue
1300
Gain on Sale of Plant Assets
6,000
Total Revenues and Gains
$298,300
Cost of Goods Sold
147,600
Salaries and Wages Expense
46,700
Depreciation Expense—Plant Assets
16,000
Other Operating Expense
24,700
Interest Expense
3,500
Income Tax Expense
7,800
Total Expenses
246,300
Net Income
$52,000
Use the direct method to compute the payments made to employees. (Accrued Liabilities relate to other
operating expense.)
A) $71,400
B) $42,700
C) $24,700
D) $46,700

80
21) Gilmore Company uses the direct method to prepare its statement of cash flows. Refer to the
following financial statement information for the year ended December 31, 2018:
Gilmore Company
Comparative Balance Sheet
December 31, 2018 and 2017
2018
2017
Increase
(Decrease)
Cash
$34,600
$16,900
$17,700
Accounts Receivable
27,000
31,700
(4700)
Merchandise Inventory
56,400
29,400
27,000
PP&E, net
126,000
92,000
34,000
Total Assets
$244,000
$170,000
$74,000
Accounts Payable
8200
12,200
$(4,000)
Accrued Liabilities
6100
2100
4,000
Long-term Notes Payable
71,700
80,700
$(9000)
Total Liabilities
$86,000
$95,000
$(9,000)
Common Stock
$55,000
$3,000
$52,000
Retained Earnings
115,000
78,000
37,000
Treasury Stock
(12,000)
(6,000)
(6,000)
Total Stockholders’ Equity
$158,000
$75,000
$83,000
Total Liabilities and Stockholders’ Equity
$244,000
$170,000
$74,000
Gilmore Company
Income Statement
December 31, 2018
Sales Revenue
$289,800
Interest Revenue
2500
Gain on Sale of Plant Assets
6,000
Total Revenues and Gains
$298,300
Cost of Goods Sold
147,900
Salaries and Wages Expense
46,200
Depreciation Expense—Plant Assets
16,000
Other Operating Expense
24,900
Interest Expense
3,500
Income Tax Expense
7,800
Total Expenses
246,300
Net Income
$52,000