122
TEST QUESTIONS & PROBLEMS – CHAPTER #12
Short Answer Questions
1. Identify two changes in a watershed that would affect the hydrologic homogeneity of a data
set containing annual maximum stream flows.
2. (T or F) An annual maximum series is formed using the highest N values on a data record
which is N years long.
3. Random hydrologic variables include all of the following except:
a) mean sea level b) precipitation c) flood flows d) annual evaporation e) wind speed
4. (T or F) The 50 largest stream flows in a 50-year gage record represents a population.
5. Identify three statistical parameters that are useful in analyzing probability distributions.
6. Which of the following probability distributions is rarely used in hydrologic applications?
a) Normal b) Log-Normal c) Log-Pearson Type III d) Gumbel
7. (T or F) The probability distribution recommended to model annual maximum streamflow
series by the Interagency Advisory Committee on Water Data, U.S. Geological Survey is the
Log-Pearson Type III distribution.
8. Define the term return period, also called the recurrence interval.
9. A 3,000 cfs flood has an annual probability of exceedence of 20%. What is its return period?
10. (T or F) Hydrologic risk is the probability that the design discharge will be exceeded once
during the service life of the project.
11. In the closed form frequency function: xT = m + KT(s), what does xT represent??
123
12. Frequency analysis may be performed by all of the following distributions except:
a) Normal b) Rational c) Log-Pearson Type III d) Gumbel
13. (T or F) In the Gumbel method, KT is a function of the skew coefficient and the return period.
Ans. False. It is only a function of the return period.
14. (T or F) In the Log Pearson Type III frequency analysis method, KT is a function of the skew
coefficient and the return period.
15. What purpose is fulfilled by the chi-square test as a statistical procedure in hydrology?
16. The chi-square test statistic is
E
E
–
O
=
i
i
i2
k
1=i
2)(
. Define the variable Oi and Ei.
17. (T or F) The width of a confidence interval depends upon the size of the sample and the
confidence level trying to be achieved (i.e., 90%).
18. Commercial graph paper is available for all of the following probability distributions except:
b) Normal b) Log-Normal c) Log-Pearson Type III d) Gumbel
19. Hydrologic data is often plotted on specially-designed probability paper. What is plotted on the
ordinate and what is plotted on the abscissa?
20. (T or F) Normally, the Log-Pearson III distribution is used for rainfall frequency analysis (i.e.,
the development of intensity-duration-frequency, or IDF, curves).
Problems
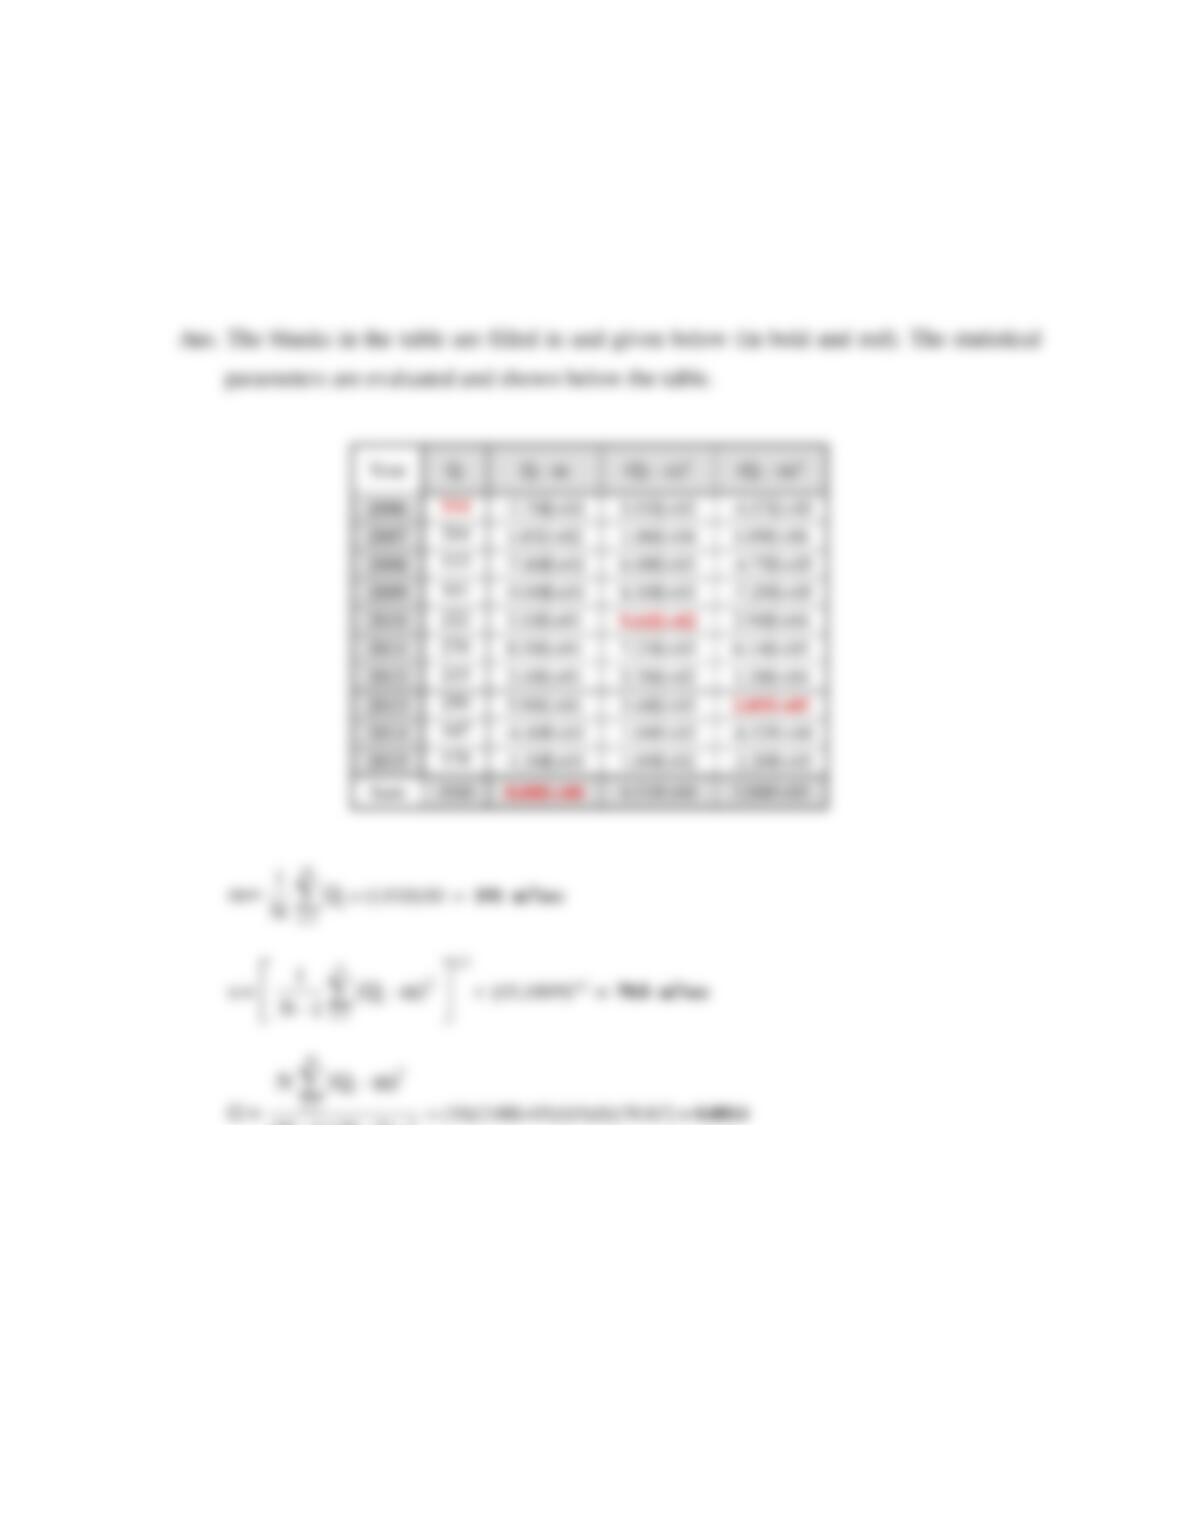
1. The table below is used to evaluate the statistical parameters of an annual peak discharge
(m3/sec) data record. Fill in the blanks in the table and evaluate the mean, standard deviation,
and skewness of the original data set.
125
l
3
ls
2–N 1–N
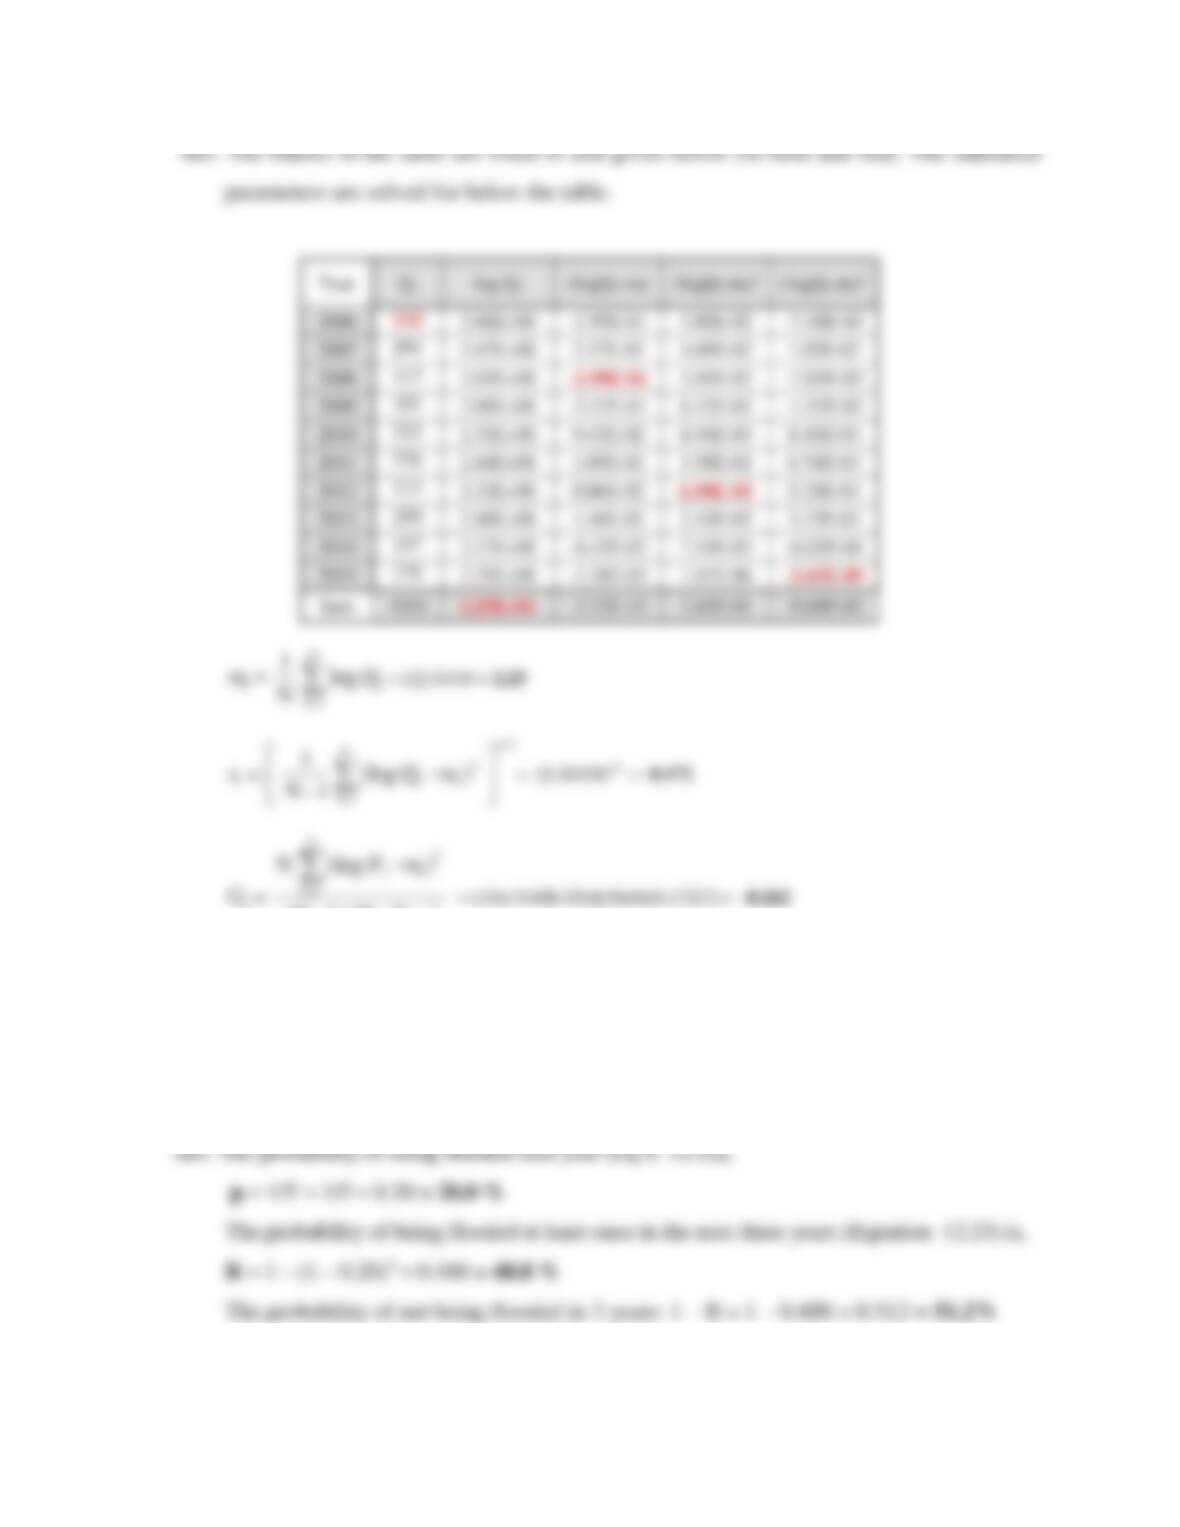
3. A riparian property owner has been informed that the first floor of her garage is at the 5-year
flood elevation. She would like to determine the flood damage risk of leaving old furniture
(which she hopes to sell within a few years) in the garage. What is the probability that the
garage will be flooded next year? What is the probability that it is flooded at least once in the
next three years? What is probability that it will not be flooded in the next three years?
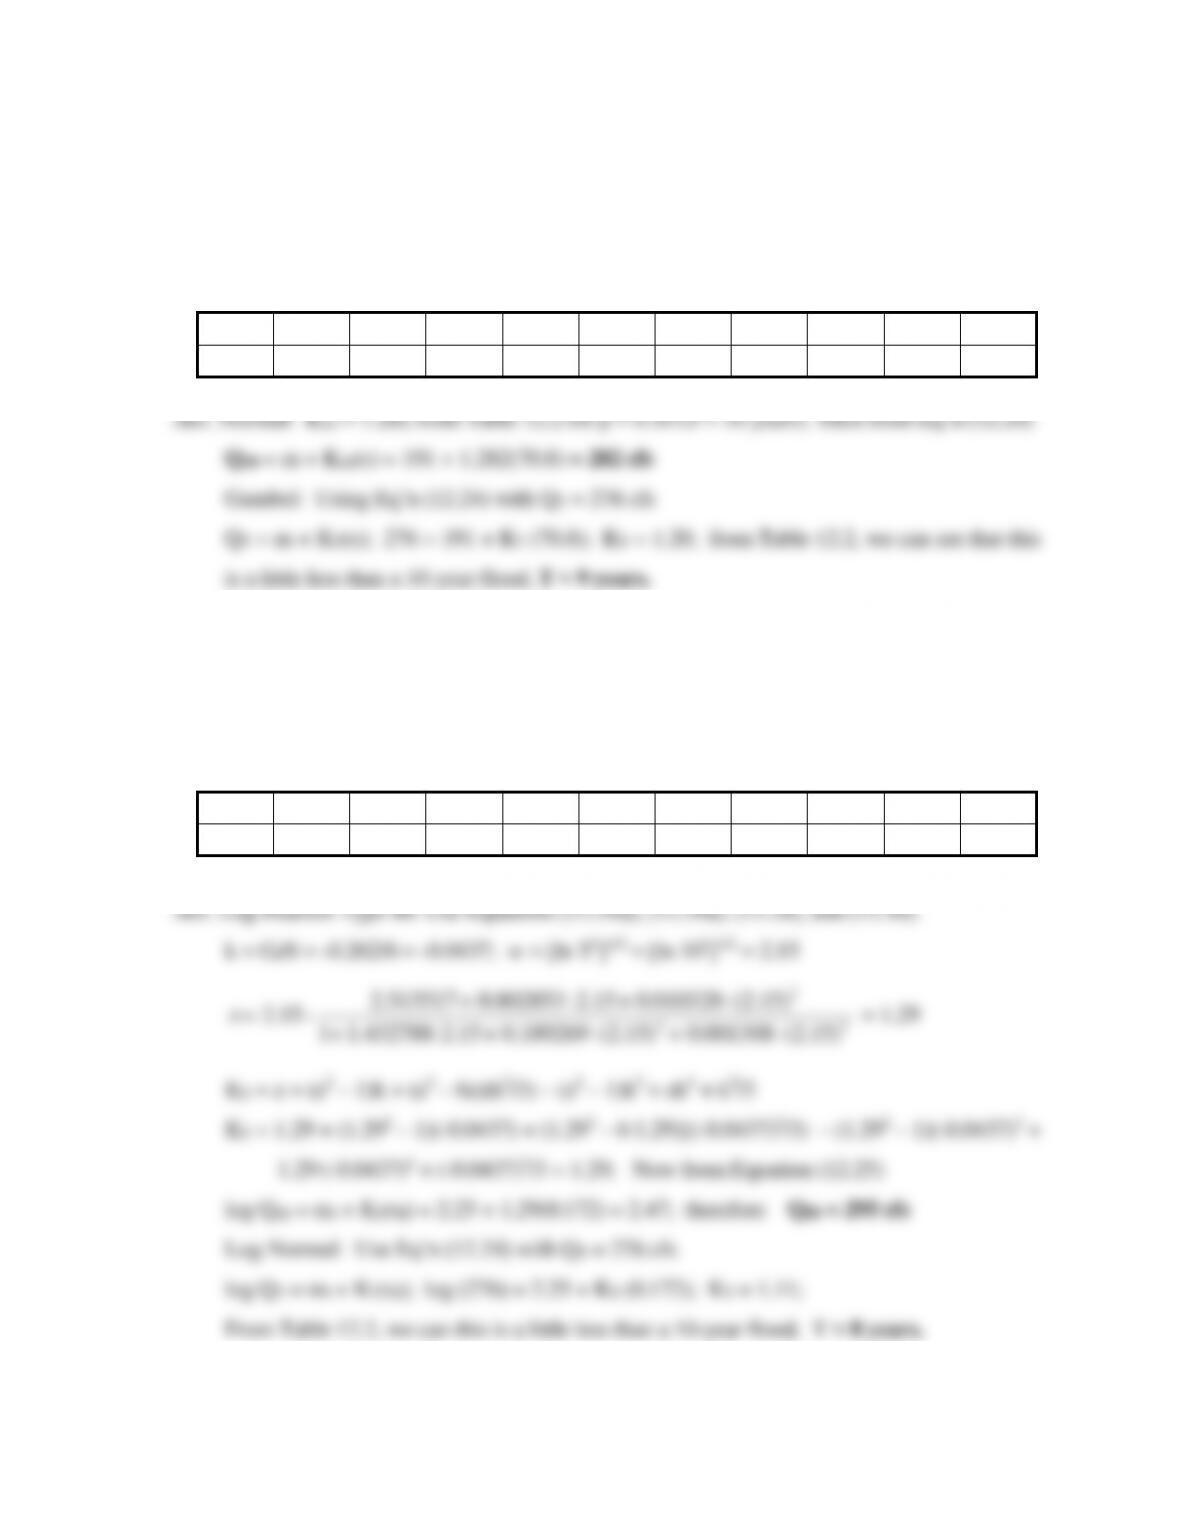
4. A 10-year record of annual peak discharges (cfs) are provided below for the Wabash River.
The statistical parameters for this annual series are: m = 191 cfs, s = 70.8 cfs, and G = 0.0814.
Determine the 10-year flood assuming the data fits a normal distribution. Also determine the
return interval for the 2005 flood (276 cfs) assuming the data fits a Gumbel distribution.
Year
2000
2001
2002
2003
2004
2005
2006
2007
2008
2009
Qi
114
294
113
101
222
276
215
250
147
178
5. A 10-year record of annual peak discharges (cfs) are provided below for the Wabash River.
The statistical parameters for this annual series are: ml = 2.25, sl = 0.172, and Gl = –0.262.
Determine the 10-year flood assuming the data fits a Log-Pearson III distribution. Also
determine the return interval for the 2005 flood (276 cfs) assuming the data fits a Log-Normal
distribution.
Year
2000
2001
2002
2003
2004
2005
2006
2007
2008
2009
Qi
114
294
113
101
222
276
215
250
147
178
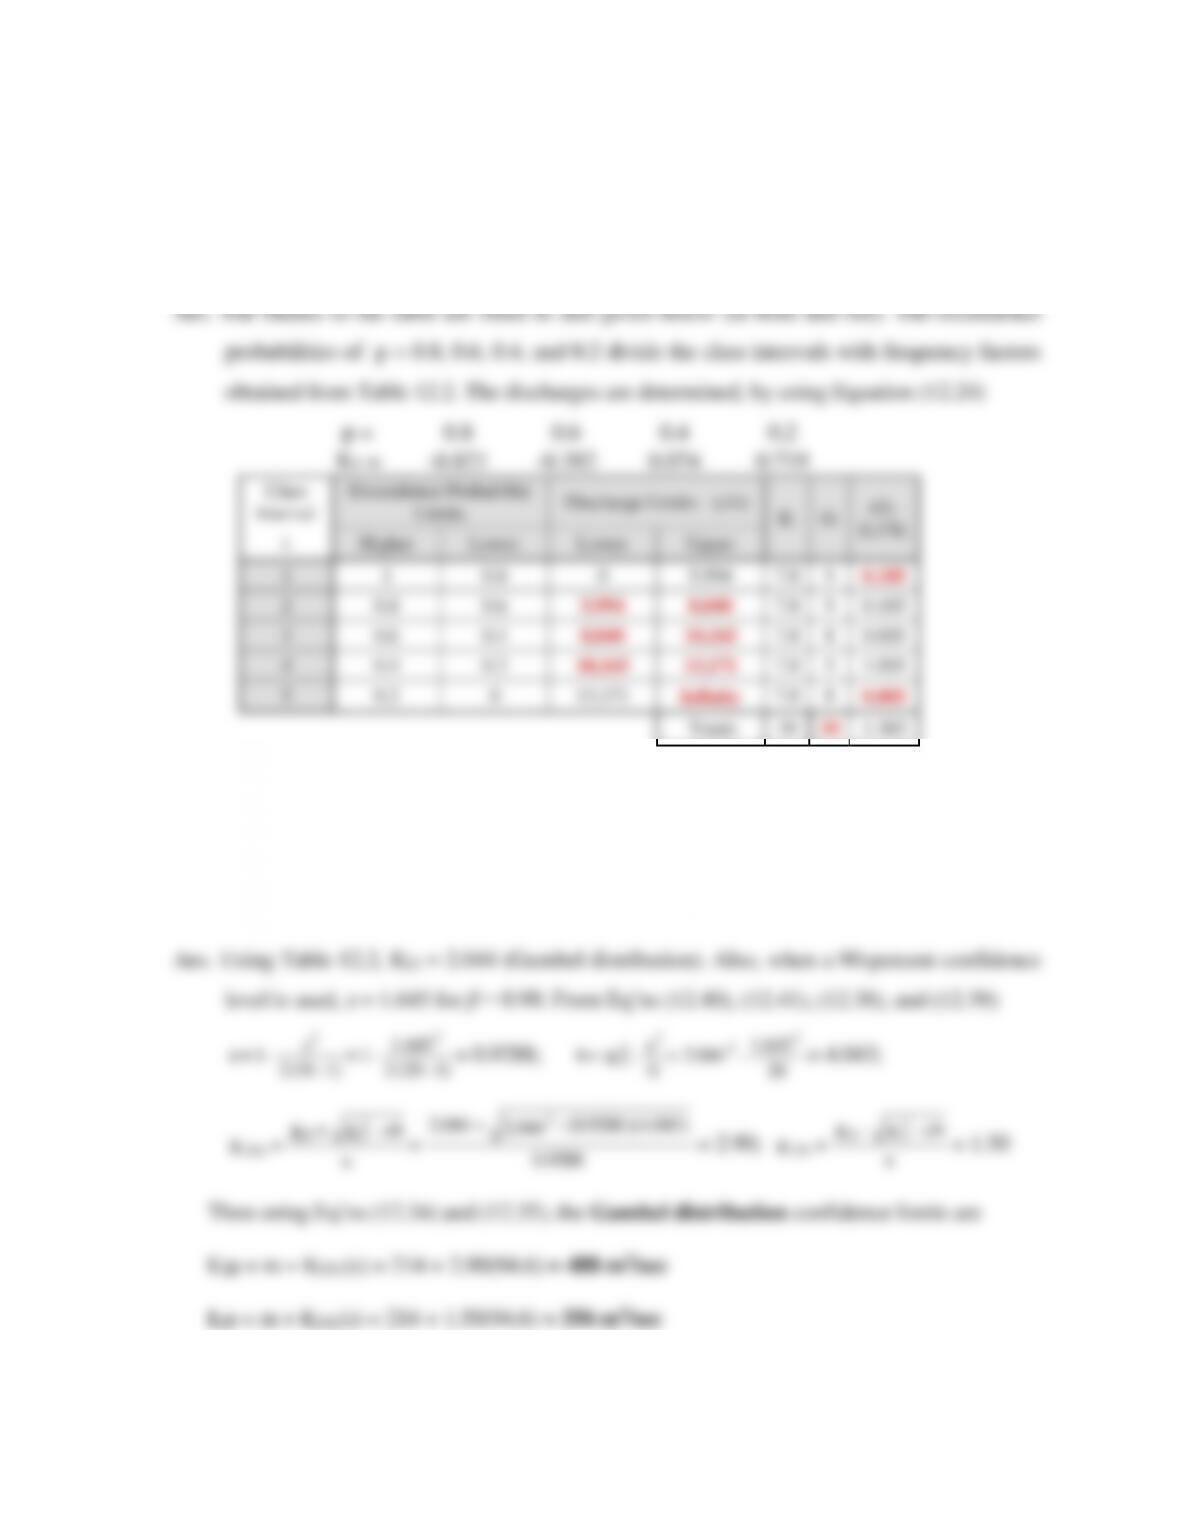
6. Annual maximum discharges (39 years) on a river of interest are examined to determine the
goodness of fit to the Gumbel distribution. The sample statistics are m = 9,820 cfs and s =
4,660 cfs. Data to determine the goodness of fit test are shown in the table below. Fill in the
blanks of the table if the significance level of α = 0.50 is used. Use five class intervals (k = 5).
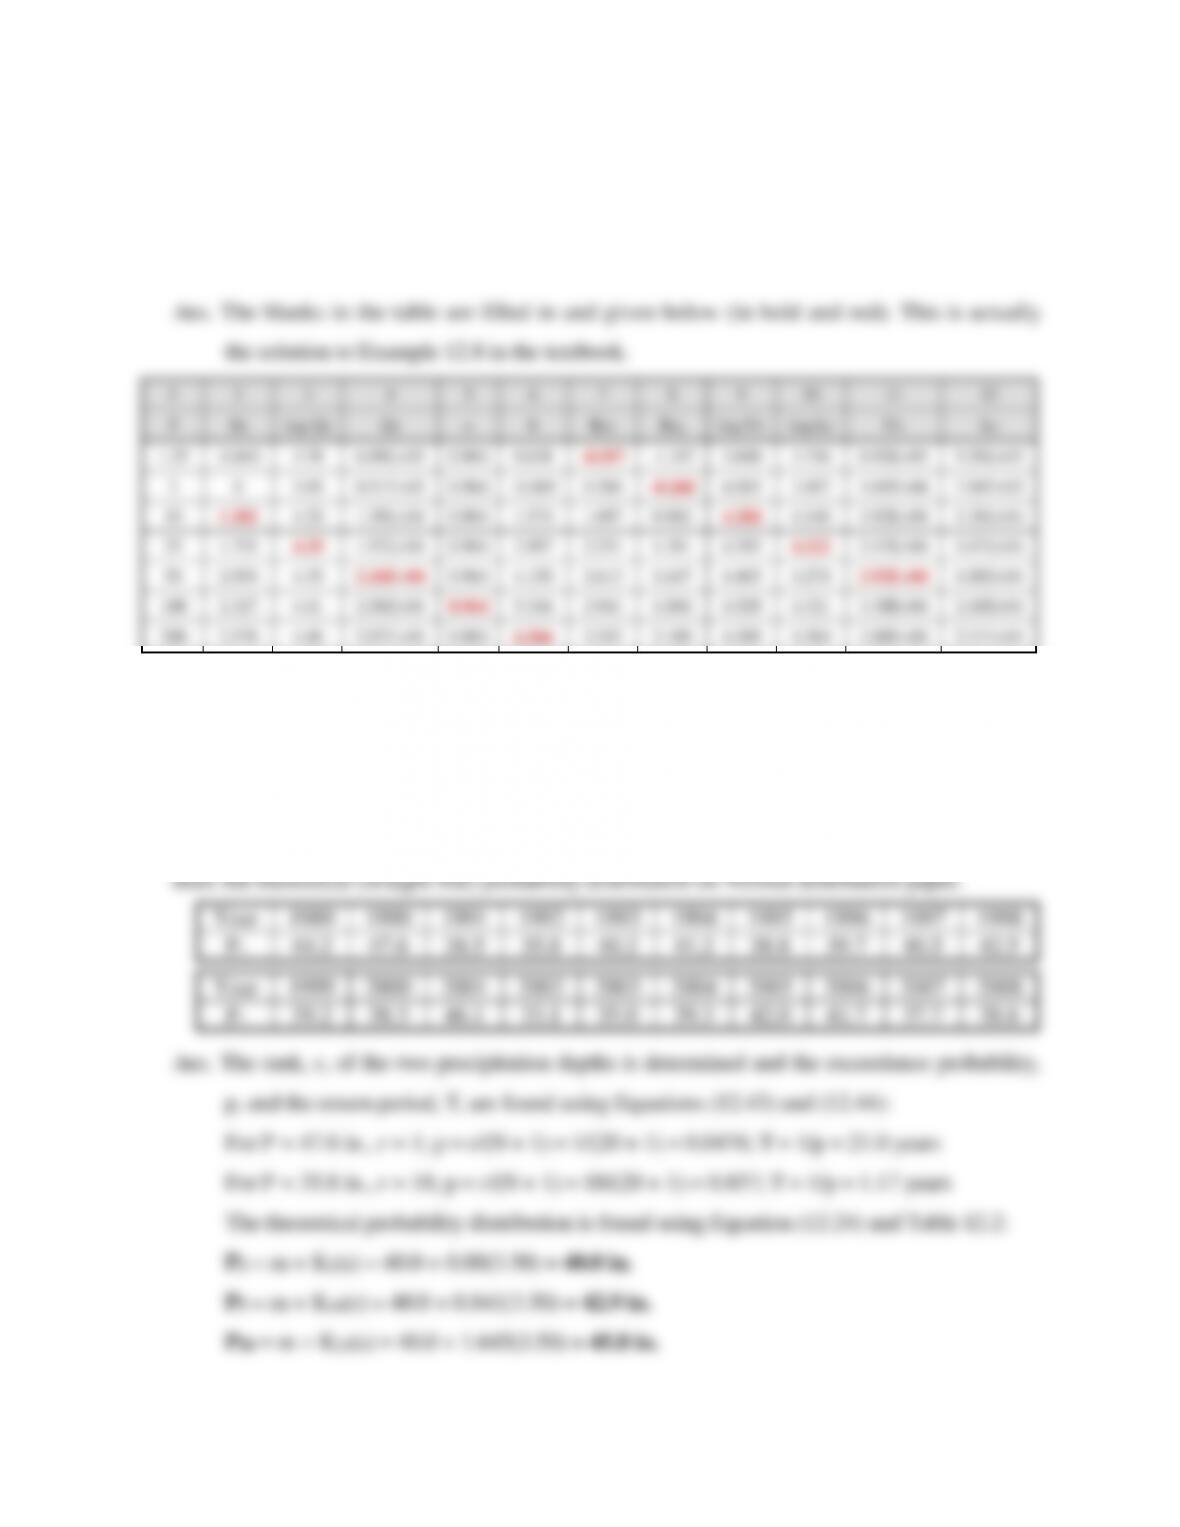
8. Annual maximum discharges (39 years) on a river of interest are examined to determine the
90% confidence limits for the 1.25-, 2-, 10-, 25-, 50-, 100– and 200-year peak discharges. The
sample statistics are ml = 3.95 and sl = 0.197. If the Log-Normal distribution is shown to fit the
data, fill in the blanks of the computational table below.