
41
10) Refer to Figure 3.10. An increase in the wage rate of pizza makers will cause a movement from Point B
on supply curve S2 to
A) Point A on supply curve S2.
B) Point C on supply curve S2.
C) supply curve S3.
D) supply curve S1.
Topic: Supply in Product / Output Markets
Skill: Analytical
AACSB: Analytical Thinking
Learning Outcome: Micro-4
11) Refer to Figure 3.10. A decrease in supply is represented by the movement from
A) S2 to S3.
B) S2 to S1.
C) Point B to Point A along supply curve S2.
D) Point B to Point C along supply curve S2.
Topic: Supply in Product / Output Markets
Skill: Analytical
AACSB: Analytical Thinking
Learning Outcome: Micro-4
12) Refer to Figure 3.10. An increase in quantity supplied is represented by a movement from
A) S2 to S3.
B) S2 to S1.
C) Point B to Point A along supply curve S2.
D) Point B to Point C along supply curve S2.
Topic: Supply in Product / Output Markets
Skill: Analytical
AACSB: Analytical Thinking
Learning Outcome: Micro-4

42
13) Refer to Figure 3.10. A decrease in the price of pizza sauce will cause a movement from Point B on
supply curve S2 to
A) supply curve S3.
B) supply curve S1.
C) Point A on supply curve S2.
D) Point C on supply curve S2.
Topic: Supply in Product / Output Markets
Skill: Analytical
AACSB: Analytical Thinking
Learning Outcome: Micro-4
14) Refer to Figure 3.10. A movement from Point C to Point B on supply curve S2 would be caused by a(n)
A) decrease in the price of pizza.
B) decrease in the price of pizza dough.
C) increase in the demand for pizza.
D) increase in the price of hamburgers, assuming hamburgers are a substitute for pizza.
Topic: Supply in Product / Output Markets
Skill: Analytical
AACSB: Analytical Thinking
Learning Outcome: Micro-4
43
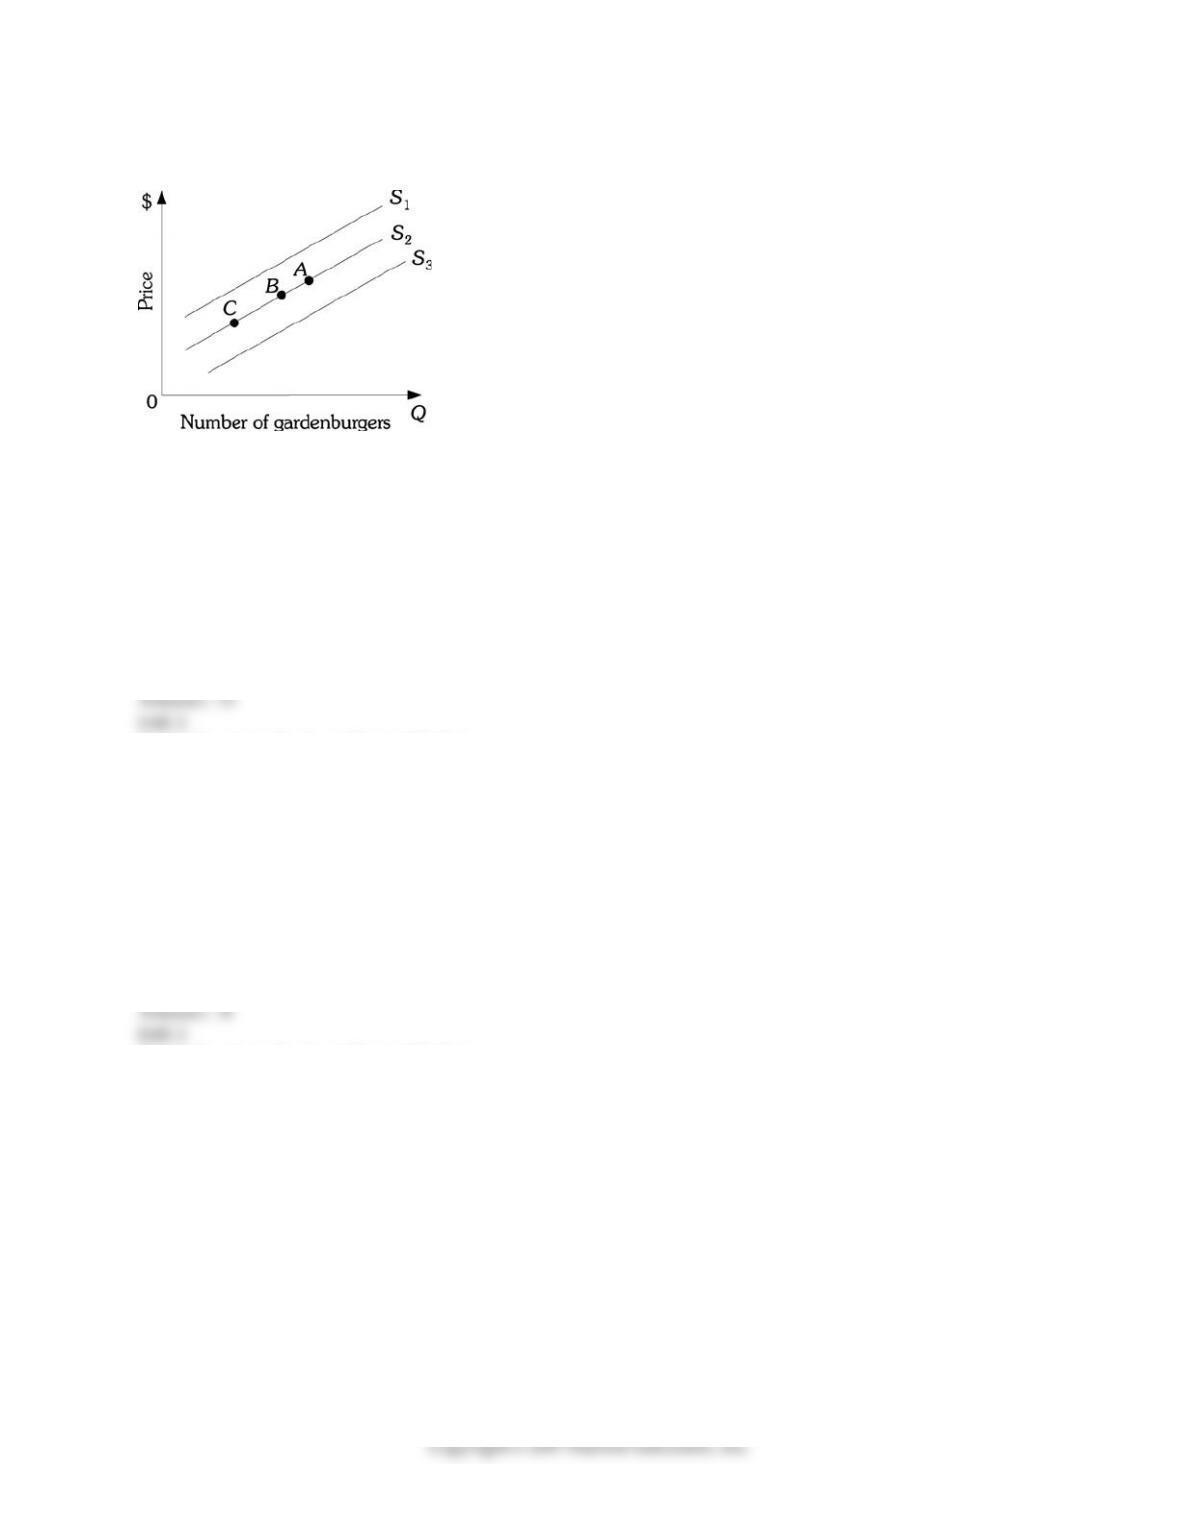
Refer to the information provided in Figure 3.11 below to answer the following question(s).
Figure 3.11
15) Refer to Figure 3.11. An increase in the wage rate of gardenburger makers will cause a movement
from Point B on supply curve S2 to
A) Point A on supply curve S2.
B) Point C on supply curve S2.
C) supply curve S3.
D) supply curve S1.
Topic: Supply in Product / Output Markets
Skill: Analytical
AACSB: Analytical Thinking
Learning Outcome: Micro-4
16) Refer to Figure 3.11. A decrease in supply is represented by the movement from
A) S2 to S3.
B) S2 to S1.
C) Point B to Point A along supply curve S2.
D) Point B to Point C along supply curve S2.
Topic: Supply in Product / Output Markets
Skill: Analytical
AACSB: Analytical Thinking
Learning Outcome: Micro-4

44
17) Refer to Figure 3.11. An increase in quantity supplied is represented by a movement from
A) S2 to S1.
B) S2 to S3.
C) Point B to Point A along supply curve S2.
D) Point B to Point C along supply curve S2.
Topic: Supply in Product / Output Markets
Skill: Analytical
AACSB: Analytical Thinking
Learning Outcome: Micro-4
18) Refer to Figure 3.11. A decrease in the price of mushrooms (an input for gardenburgers) will cause a
movement from Point B on supply curve S2 to
A) supply curve S3.
B) supply curve S1.
C) Point A on supply curve S2.
D) Point C on supply curve S2.
Topic: Supply in Product / Output Markets
Skill: Analytical
AACSB: Analytical Thinking
Learning Outcome: Micro-4
19) Refer to Figure 3.11. A movement from Point C to Point B on supply curve S2 would be caused by a(n)
A) decrease in the price of gardenburgers.
B) increase in the demand for gardenburgers.
C) decrease in the price of mushrooms.
D) decrease in the price of hamburgers, assuming hamburgers are a substitute for pizza.
Topic: Supply in Product / Output Markets
Skill: Analytical
AACSB: Analytical Thinking
Learning Outcome: Micro-4

45
20) Refer to Figure 3.11. A decrease in the wage rate of gardenburger makers will cause a movement from
Point B on supply curve S2 to
A) Point A on supply curve S2.
B) Point B on supply curve S2.
C) supply curve S3.
D) supply curve S1.
Topic: Supply in Product / Output Markets
Skill: Analytical
AACSB: Analytical Thinking
Learning Outcome: Micro-4
21) Refer to Figure 3.11. An increase in supply is represented by the movement from
A) S2 to S3.
B) S2 to S1.
C) Point B to Point A along supply curve S2.
D) Point B to Point C along supply curve S2.
Topic: Supply in Product / Output Markets
Skill: Analytical
AACSB: Analytical Thinking
Learning Outcome: Micro-4
22) Refer to Figure 3.11. A decrease in quantity supplied is represented by a movement from
A) S2 to S1.
B) S2 to S3.
C) Point B to Point A along supply curve S2.
D) Point B to Point C along supply curve S2.
Topic: Supply in Product / Output Markets
Skill: Analytical
AACSB: Analytical Thinking
Learning Outcome: Micro-4

46
23) Refer to Figure 3.11. An increase in the price of tomatoes (an input for gardenburgers) will cause a
movement from Point B on supply curve S2 to
A) supply curve S3.
B) supply curve S1.
C) Point A on supply curve S2.
D) Point C on supply curve S2.
Topic: Supply in Product / Output Markets
Skill: Analytical
AACSB: Analytical Thinking
Learning Outcome: Micro-4
24) Refer to Figure 3.11. A movement from Point A to Point B on supply curve S2 would be caused by
a(n)
A) increase in the price of gardenburgers.
B) decrease in the demand for gardenburgers.
C) increase in the price of tomatoes.
D) increase in the price of hamburgers, assuming hamburgers are a substitute for pizza.
Topic: Supply in Product / Output Markets
Skill: Analytical
AACSB: Analytical Thinking
Learning Outcome: Micro-4
25) The change in the price of a good leads to a change in ________, which leads to a ________.
A) quantity supplied; movement along a supply curve
B) quantity supplied; shift of the supply curve
C) supply; movement along a supply curve
D) supply; shift of the supply curve
Topic: Supply in Product / Output Markets
Skill: Conceptual
AACSB: Reflective Thinking
Learning Outcome: Micro-4
47
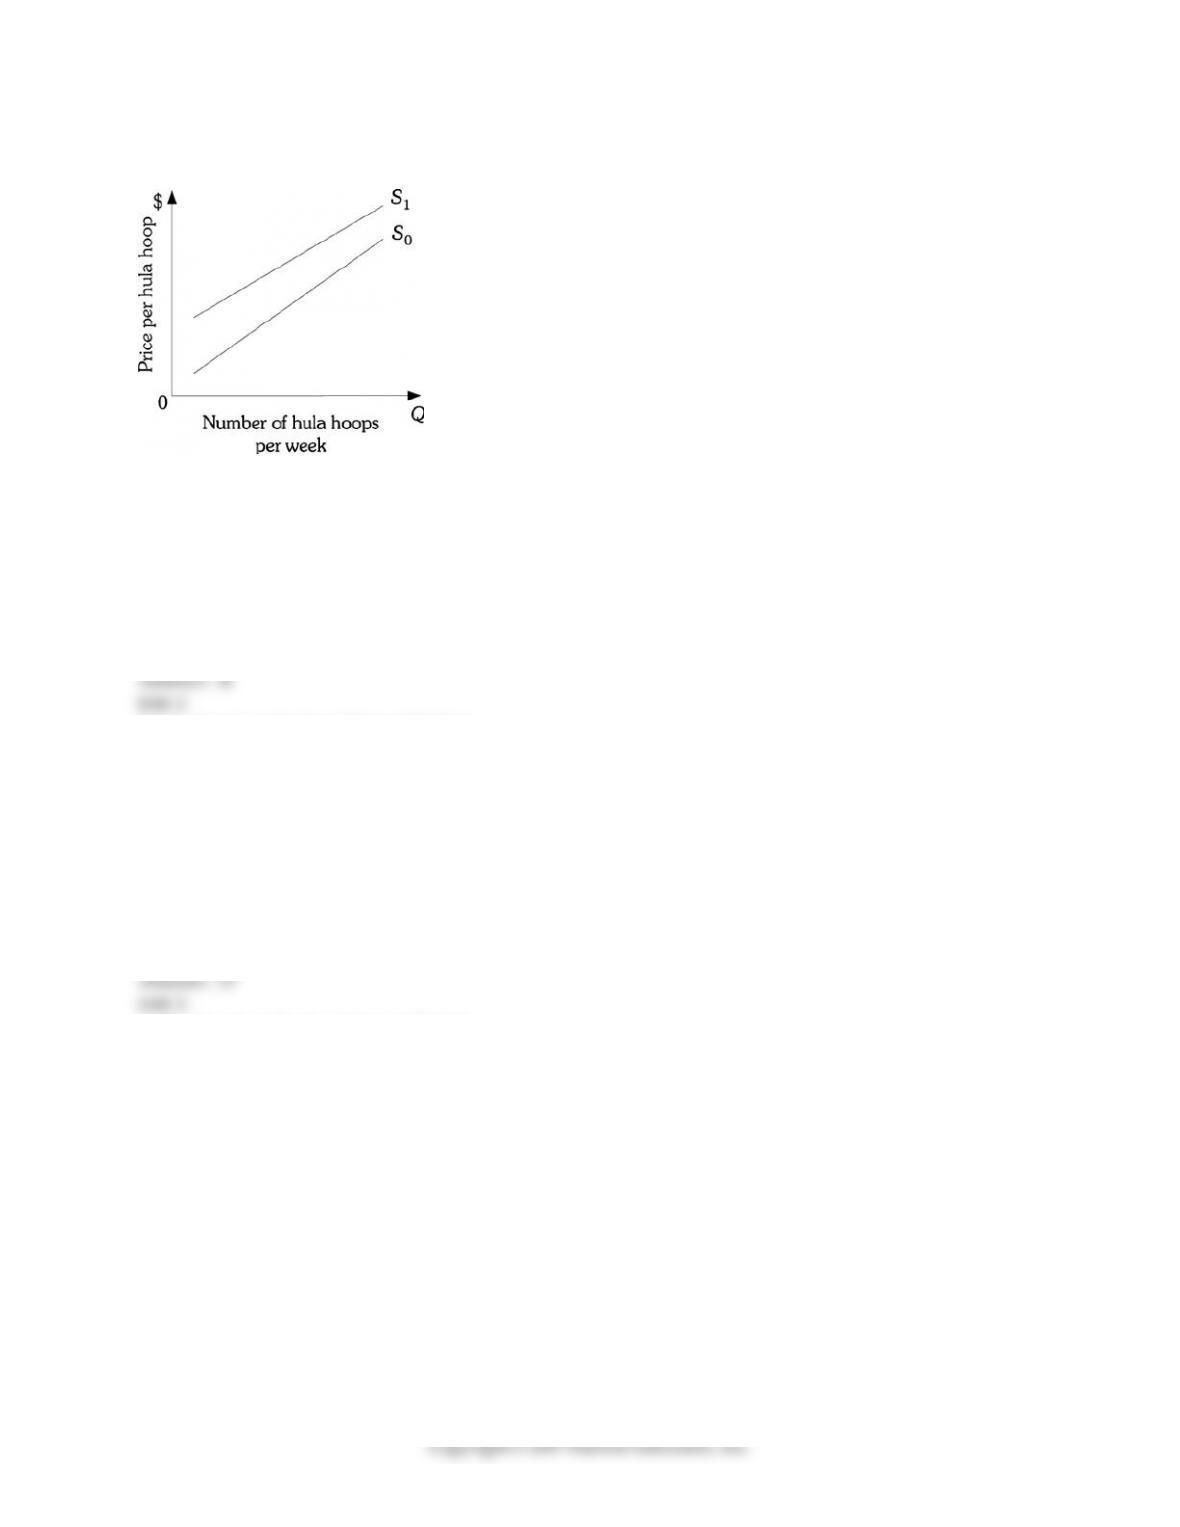
Refer to the information provided in Figure 3.12 below to answer the question(s) that follow.
Figure 3.12
26) Refer to Figure 3.12. The supply curve for hula hoops shifts from S0 to S1. This could be caused by
A) a decrease in the price of hula hoops.
B) a decrease in the number of firms selling hula hoops.
C) a decrease in the demand for hula hoops.
D) either B or C.
Topic: Supply in Product / Output Markets
Skill: Conceptual
AACSB: Reflective Thinking
Learning Outcome: Micro-4
27) Refer to Figure 3.12. The supply curve for hula hoops shifts from S1 to S0. This could be caused by
A) a decrease in the price of hula hoops.
B) a decrease in the number of firms selling hula hoops.
C) a decrease in the demand for hula hoops.
D) a decrease in the cost of producing hula hoops.
Topic: Supply in Product / Output Markets
Skill: Conceptual
AACSB: Reflective Thinking
Learning Outcome: Micro-4
48
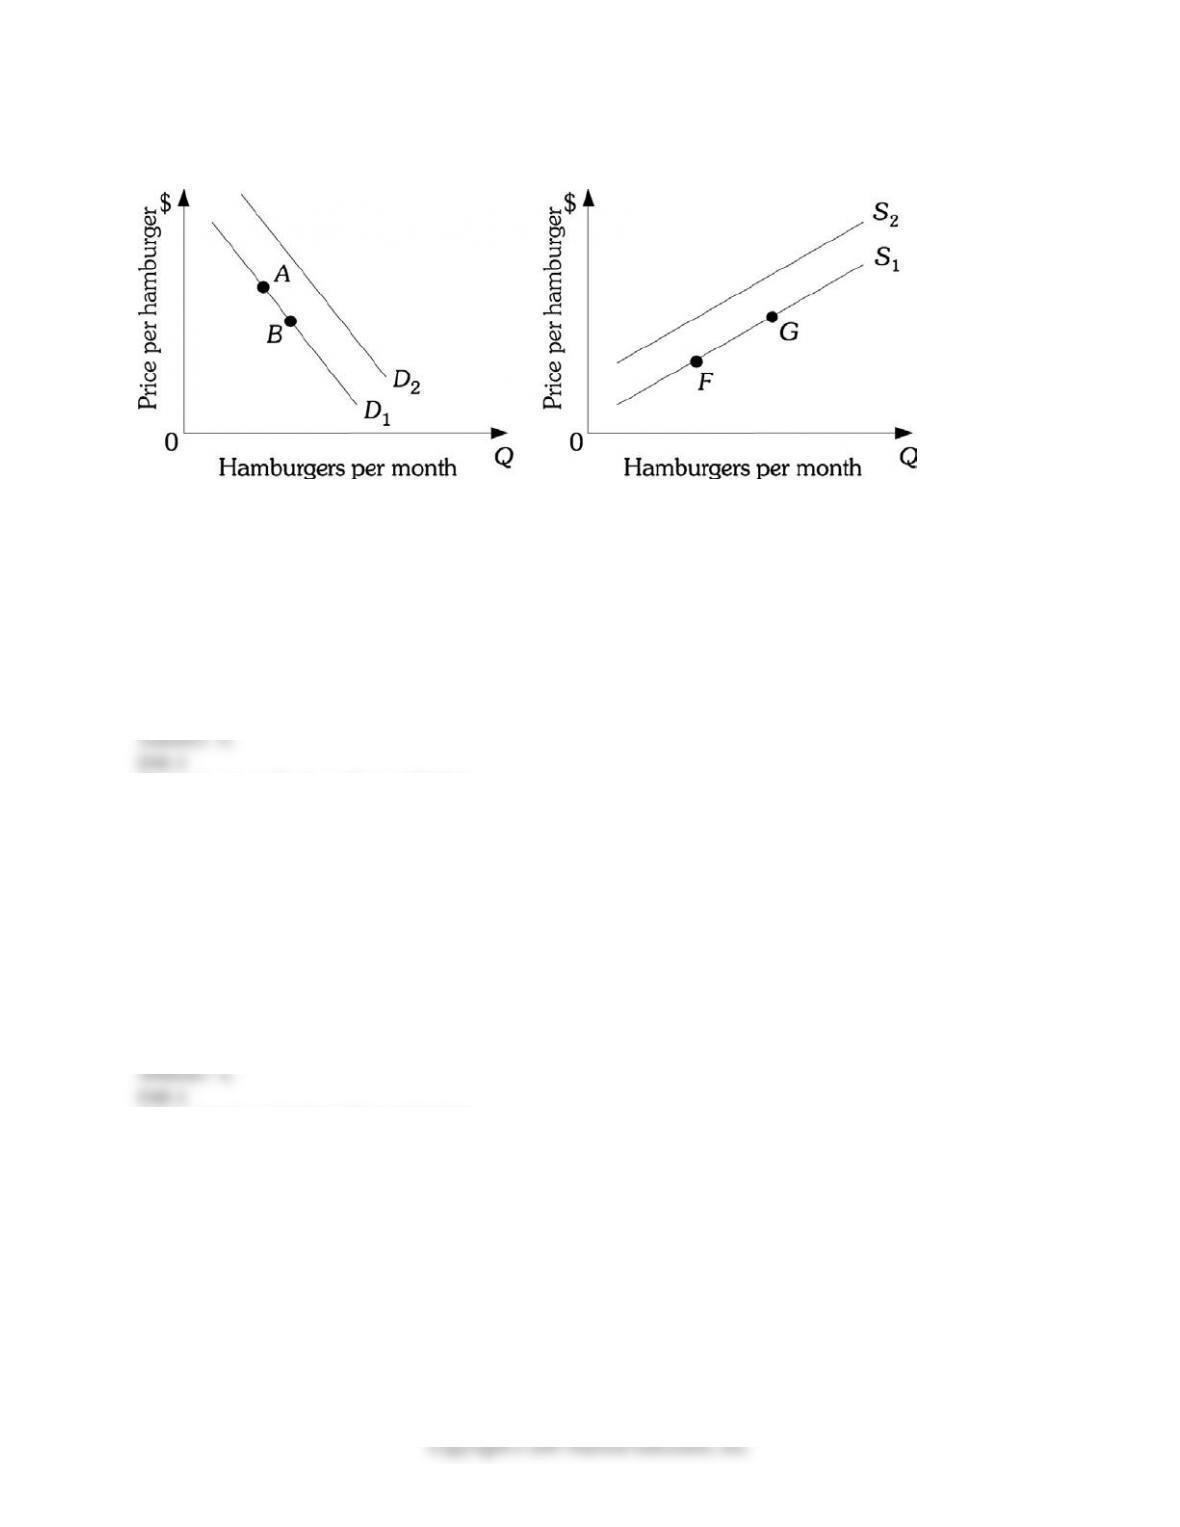
Refer to the information provided in Figure 3.13 below to answer the question(s) that follow.
Figure 3.13
28) Refer to Figure 3.13. Assume hamburgers are a normal good. An increase in income will cause a
movement from
A) Point A to Point B.
B) Point G to Point F.
C) D1 to D2.
D) S1 to S2.
Topic: Supply in Product / Output Markets
Skill: Analytical
AACSB: Analytical Thinking
Learning Outcome: Micro-4
29) Refer to Figure 3.13. Assume hamburgers and hot dogs are substitutes. A decrease in the price of hot
dogs will cause a movement from
A) Point A to Point B.
B) Point F to Point G.
C) D2 to D1.
D) D1 to D2.
Topic: Supply in Product / Output Markets
Skill: Analytical
AACSB: Analytical Thinking
Learning Outcome: Micro-4

49
30) Refer to Figure 3.13. Assume hamburgers and french fries are complements. A decrease in the price of
french fries will cause a movement from
A) Point A to Point B.
B) Point G to Point F.
C) D1 to D2.
D) S2 to S1.
Topic: Supply in Product / Output Markets
Skill: Analytical
AACSB: Analytical Thinking
Learning Outcome: Micro-4
31) Refer to Figure 3.13. An increase in the number of cattle ranchers will cause a movement from
A) Point B to Point A.
B) Point G to Point F.
C) D2 to D1.
D) S2 to S1.
Topic: Supply in Product / Output Markets
Skill: Analytical
AACSB: Analytical Thinking
Learning Outcome: Micro-4
32) Refer to Figure 3.13. Assume hamburgers are a normal good. A decrease in income will cause a
movement from
A) Point A to Point B.
B) Point G to Point F.
C) D2 to D1.
D) S2 to S1.
Topic: Supply in Product / Output Markets
Skill: Analytical
AACSB: Analytical Thinking
Learning Outcome: Micro-4

50
33) Refer to Figure 3.13. Assume hamburgers and hot dogs are substitutes. An increase in the price of hot
dogs will cause a movement from
A) Point B to Point A.
B) Point F to Point G.
C) D2 to D1.
D) D1 to D2.
Topic: Supply in Product / Output Markets
Skill: Analytical
AACSB: Analytical Thinking
Learning Outcome: Micro-4
34) Refer to Figure 3.13. Assume hamburgers and french fries are complements. An increase in the price
of french fries will cause a movement from
A) Point A to Point B.
B) Point B to Point A.
C) D2 to D1.
D) D1 to D2.
Topic: Supply in Product / Output Markets
Skill: Analytical
AACSB: Analytical Thinking
Learning Outcome: Micro-4
35) Refer to Figure 3.13. A decrease in the number of cattle ranchers will cause a movement from
A) Point A to Point B.
B) Point G to Point F.
C) D2 to D1.
D) S1 to S2.
Topic: Supply in Product / Output Markets
Skill: Analytical
AACSB: Analytical Thinking
Learning Outcome: Micro-4
36) According to the law of ________, there is a positive relationship between price and ________.
A) supply; the change in supply
B) supply; the quantity supplied
C) demand; quantity demanded
D) demand; change in demand
Topic: Supply in Product / Output Markets
Skill: Definition
Learning Outcome: Micro-1