59
Copyright © 2017 Pearson Education, Inc.
34) If the slope of a straight line is –2. and if X (the variable on the horizontal axis) decreases by 8, then Y
(the variable on the vertical axis) will
A) increase by 4.
B) decrease by 4.
C) increase by 16.
D) decrease by 16.
Topic: Appendix: How to Read and Understand Graphs
Skill: Analytical
AACSB: Analytical Thinking
Learning Outcome: Micro-2
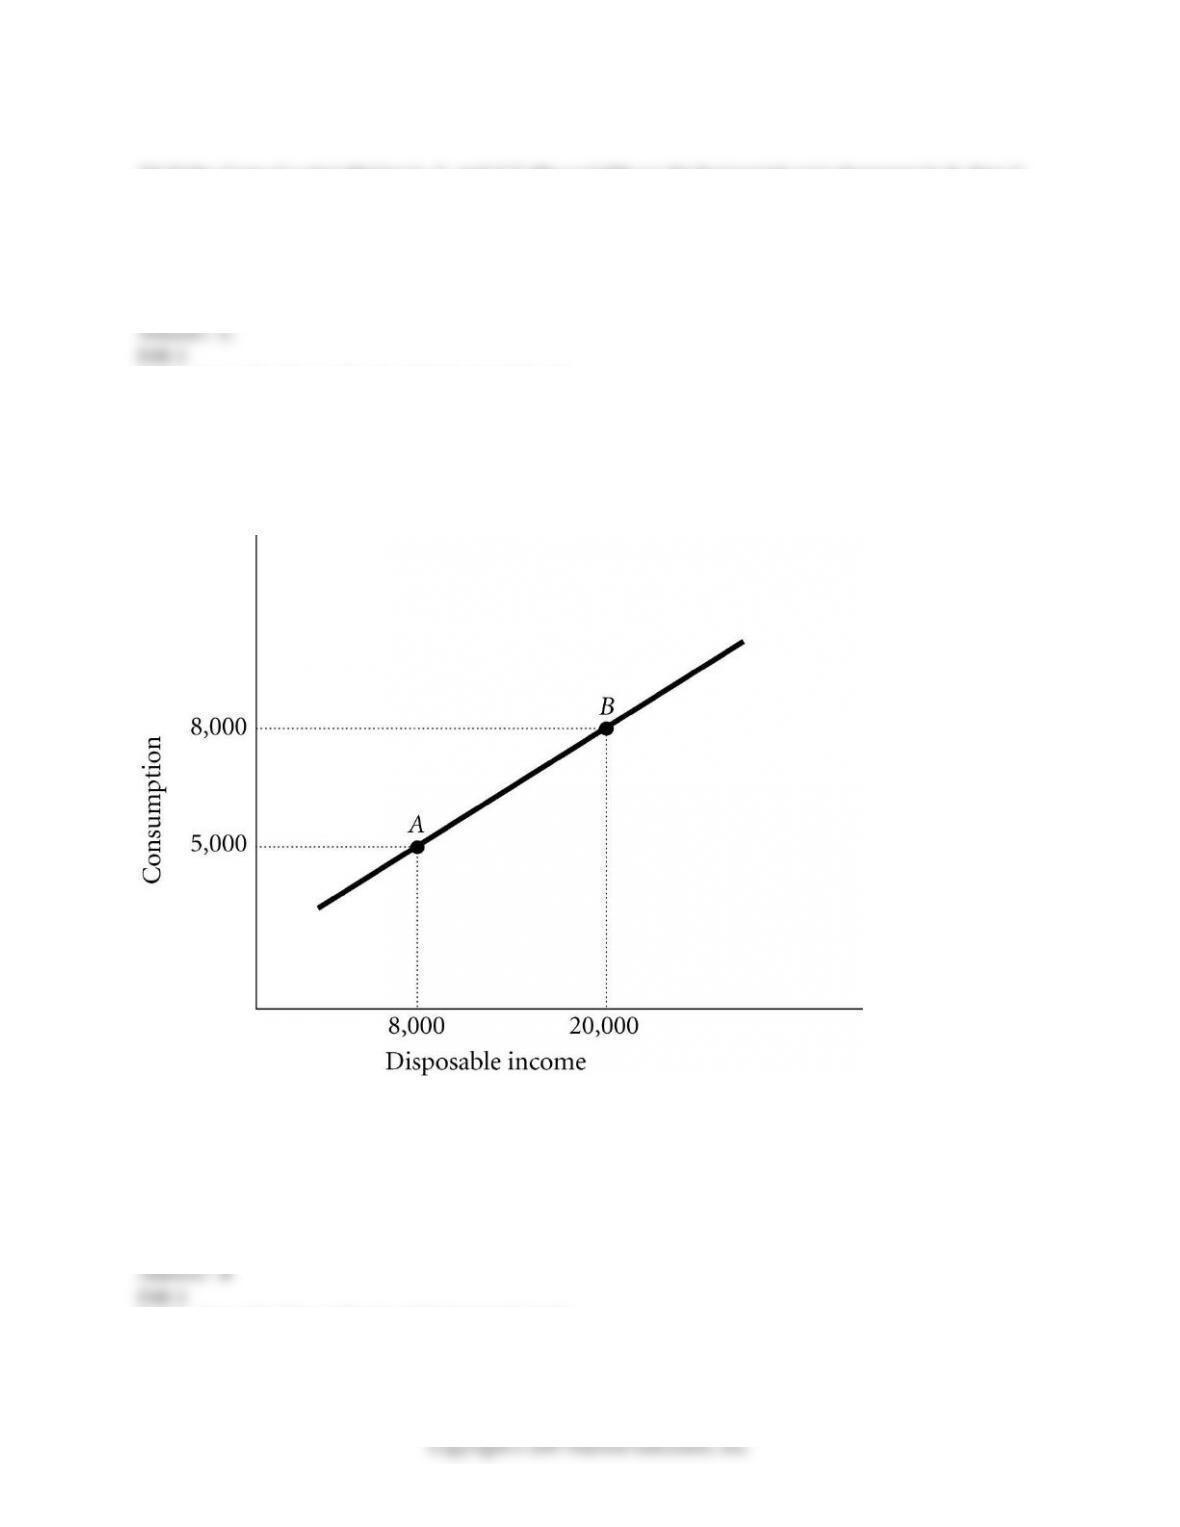
Refer to the information provided in Figure 1.6 below to answer the question(s) that follow.
Figure 1.6
35) Refer to Figure 1.6. The slope of the line between Points A and B is
A) positive and increasing.
B) positive and constant.
C) negative and decreasing.
D) negative and constant.
Topic: Appendix: How to Read and Understand Graphs
Skill: Analytical
AACSB: Analytical Thinking
Learning Outcome: Micro-2
60
36) Refer to Figure 1.6. The slope of the line between Points A and B is
A) 0.25.
B) 4.
C) –0.25.
D) –4.
Topic: Appendix: How to Read and Understand Graphs
Skill: Analytical
AACSB: Analytical Thinking
Learning Outcome: Micro-2
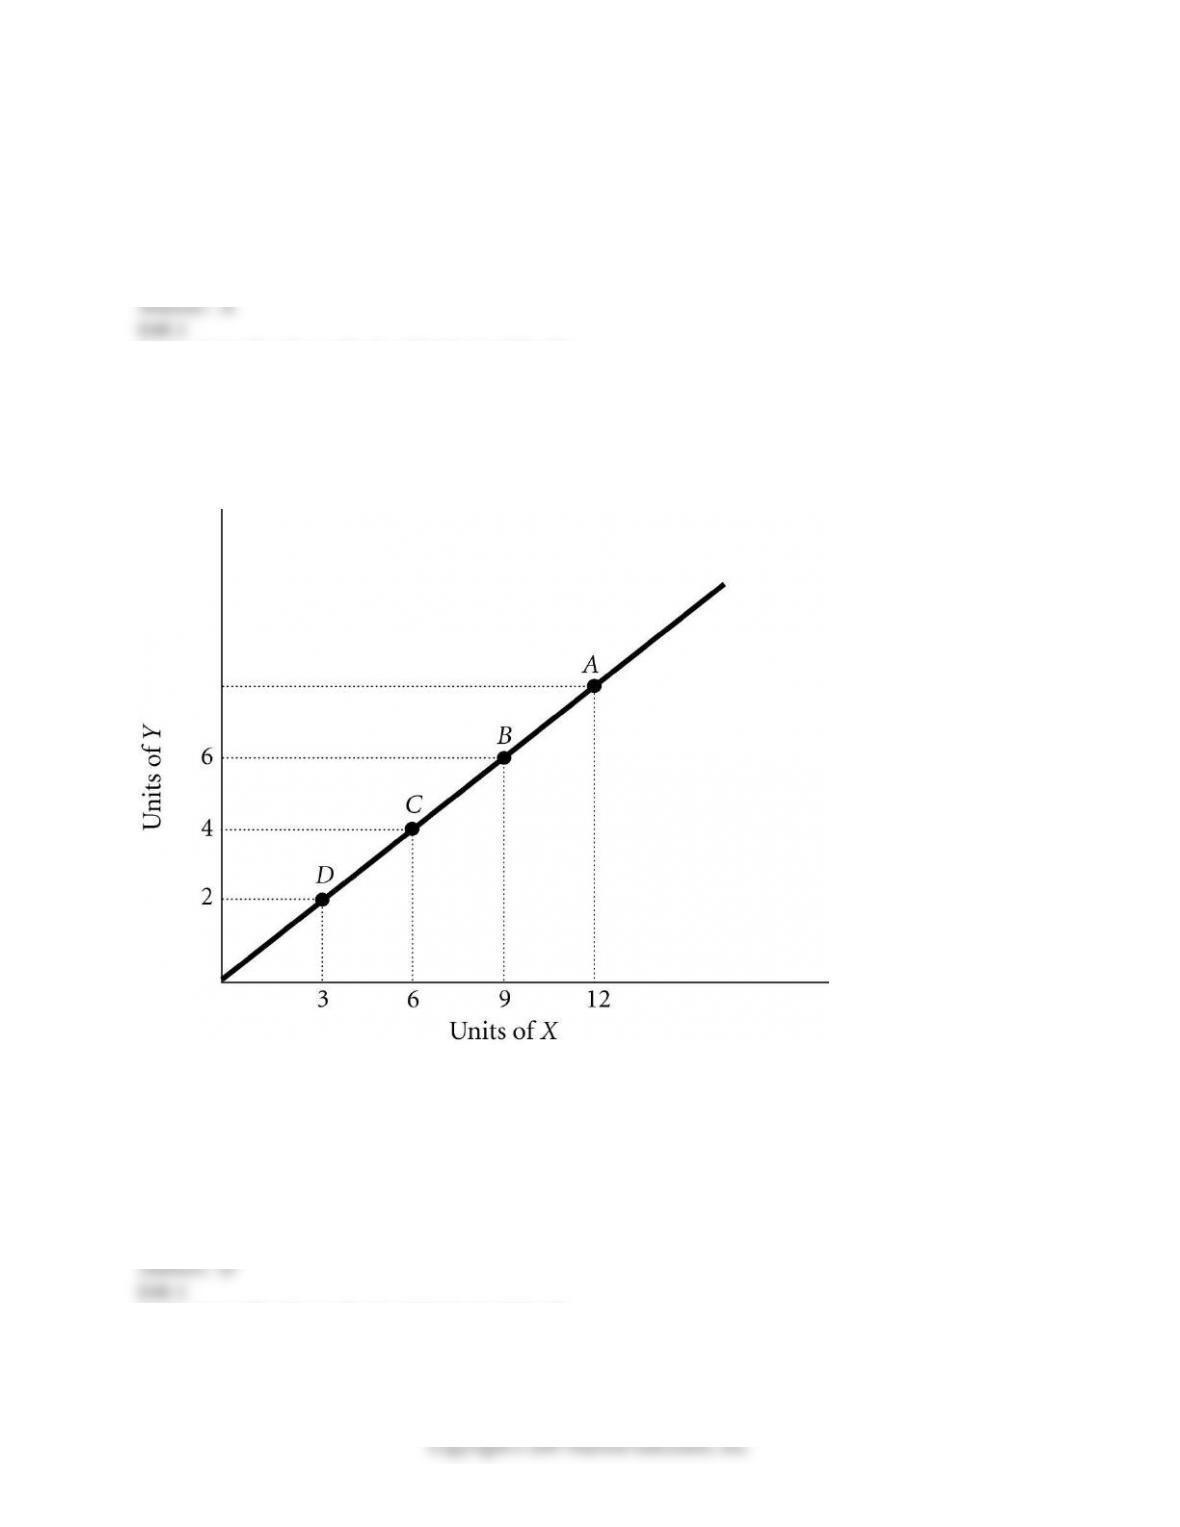
Refer to the information provided in Figure 1.7 below to answer the question(s) that follow.
Figure 1.7
37) Refer to Figure 1.7. The slope of the line is
A) negative.
B) increasing at a decreasing rate.
C) decreasing at an increasing rate.
D) positive.
Topic: Appendix: How to Read and Understand Graphs
Skill: Analytical
AACSB: Analytical Thinking
Learning Outcome: Micro-2

61
38) Refer to Figure 1.7. The slope of the line between Points D and B is
A) 1.5.
B) 0.67.
C) –0.67.
D) –1.5.
Topic: Appendix: How to Read and Understand Graphs
Skill: Analytical
AACSB: Analytical Thinking
Learning Outcome: Micro-2
39) Refer to Figure 1.7. The slope of the line between Points A and B is
A) 1.5.
B) 0.67.
C) –0.67.
D) –1.5.
Topic: Appendix: How to Read and Understand Graphs
Skill: Analytical
AACSB: Analytical Thinking
Learning Outcome: Micro-2
40) Refer to Figure 1.7. If a 45–degree line were also graphed, it would ________ the line shown on the
graph.
A) lie above
B) lie below
C) cross
D) The answer is indeterminate from this information.
Topic: Appendix: How to Read and Understand Graphs
Skill: Analytical
AACSB: Analytical Thinking
Learning Outcome: Micro-2
41) Refer to Figure 1.7. At Point A, what is the value of Y?
A) 2
B) 4
C) 6
D) 8
Topic: Appendix: How to Read and Understand Graphs
Skill: Analytical
AACSB: Analytical Thinking
Learning Outcome: Micro-2

62
42) Refer to Figure 1.7. At Point A, the slope of the line is 0.67, so at Point C, the slope would be
A) greater than 0.67.
B) less than 0.67.
C) equal to 0.67.
D) indeterminate from this information.
Topic: Appendix: How to Read and Understand Graphs
Skill: Analytical
AACSB: Analytical Thinking
Learning Outcome: Micro-2
43) The slope of a straight line
A) is always positive.
B) must first increase then decrease.
C) is not constant.
D) is constant.
Topic: Appendix: How to Read and Understand Graphs
Skill: Conceptual
AACSB: Reflective Thinking
Learning Outcome: Micro-2
44) The slope of a vertical line is
A) negative.
B) zero.
C) continually changing.
D) infinite.
Topic: Appendix: How to Read and Understand Graphs
Skill: Conceptual
AACSB: Reflective Thinking
Learning Outcome: Micro-2
45) If the slope of a straight line is 5 and if X (the variable on the horizontal axis) increases by 4, then Y
(the variable on the vertical axis) will
A) decrease by 0.8.
B) decrease by 20.
C) increase by 0.8.
D) increase by 20.
Topic: Appendix: How to Read and Understand Graphs
Skill: Analytical
AACSB: Analytical Thinking
Learning Outcome: Micro-2

63
46) If the slope of a straight line is 6 and if Y (the variable on the vertical axis) decreases by 60, then X (the
variable on the horizontal axis)
A) increases by 10.
B) decreases by 10.
C) increases by 600.
D) decreases by 600.
Topic: Appendix: How to Read and Understand Graphs
Skill: Analytical
AACSB: Analytical Thinking
Learning Outcome: Micro-2
47) The slope of a horizontal line is
A) zero.
B) infinite.
C) continually changing.
D) negative.
Topic: Appendix: How to Read and Understand Graphs
Skill: Conceptual
AACSB: Reflective Thinking
Learning Outcome: Micro-2
48) Dividing the change in quantity on the Y–axis by the change in quantity on the X–axis calculates the
slope of a line.
Topic: Appendix: How to Read and Understand Graphs
Skill: Definition
Learning Outcome: Micro-2
49) A graph illustrating how one variable changes over time is a Cartesian coordinate system.
Topic: Appendix: How to Read and Understand Graphs
Skill: Definition
Learning Outcome: Micro-2
50) If as the variable on the Y–axis rises, the variable on the X–axis rises, the relationship between X and Y
is said to be a positive relationship.
Topic: Appendix: How to Read and Understand Graphs
Skill: Definition
Learning Outcome: Micro-2

64
51) If as the variable on the Y–axis falls, the variable on the X–axis rises, the relationship between X and Y
is said to be a negative relationship.
Topic: Appendix: How to Read and Understand Graphs
Skill: Definition
Learning Outcome: Micro-2
52) The slope of a straight line is not constant unless the line is vertical or horizontal.
Topic: Appendix: How to Read and Understand Graphs
Skill: Definition
Learning Outcome: Micro-2
53) Dividing the change in quantity on the horizontal axis by the change in quantity on the vertical axis
calculates the slope of a line.
Topic: Appendix: How to Read and Understand Graphs
Skill: Definition
Learning Outcome: Micro-2
54) A graph illustrating how a variable changes over time is called a time–series graph.
Topic: Appendix: How to Read and Understand Graphs
Skill: Definition
Learning Outcome: Micro-2
55) As the variable on the Y–axis falls, the variable on the X–axis falls. The relationship between X and Y is
said to be positive.
Topic: Appendix: How to Read and Understand Graphs
Skill: Definition
Learning Outcome: Micro-2
56) As the variable on the Y–axis rises, the variable on the X–axis falls. The relationship between X and Y
is said to be positive.
Topic: Appendix: How to Read and Understand Graphs
Skill: Definition
Learning Outcome: Micro-2

65
57) The slope of a curved line is constant.
Topic: Appendix: How to Read and Understand Graphs
Skill: Conceptual
AACSB: Reflective Thinking
Learning Outcome: Micro-2