
51
Copyright © 2017 Pearson Education, Inc.
7) Refer to Figure 1.3. The slope of the line between Points D and C is
A) –3.
B) –0.33.
C) 0.33.
D) 3.
Topic: Appendix: How to Read and Understand Graphs
Skill: Analytical
AACSB: Analytical Thinking
Learning Outcome: Micro-2
8) Refer to Figure 1.3. If a 45–degree line were also graphed, the existing line shown on the graph would
________ it.
A) lie above
B) lie below
C) cross
D) The answer is indeterminate from this information.
Topic: Appendix: How to Read and Understand Graphs
Skill: Analytical
AACSB: Analytical Thinking
Learning Outcome: Micro-2
9) Refer to Figure 1.3. At Point A, what is the value of Y?
A) 10
B) 12
C) 15
D) indeterminate from this information
Topic: Appendix: How to Read and Understand Graphs
Skill: Analytical
AACSB: Analytical Thinking
Learning Outcome: Micro-2
10) Refer to Figure 1.3. At Point A the slope of the line is 3, so at Point D the slope would be
A) greater than 3.
B) less than 3.
C) equal to 3.
D) indeterminate from this information.
Topic: Appendix: How to Read and Understand Graphs
Skill: Analytical
AACSB: Analytical Thinking
Learning Outcome: Micro-2
52
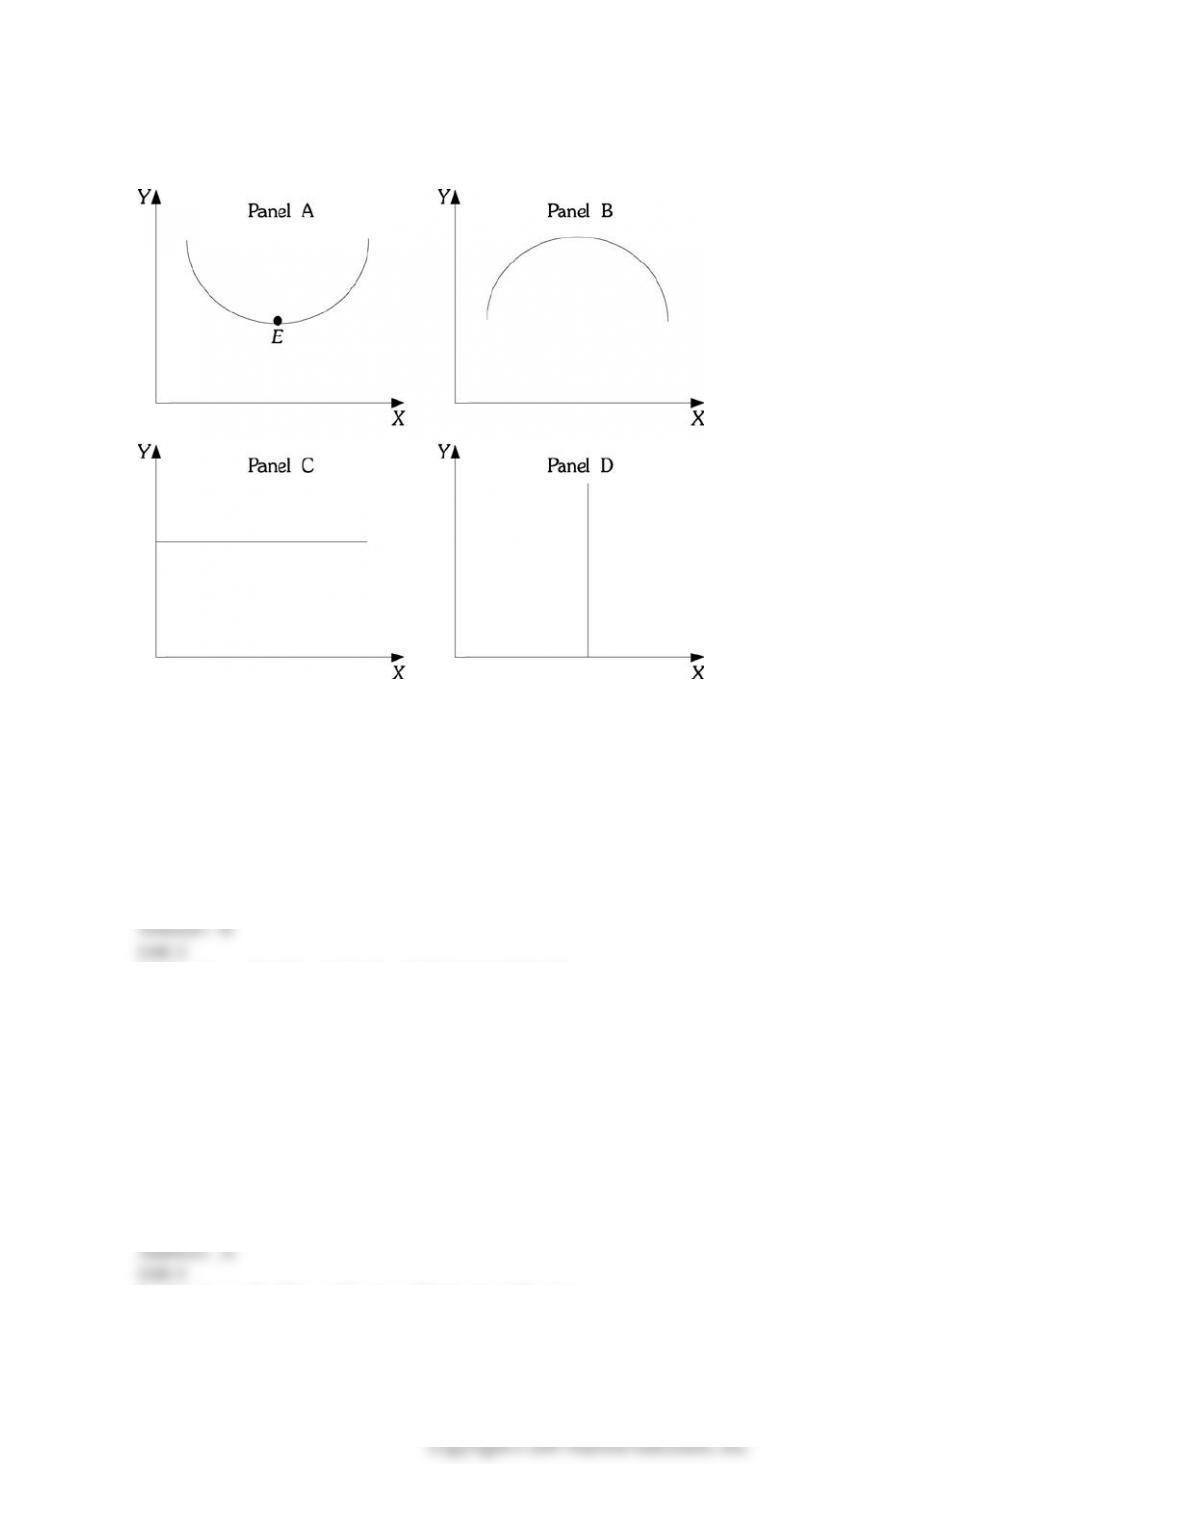
Refer to the information provided in Figure 1.4 below to answer the question(s) that follow.
Figure 1.4
11) Refer to Figure 1.4. Which of the Panels shows a curve or line that has a slope that is first positive and
then negative?
A) A
B) B
C) C
D) D
Topic: Appendix: How to Read and Understand Graphs
Skill: Analytical
AACSB: Analytical Thinking
Learning Outcome: Micro-2
12) Refer to Figure 1.4. Which of the Panels shows a curve or line that has a slope that is negative and
then positive?
A) A
B) B
C) C
D) D
Topic: Appendix: How to Read and Understand Graphs
Skill: Analytical
AACSB: Analytical Thinking
Learning Outcome: Micro-2

53
13) Refer to Figure 1.4. Which of the Panels shows a curve or line that has a zero slope throughout?
A) A
B) B
C) C
D) D
Topic: Appendix: How to Read and Understand Graphs
Skill: Analytical
AACSB: Analytical Thinking
Learning Outcome: Micro-2
14) Refer to Figure 1.4. Which of the Panels shows a curve or line that has an infinite slope throughout?
A) A
B) B
C) C
D) D
Topic: Appendix: How to Read and Understand Graphs
Skill: Analytical
AACSB: Analytical Thinking
Learning Outcome: Micro-2
15) Refer to Figure 1.4. At Point E in Panel A, the slope is
A) zero.
B) infinite.
C) negative.
D) indeterminate from this information.
Topic: Appendix: How to Read and Understand Graphs
Skill: Analytical
AACSB: Analytical Thinking
Learning Outcome: Micro-2
16) Refer to Figure 1.4. Panel A shows a curve which has a slope that is
A) first positive, then zero, and then negative.
B) first negative, then zero, and then positive.
C) infinite throughout.
D) zero throughout.
Topic: Appendix: How to Read and Understand Graphs
Skill: Analytical
AACSB: Analytical Thinking
Learning Outcome: Micro-2

54
17) Refer to Figure 1.4. Panel B shows a curve which has a slope that is
A) first positive and then negative.
B) first negative and then positive.
C) infinite throughout.
D) zero throughout.
Topic: Appendix: How to Read and Understand Graphs
Skill: Analytical
AACSB: Analytical Thinking
Learning Outcome: Micro-2
18) Refer to Figure 1.4. Panel C shows a curve which has a slope that is
A) first positive and then negative.
B) first negative and then positive.
C) infinite throughout.
D) zero throughout.
Topic: Appendix: How to Read and Understand Graphs
Skill: Analytical
AACSB: Analytical Thinking
Learning Outcome: Micro-2
19) Refer to Figure 1.4. Panel D shows a curve which has a slope that is
A) first positive and then negative.
B) first negative and then positive.
C) infinite throughout.
D) zero throughout.
Topic: Appendix: How to Read and Understand Graphs
Skill: Analytical
AACSB: Analytical Thinking
Learning Outcome: Micro-2
20) Refer to Figure 1.4. At Point E in panel A, the slope is
A) infinite.
B) zero.
C) negative.
D) indeterminate from this information.
Topic: Appendix: How to Read and Understand Graphs
Skill: Analytical
AACSB: Analytical Thinking
Learning Outcome: Micro-2

55
21) The slope of a non–linear curve
A) is always positive.
B) must first increase then decrease.
C) is not constant.
D) is constant.
Topic: Appendix: How to Read and Understand Graphs
Skill: Fact
Learning Outcome: Micro-2
22) The slope of a horizontal line is
A) negative.
B) zero.
C) continually changing.
D) infinite.
Topic: Appendix: How to Read and Understand Graphs
Skill: Fact
Learning Outcome: Micro-2
23) If the slope of a straight line is 4 and if X (the variable on the horizontal axis) increases by 12, then Y
(the variable on the vertical axis) will
A) decrease by 3.
B) decrease by 0.33.
C) increase by 3.
D) increase by 48.
Topic: Appendix: How to Read and Understand Graphs
Skill: Analytical
AACSB: Analytical Thinking
Learning Outcome: Micro-2
24) If the slope of a straight line is 4 and if Y (the variable on the vertical axis) decreases by 20, then X (the
variable on the horizontal axis)
A) increases by 5.
B) decreases by 5.
C) increases by 80.
D) decreases by 80.
Topic: Appendix: How to Read and Understand Graphs
Skill: Analytical
AACSB: Analytical Thinking
Learning Outcome: Micro-2
56
25) The slope of a vertical line is
A) zero.
B) infinite.
C) continually changing.
D) negative.
Topic: Appendix: How to Read and Understand Graphs
Skill: Fact
Learning Outcome: Micro-2
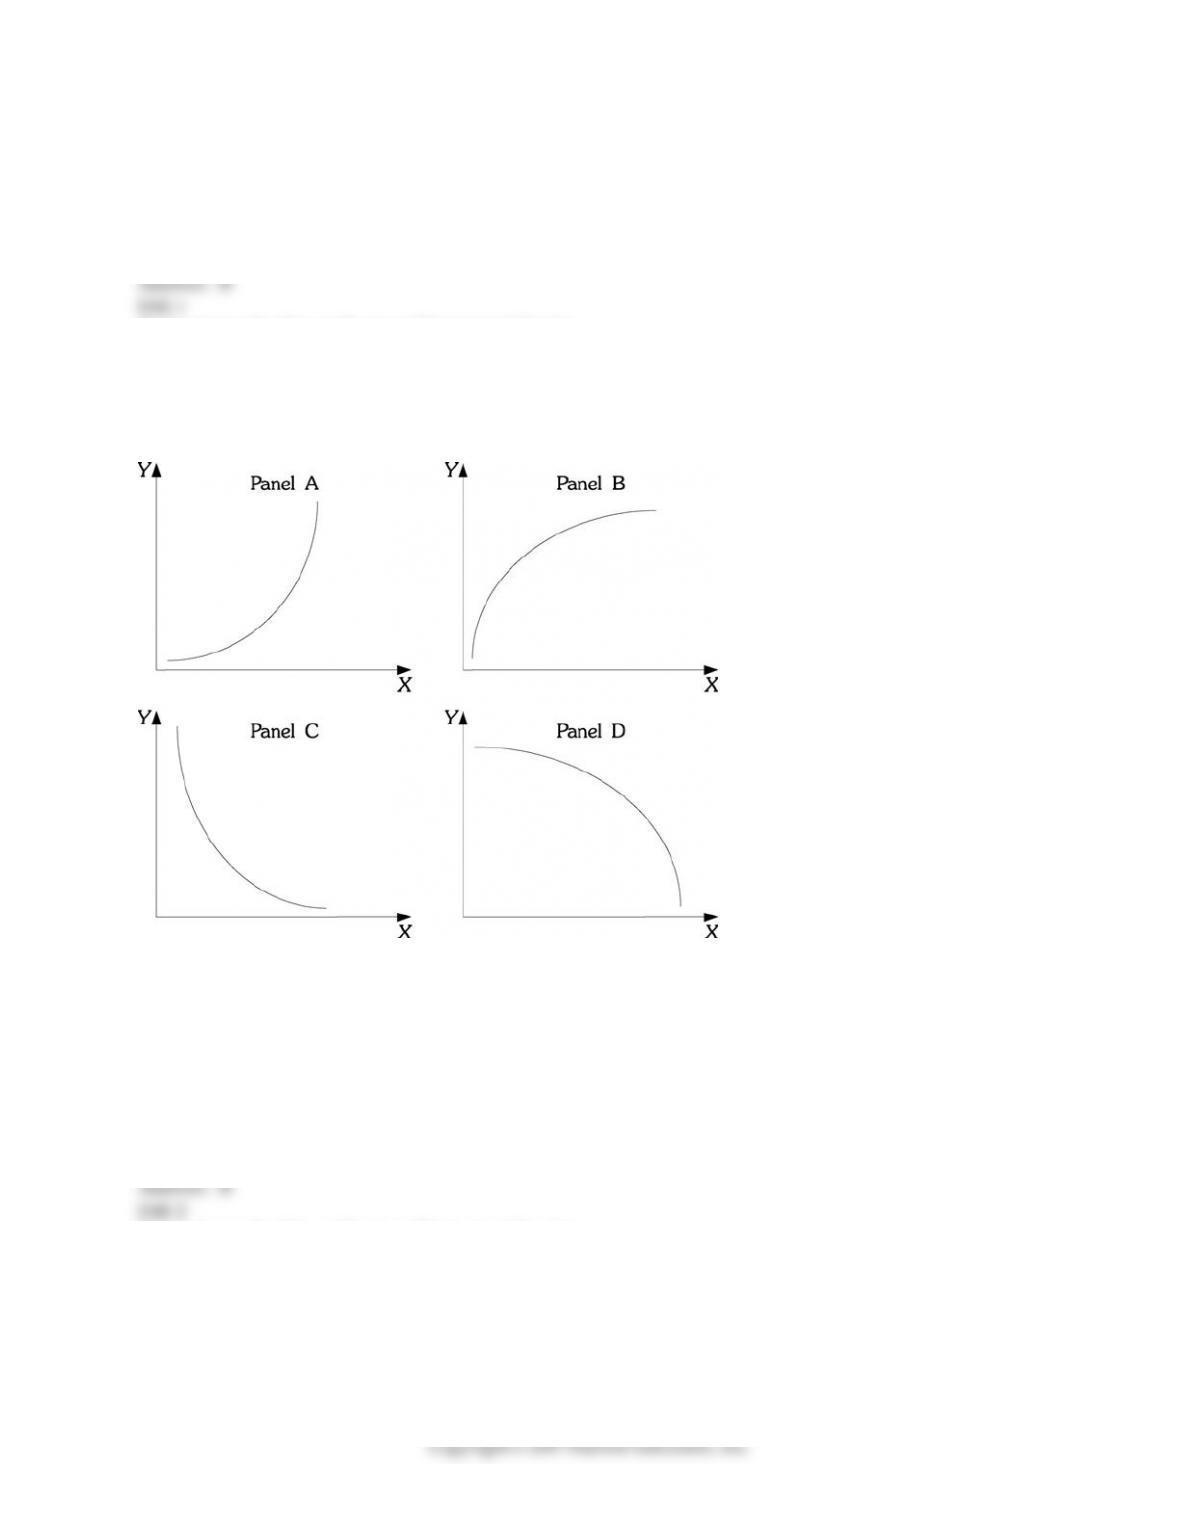
Refer to the information provided in Figure 1.5 below to answer the question(s) that follow.
Figure 1.5
26) Refer to Figure 1.5. Which of the Panels shows a curve or line that has a slope that is positive and
decreasing?
A) A
B) B
C) C
D) D
Topic: Appendix: How to Read and Understand Graphs
Skill: Analytical
AACSB: Analytical Thinking
Learning Outcome: Micro-2

57
27) Refer to Figure 1.5. Which of the Panels shows a curve or line that has a slope that is positive and
increasing?
A) A
B) B
C) C
D) D
Topic: Appendix: How to Read and Understand Graphs
Skill: Analytical
AACSB: Analytical Thinking
Learning Outcome: Micro-2
28) Refer to Figure 1.5. As income increases, consumption increases, but for each additional increase in
income, consumption increases by a larger and larger amount. If consumption is graphed on the vertical
axis and income is graphed on the horizontal axis, the relationship between consumption and income
would look like which of the following Panels?
A) A
B) B
C) C
D) D
Topic: Appendix: How to Read and Understand Graphs
Skill: Analytical
AACSB: Analytical Thinking
Learning Outcome: Micro-2
29) Refer to Figure 1.5. In many industries, as firms produce additional units, average costs of production
decline as the firm produces an additional unit, but average costs declines by a smaller and smaller
amount as production continues to increase. If output is graphed on the horizontal axis and average costs
are graphed on the vertical axis, the relationship between average costs and output would be like which
of the following Panels?
A) A
B) B
C) C
D) D
Topic: Appendix: How to Read and Understand Graphs
Skill: Analytical
AACSB: Analytical Thinking
Learning Outcome: Micro-2

58
30) Refer to Figure 1.5. Panel A shows a curve with a slope that is
A) positive and increasing.
B) positive and decreasing.
C) negative and increasing.
D) negative and decreasing.
Topic: Appendix: How to Read and Understand Graphs
Skill: Analytical
AACSB: Analytical Thinking
Learning Outcome: Micro-2
31) Refer to Figure 1.5. Panel B shows a curve with a slope that is
A) positive and increasing.
B) positive and decreasing.
C) negative and increasing.
D) negative and decreasing.
Topic: Appendix: How to Read and Understand Graphs
Skill: Analytical
AACSB: Analytical Thinking
Learning Outcome: Micro-2
32) Refer to Figure 1.5. As income decreases, consumption decreases by a decreasing amount. If
consumption is graphed on the vertical axis and income is graphed on the horizontal axis, the
relationship between consumption and income would look like which of the following Panels?
A) A
B) B
C) C
D) D
Topic: Appendix: How to Read and Understand Graphs
Skill: Analytical
AACSB: Analytical Thinking
Learning Outcome: Micro-2
33) Refer to Figure 1.5. As firms produce additional units, average costs declines by a smaller and smaller
amount. If output is graphed on the horizontal axis and average costs are graphed on the vertical axis, the
relationship between average costs and output would be like which of the following Panels?
A) A
B) B
C) C
D) D
Topic: Appendix: How to Read and Understand Graphs
Skill: Analytical
AACSB: Analytical Thinking
Learning Outcome: Micro-2