22–17
PROBLEM 22B-2
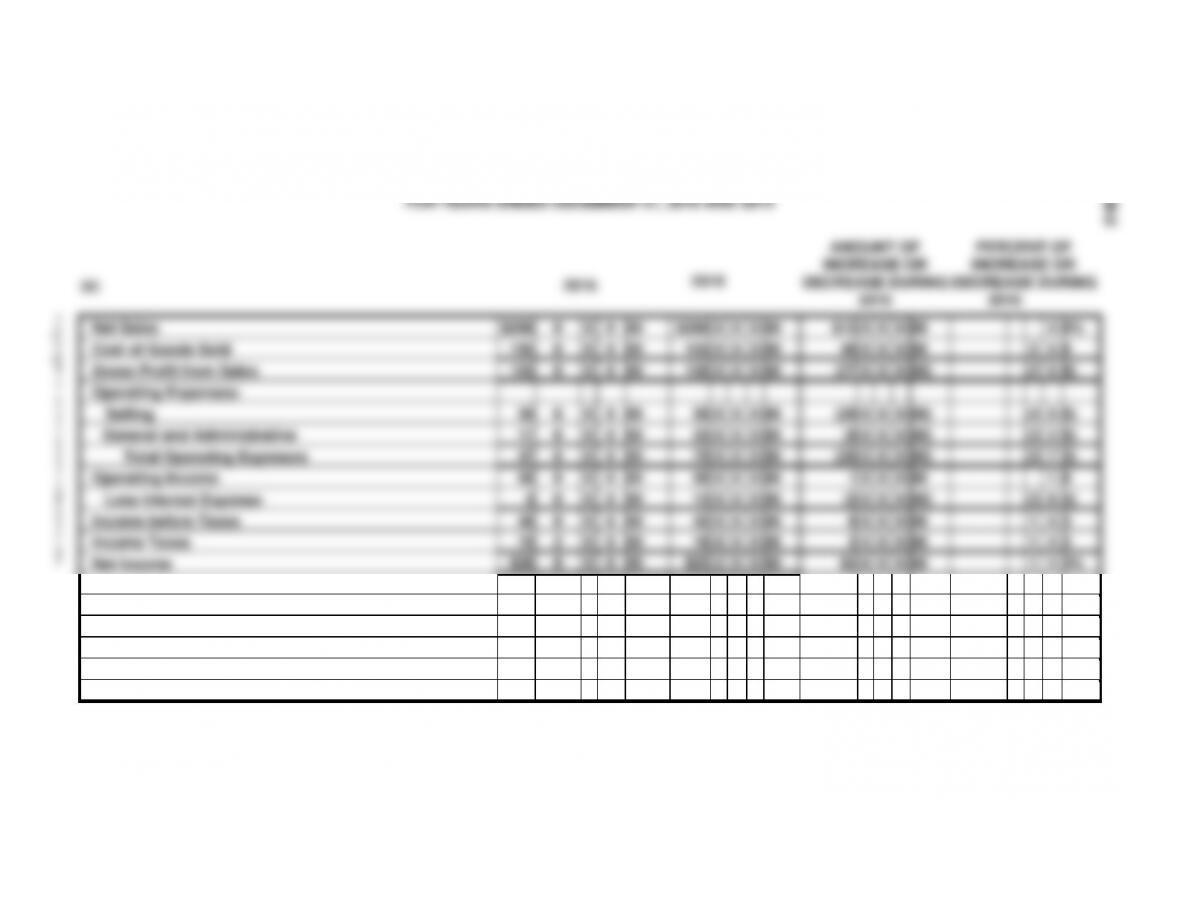
CARNEY COMPANY
COMPARATIVE INCOME STATEMENT
FOR YEARS ENDED DECEMBER 31, 2016 AND 2015
PERCENT OF
INCREASE OR
DECREASE DURING
2016
6%
8
8)
0)
0)
3)
8
5)
3
3
3%
4
5
0
0
2
7
1
8
4
4
4
2
(2
(4
(3
(3
(3
1
1
1
AMOUNT OF
INCREASE OR
DECREASE DURING
2016
00
00
00)
00)
00)
00)
00
00)
00
00
00
0
0
0
0
0
0
0
0
0
0
0
0
0
0
0
0
0
0
0
0
0
0
0
0
0
0
0
0
0
0
0
4
6
$13
40
(27
(20
(8
(28
1
(5
6
2
$3
00
00
00
00
00
00
00
00
00
00
00
0
0
0
0
0
0
0
0
0
0
0
2015
0
0
0
0
0
0
0
0
0
0
0
0
0
0
0
0
0
0
0
0
8
2
$285
155
130
50
25
75
55
13
42
16
$25
00
00
00
00
00
00
00
00
00
00
00
2016
2016
0
0
0
0
0
0
0
0
0
0
0
0
0
0
0
0
0
0
0
0
0
0
0
0
0
0
0
0
0
0
0
2
8
$298
195
103
30
17
47
56
8
48
19
$28
(a)
Net Sales
Cost of Goods Sold
Gross Profit from Sales
Operating Expenses:
Selling
General and Administrative
Total Operating Expenses
Operating Income
Less Interest Expense
Income before Taxes
Income Taxes
Net Income
PROBLEM 22B-2 (CONTINUED)
(b)
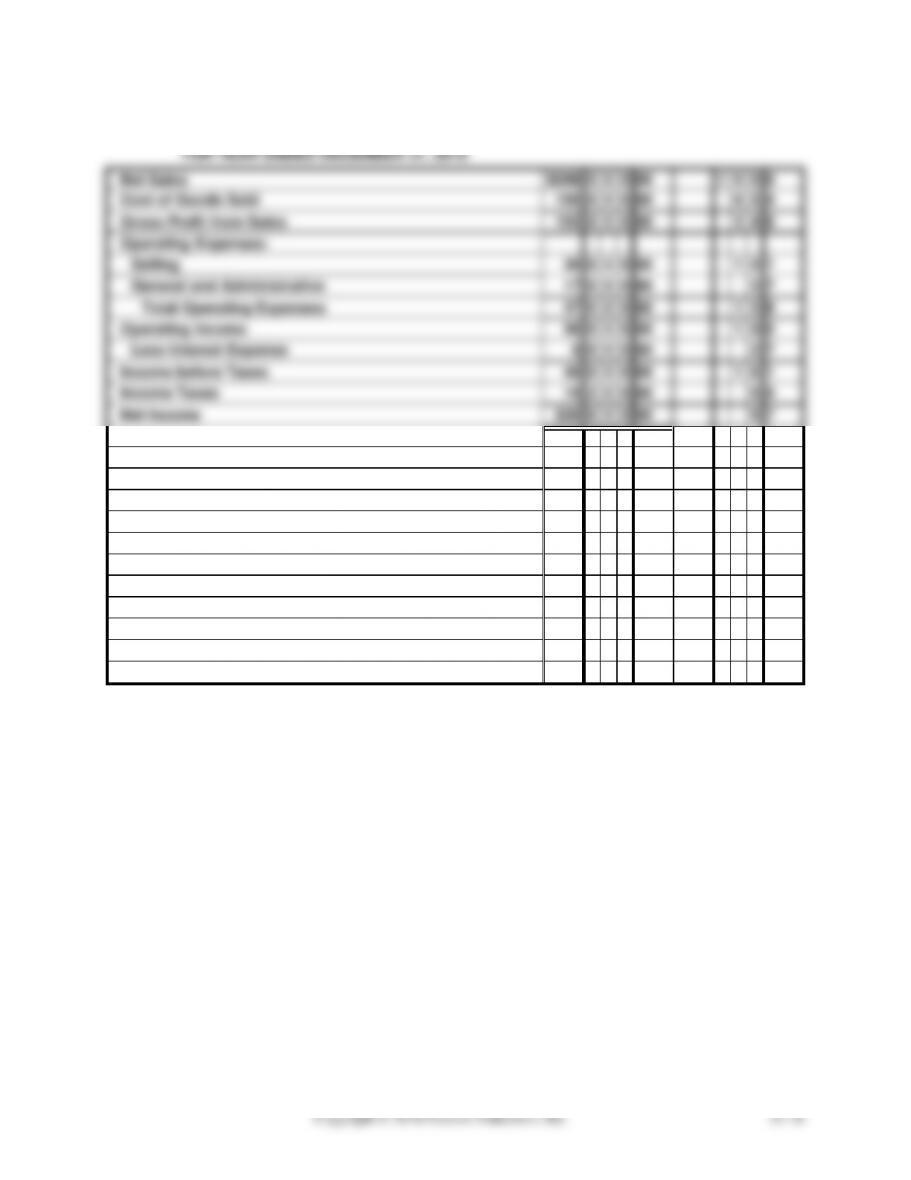
CARNEY COMPANY
INCOME STATEMENT
FOR YEAR ENDED DECEMBER 31, 2016
2016
Percent
Net Sales
$298
0
0
0
00
1
0
0
0
Cost of Goods Sold
195
0
0
0
00
6
5
4
Gross Profit from Sales
103
0
0
0
00
3
4
6
Operating Expenses:
Selling
30
0
0
0
00
1
0
1
General and Administrative
17
0
0
0
00
5
7
Total Operating Expenses
47
0
0
0
00
1
5
8
Operating Income
56
0
0
0
00
1
8
8
Less Interest Expense
8
0
0
0
00
2
7
Income before Taxes
48
0
0
0
00
1
6
1
Income Taxes
19
2
0
0
00
6
4
Net Income
$28
8
0
0
00
9
7
PROBLEM 22B-2 (CONCLUDED)
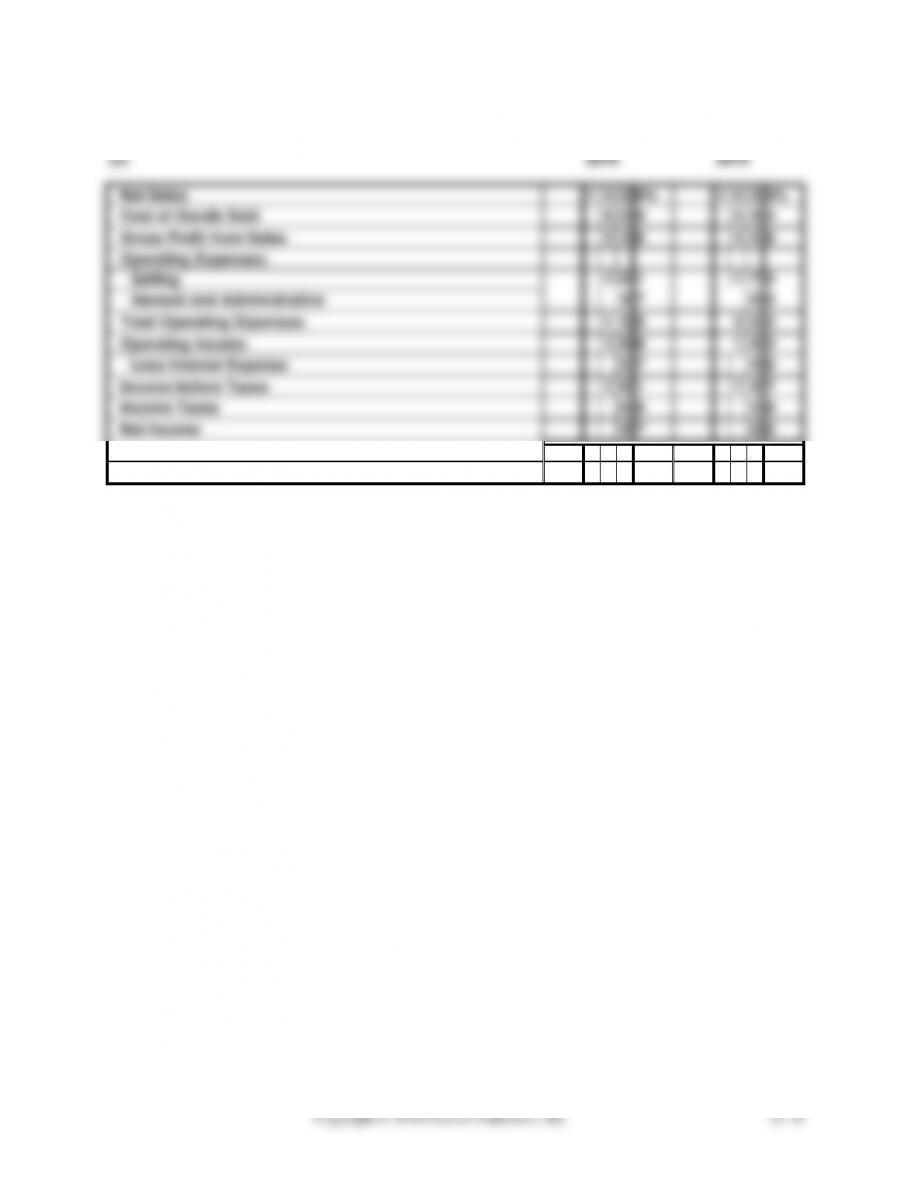
CARNEY COMPANY
COMMON SIZE COMPARATIVE INCOME STATEMENT
YEARS ENDED DECEMBER 31, 2016 AND 2015
(c)
2016
2015
Net Sales
1
0
0
0%
1
0
0
0%
Cost of Goods Sold
6
5
4
5
4
4
Gross Profit from Sales
3
4
6
4
5
6
Operating Expenses:
Selling
1
0
1
1
7
5
5
7
8
8
General and Administrative
Total Operating Expenses
1
5
8
2
6
3
Operating Income
1
8
8
1
9
3
Less Interest Expense
2
7
4
6
Income before Taxes
1
6
1
1
4
7
Income Taxes
6
4
5
9
Net Income
9
7
8
8
PROBLEM 22B-3
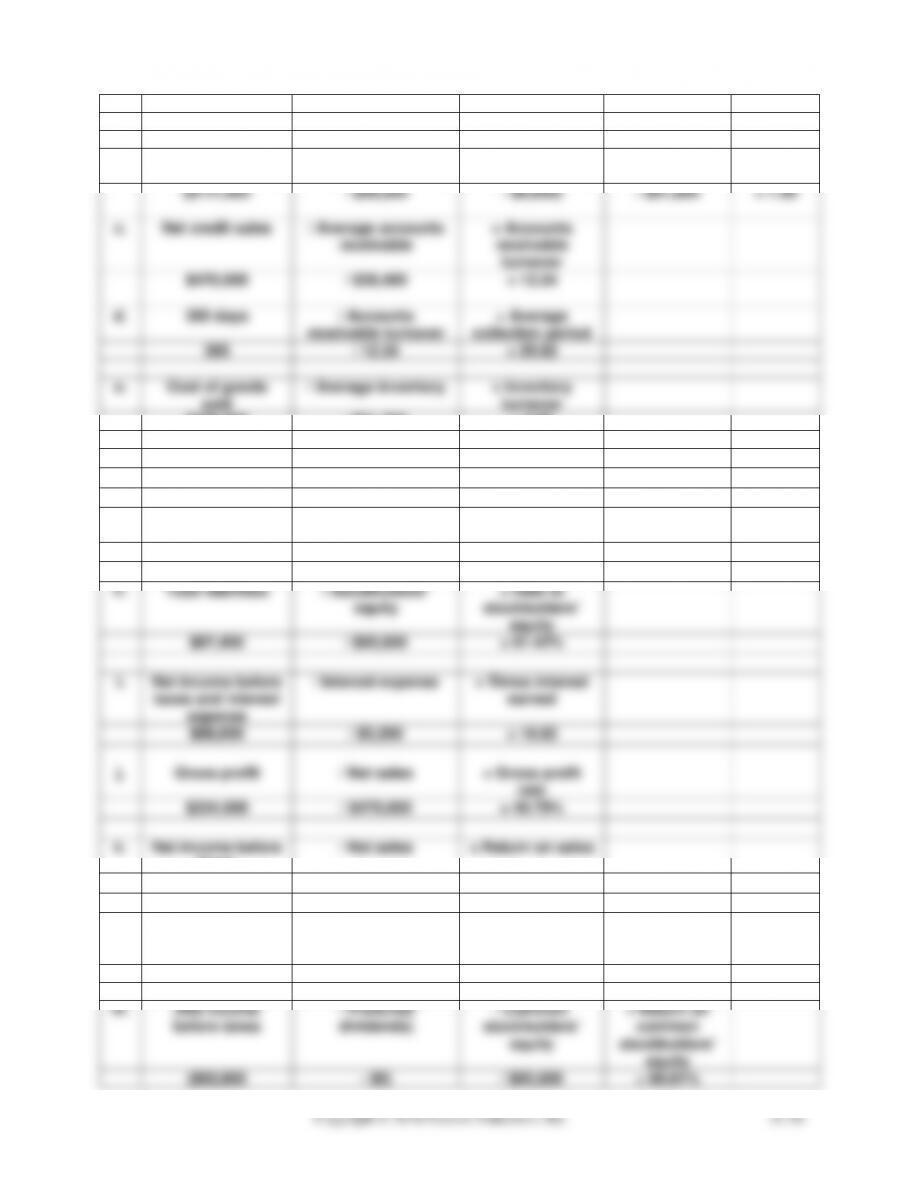
a.
Current assets
/ Current liabilities
= Current ratio
$117,400
/ $51,800
= 2.27
b.
(Current assets
– Merchandise
Inventory
– Prepaid
expenses)
/ Current
liabilities
= Acid
Test ratio
($117,400
– $59,200
– $6,600)
/ $51,800
= 1.00
c.
Net credit sales
/ Average accounts
receivable
= Accounts
receivable
turnover
$470,000
/ $38,400
= 12.24
d.
365 days
/ Accounts
receivable turnover
= Average
collection period
365
/ 12.24
= 29.82
e.
Cost of goods
sold
/ Average inventory
= Inventory
turnover
$236,000
/ $61,200
= 3.86
f.
Net sales
/ Total assets
= Asset turnover
$470,000
/ $183,000
= 2.57
g.
Total liabilities
/ Total assets
= Debt to total
assets
$87,400
/ $183,000
= 47.76%
h.
Total liabilities
/ Stockholders’
equity
= Debt to
stockholders’
equity
$87,400
/ $95,600
= 91.42%
i.
Net income before
taxes and interest
expense
/ Interest expense
= Times interest
earned
$88,000
/ $5,200
= 16.92
j.
Gross profit
/ Net sales
= Gross profit
rate
$234,000
/ $470,000
= 49.79%
k.
Net income before
taxes
/ Net sales
= Return on sales
$82,800
/ $470,000
= 17.62%
l.
Net income before
taxes and interest
expense
/ Total assets
= Return on total
assets
$88,000
/ $183,000
= 48.09%
m.
(Net income
before taxes
– Preferred
dividends)
/ Common
stockholders’
equity
= Return on
common
stockholders’
equity
($82,800
– $0)
/ $95,600
= 86.61%
PROBLEM 22B-4
(a)
Current assets
/ Current liabilities
= Current ratio
2014
$2,700
/ $1,300
= 2.08
2015
$1,700
/ $600
= 2.83
2016
$1,600
/ $800
= 2.00
(Current assets – Merchandise
inventory – Prepaid expenses)
/ Current liabilities
= Acid Test ratio
2014
($2,700 – $600 – $0)
/ $1,300
= 1.62
2015
($1,700 – $280 – $0)
/ $600
= 2.37
2016
($1,600 – $490 – $0)
/ $800
= 1.39
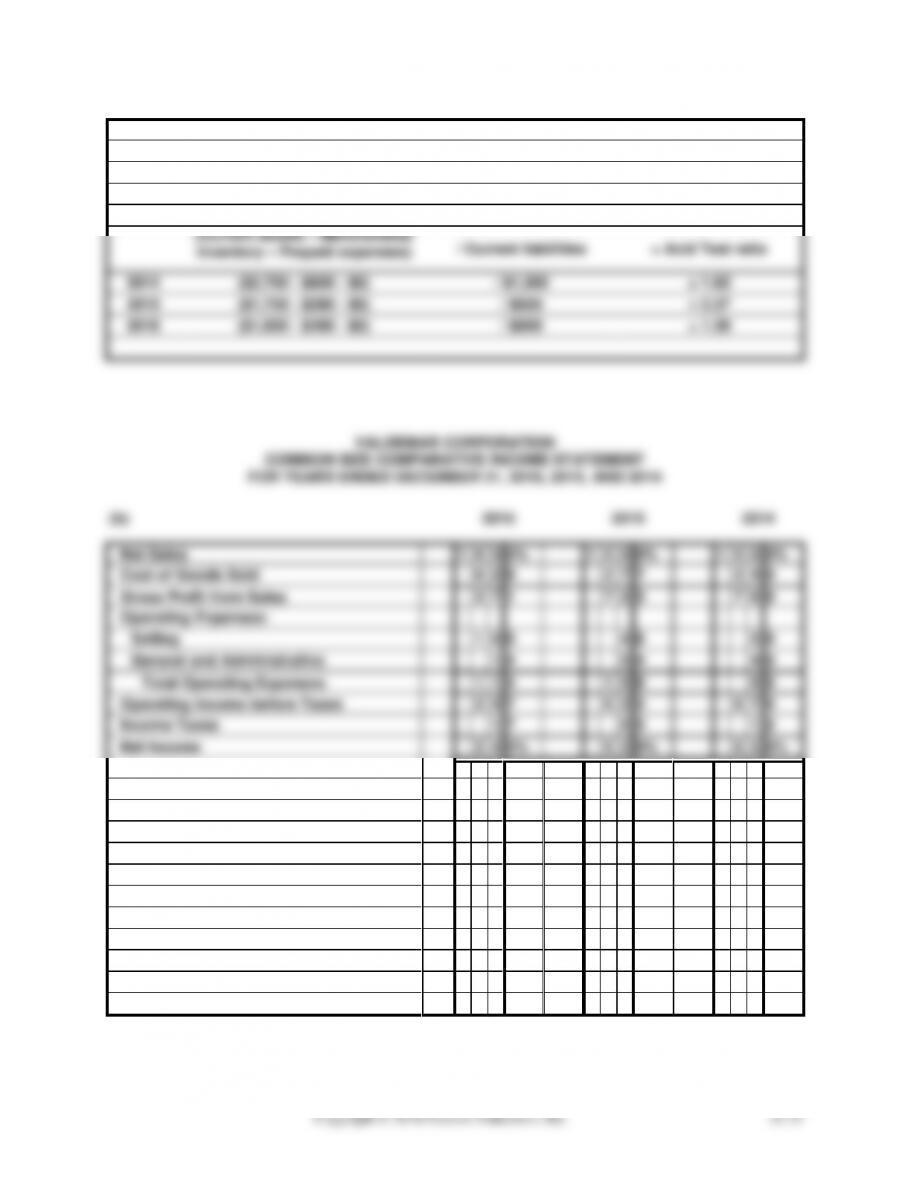
VALDEMAR CORPORATION
COMMON SIZE COMPARATIVE INCOME STATEMENT
FOR YEARS ENDED DECEMBER 31, 2016, 2015, AND 2014
(b)
2016
2015
2014
Net Sales
1
0
0
0%
1
0
0
0%
1
0
0
0%
Cost of Goods Sold
6
2
9
2
7
7
2
4
0
Gross Profit from Sales
3
7
1
7
2
3
7
6
0
Operating Expenses:
Selling
1
0
0
4
6
5
0
General and Administrative
1
4
5
4
4
0
Total Operating Expenses
1
1
4
1
0
0
9
0
Operating Income before Taxes
2
5
7
6
2
3
6
7
0
Income Taxes
1
7
0
3
1
2
Net Income
2
4
0%
6
2
0%
6
5
8%
PROBLEM 22B-4 (CONCLUDED)
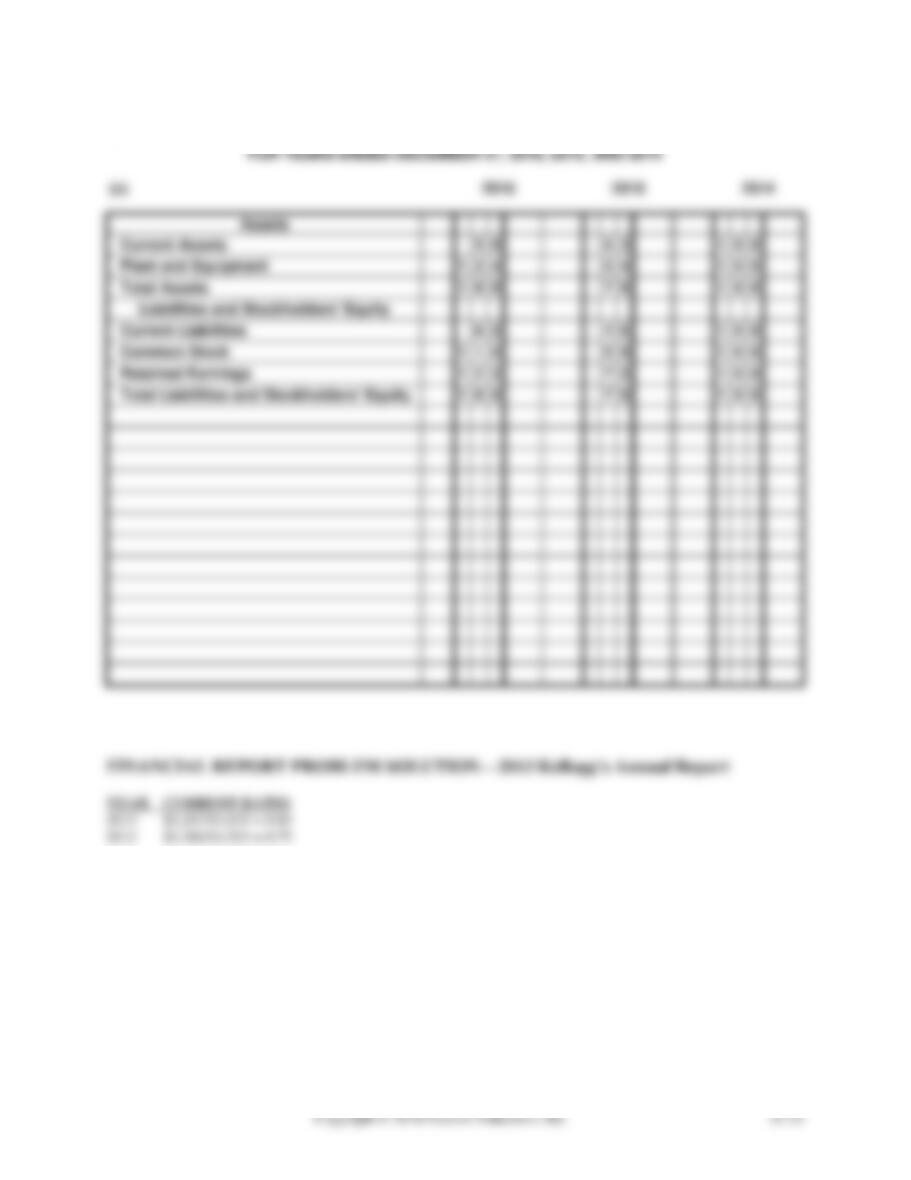
VALDEMAR CORPORATION
BALANCE SHEET
TREND ANALYSIS