PROBLEM 22A-2 (CONCLUDED)
(c)
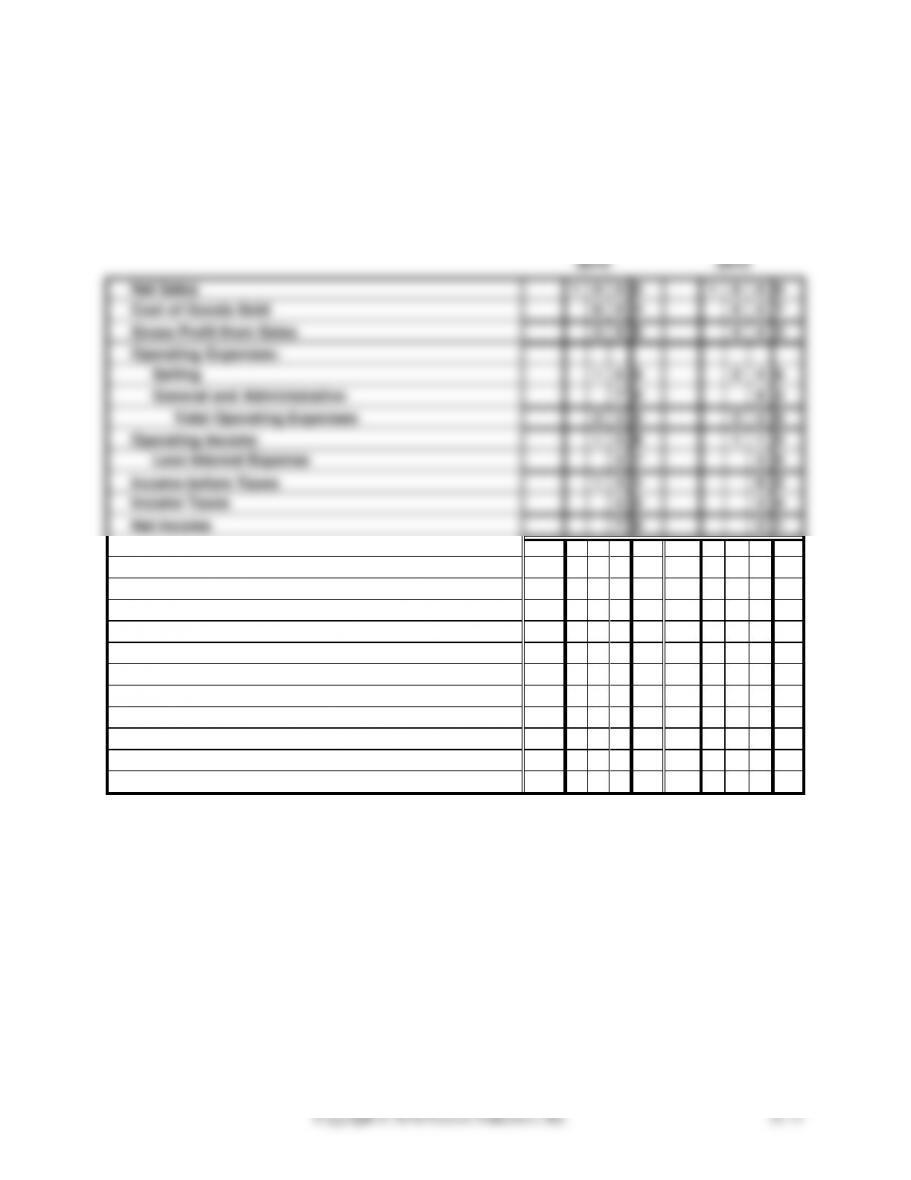
WOOD COMPANY
COMMON-SIZE COMPARATIVE INCOME STATEMENT
FOR YEARS ENDED DECEMBER 31, 2016 AND 2015
2016
2015
Net Sales
1
0
0
0
1
0
0
0
Cost of Goods Sold
6
0
4
5
5
7
Gross Profit from Sales
3
9
6
4
4
3
Operating Expenses:
Selling
1
6
8
2
4
6
General and Administrative
7
0
8
2
Total Operating Expenses
2
3
8
3
2
8
Operating Income
1
5
8
1
1
5
Less Interest Expense
2
7
3
0
Income before Taxes
1
3
1
8
5
Income Taxes
5
2
3
4
Net Income
7
9
5
1
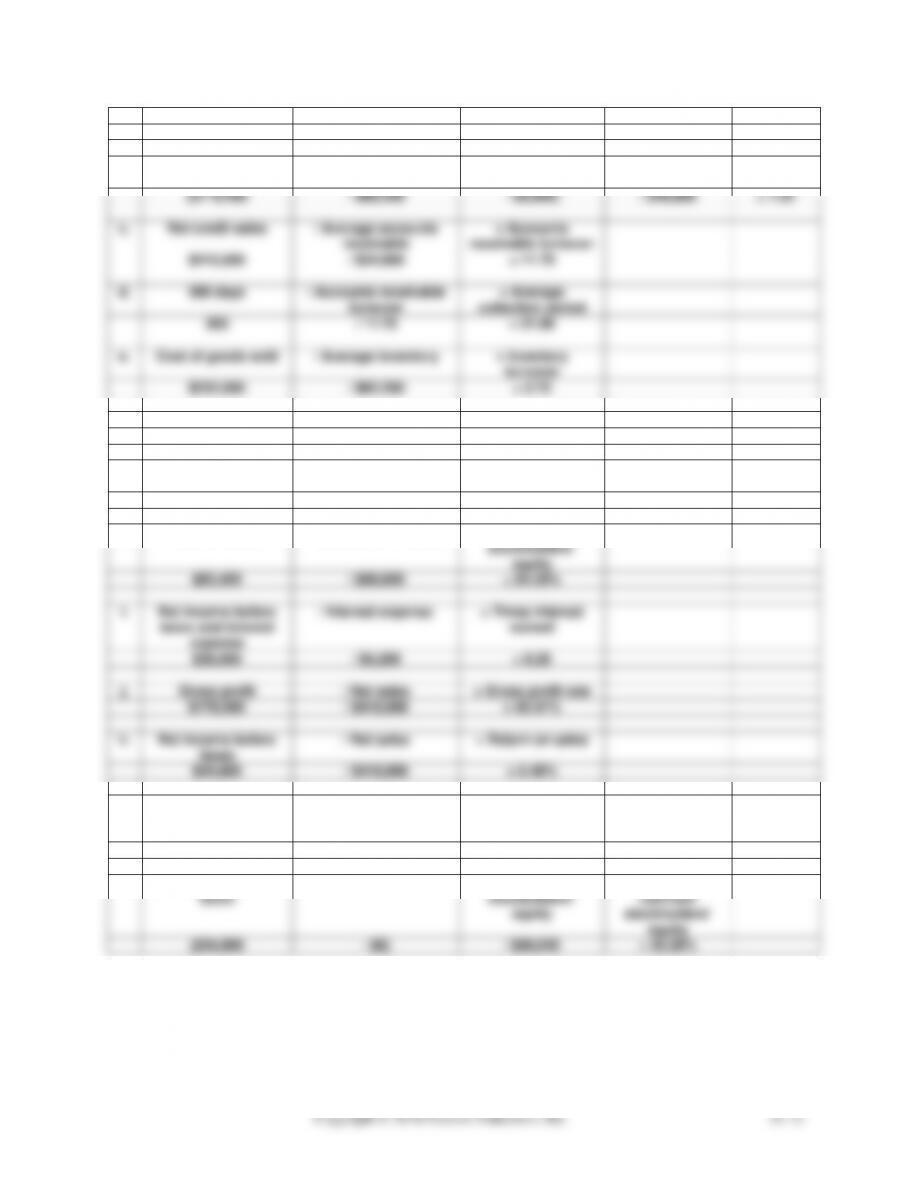
PROBLEM 22A-3
a.
Current assets
/ Current liabilities
= Current ratio
$119,400
/ $48,800
= 2.45
b.
(Current assets
– Merchandise
Inventory
– Prepaid expenses)
/ Current
liabilities
= Acid Test
ratio
($119,400
– $60,200
– $9,600)
/ $48,800
= 1.02
c.
Net credit sales
/ Average accounts
receivable
= Accounts
receivable turnover
$410,000
/ $34,900
= 11.75
d.
365 days
/ Accounts receivable
turnover
= Average
collection period
365
/ 11.75
= 31.06
e.
Cost of goods sold
/ Average inventory
= Inventory
turnover
$232,000
/ $62,200
= 3.73
f.
Net sales
/ Total assets
= Asset turnover
$410,000
/ $182,000
= 2.25
g.
Total liabilities
/ Total assets
= Debt to total
assets
$83,400
/ $182,000
= 45.82%
h.
Total liabilities
/ Stockholders’ equity
= Debt to
stockholders’
equity
$83,400
/ $98,600
= 84.58%
i.
Net income before
taxes and interest
expense
/ Interest expense
= Times interest
earned
$39,000
/ $4,200
= 9.29
j.
Gross profit
/ Net sales
= Gross profit rate
$178,000
/ $410,000
= 43.41%
k.
Net income before
taxes
/ Net sales
= Return on sales
$34,800
/ $410,000
= 8.49%
l.
Net income before
taxes and interest
expense
/ Total assets
= Return on total
assets
$39,000
/ $182,000
= 21.43%
m.
(Net income before
taxes
– Preferred dividends)
/ Common
stockholders’
equity
= Return on
common
stockholders’
equity
($34,800
– $0)
/ $98,600
= 35.29%
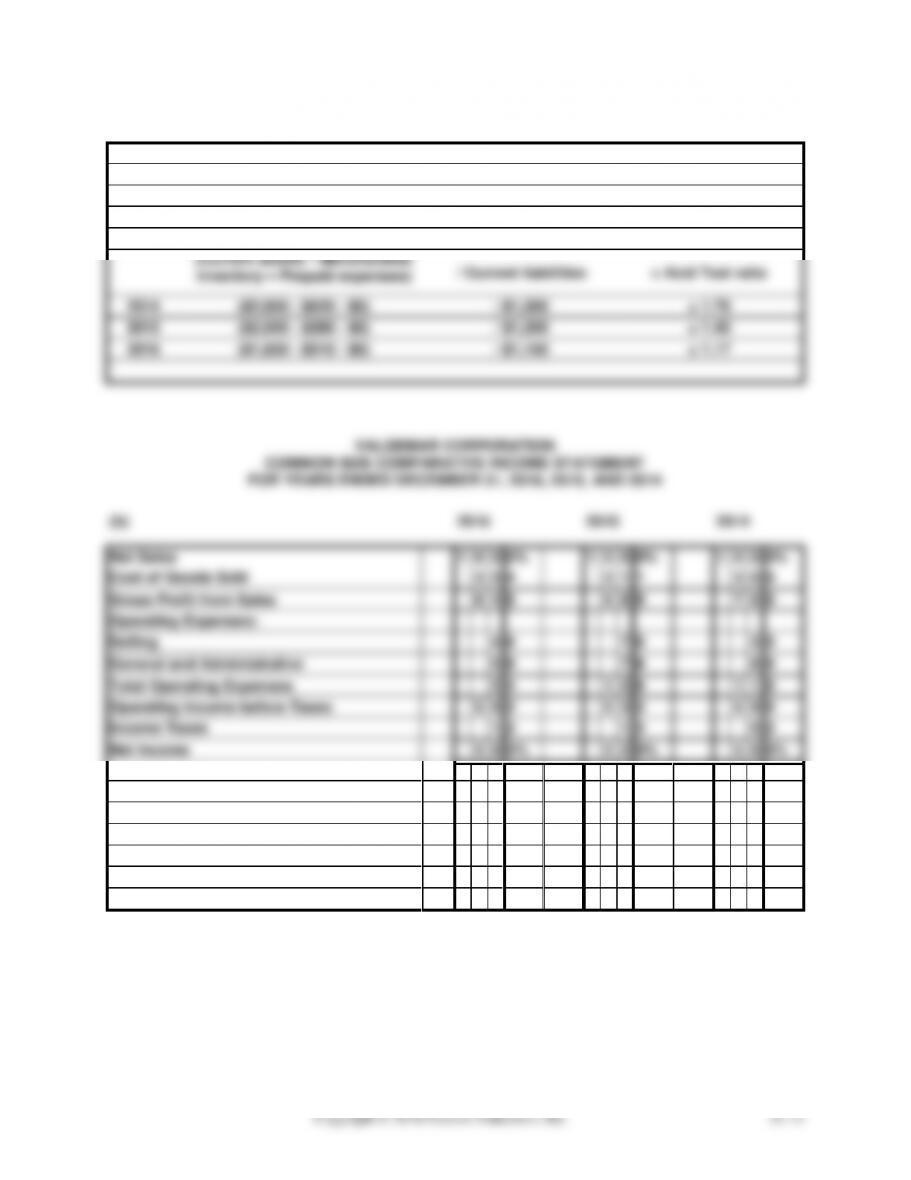
PROBLEM 22A-4
(a)
Current assets
/ Current liabilities
= Current ratio
2014
$2,900
/ $1,300
= 2.23
2015
$2,000
/ $1,200
= 1.67
2016
$1,800
/ $1,100
= 1.64
(Current assets – Merchandise
inventory – Prepaid expenses)
/ Current liabilities
= Acid Test ratio
2014
($2,900 – $620 – $0)
/ $1,300
= 1.75
2015
($2,000 – $280 – $0)
/ $1,200
= 1.43
2016
($1,800 – $510 – $0)
/ $1,100
= 1.17
VALDEMAR CORPORATION
COMMON SIZE COMPARATIVE INCOME STATEMENT
FOR YEARS ENDED DECEMBER 31, 2016, 2015, AND 2014
(b)
2016
2015
2014
Net Sales
1
0
0
0%
1
0
0
0%
1
0
0
0%
Cost of Goods Sold
3
5
4
3
1
1
3
0
0
Gross Profit from Sales
6
4
6
6
8
9
7
0
0
Operating Expenses:
Selling
4
6
7
8
3
0
General and Administrative
0
8
7
8
8
0
Total Operating Expenses
5
4
1
5
6
1
1
0
Operating Income before Taxes
5
9
2
5
3
3
5
9
0
Income Taxes
1
2
1
3
0
2
Net Income
5
8
0%
5
2
0%
5
8
8%
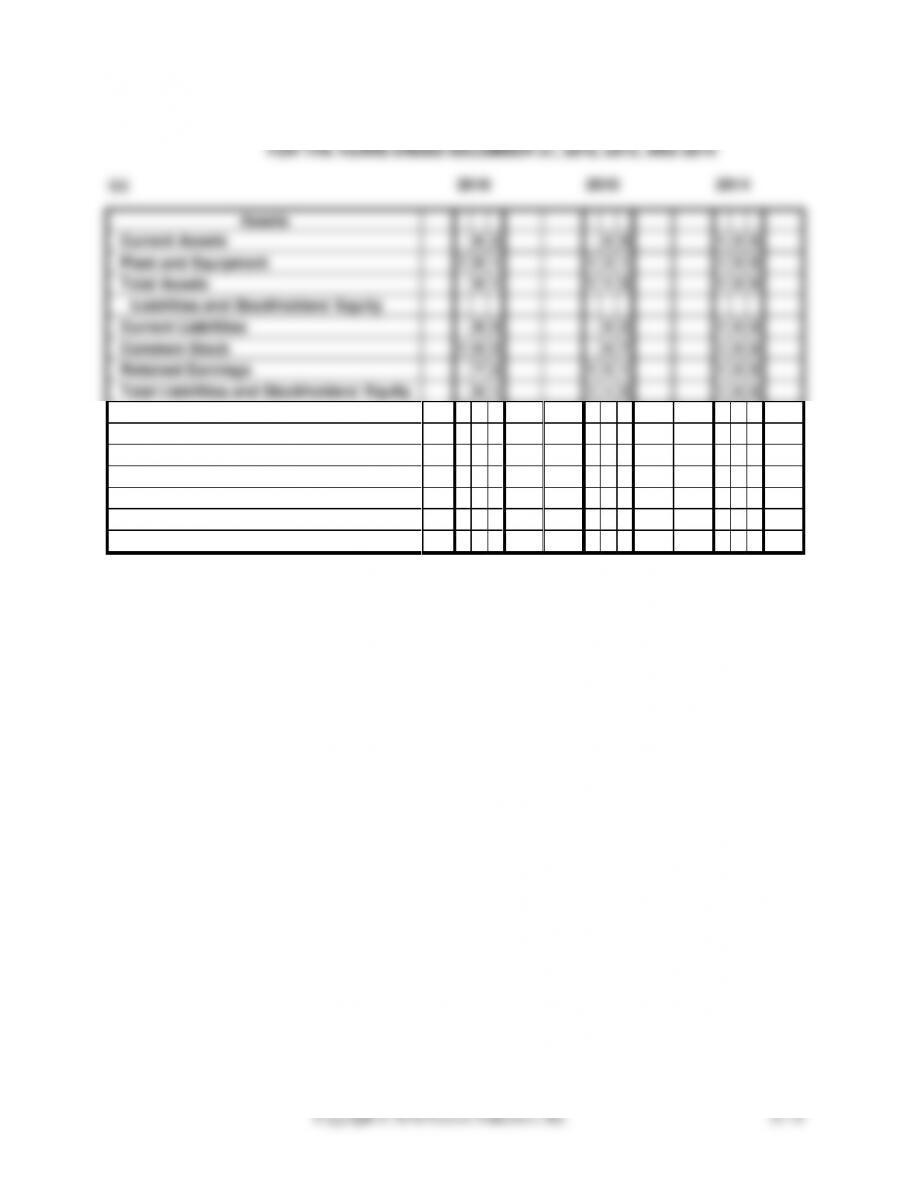
PROBLEM 22A-4 (CONCLUDED)
VALDEMAR CORPORATION
BALANCE SHEET
TREND ANALYSIS
22–15
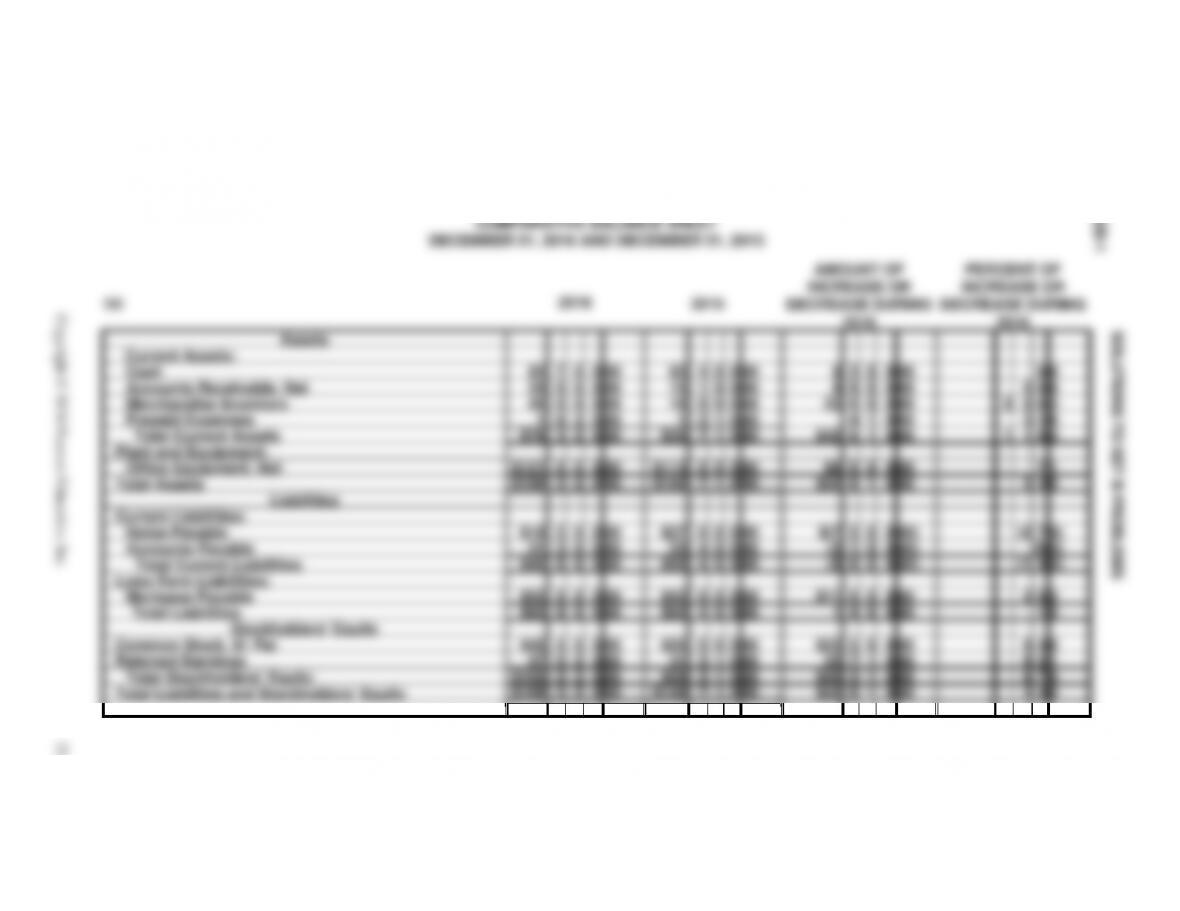
PROBLEM 22B-1
HESLER CORPORATION
COMPARATIVE BALANCE SHEET
DECEMBER 31, 2016 AND DECEMBER 31, 2015
PERCENT OF
INCREASE OR
8
9
3
9
3
1
0
8)
0)
0)
2
5
0
1
4
0
8
8
6
3
9
7
4
7
(9
9
6
1
4
2
7
4
5
0
3
1
3
(2
(1
2
9
8
8
3
2
1
AMOUNT OF
INCREASE OR
00
00
00
00
00
00
00
00)
00)
00)
00
00
00
00
00
00
0
0
0
0
0
0
0
0
0
0
0
0
0
0
0
0
0
0
0
1
1
0
1
0
0
0
0
0
0
1
1
1
3
9
0
4
6
0
6
5
1
6
0
4
5
7
2
6
$
8
33
$42
$8
$50
$(7
(2
(9
$11
1
$23
25
$49
$50
2015
00
00
00
00
00
00
00
00
00
00
00
00
00
00
00
00
0
0
0
0
0
0
0
0
0
0
0
0
0
0
0
0
0
0
0
1
1
0
1
0
0
0
0
0
0
1
1
1
4
1
0
2
7
0
7
0
4
4
0
4
0
3
3
7
$3
15
16
1
$35
$113
$148
$27
23
$50
$42
$92
$25
31
$56
$148
2016
00
00
00
00
00
00
00
00
00
00
00
00
00
00
00
00
0
0
0
0
0
0
0
0
0
0
0
0
0
0
0
0
0
0
0
2
2
0
2
0
0
0
0
0
0
2
2
2
7
0
0
6
3
0
3
5
3
8
0
8
5
0
5
3
$3
24
49
1
$78
$121
$199
$19
21
$40
$53
$93
$48
57
$105
$199
(a)
Assets
Current Assets:
Cash
Accounts Receivable, Net
Merchandise Inventory
Prepaid Expenses
TT Total Current Assets
Plant and Equipment:
Office Equipment, Net
Total Assets
Liabilities
Current Liabilities:
Notes Payable
Accounts Payable
Total Current Liabilities
Long-Term Liabilities:
Mortgage Payable
Total Liabilities
Stockholders’ Equity
Common Stock, $1 Par
Retained Earnings
Total Stockholders’ Equity
Total Liabilities and Stockholders’ Equity
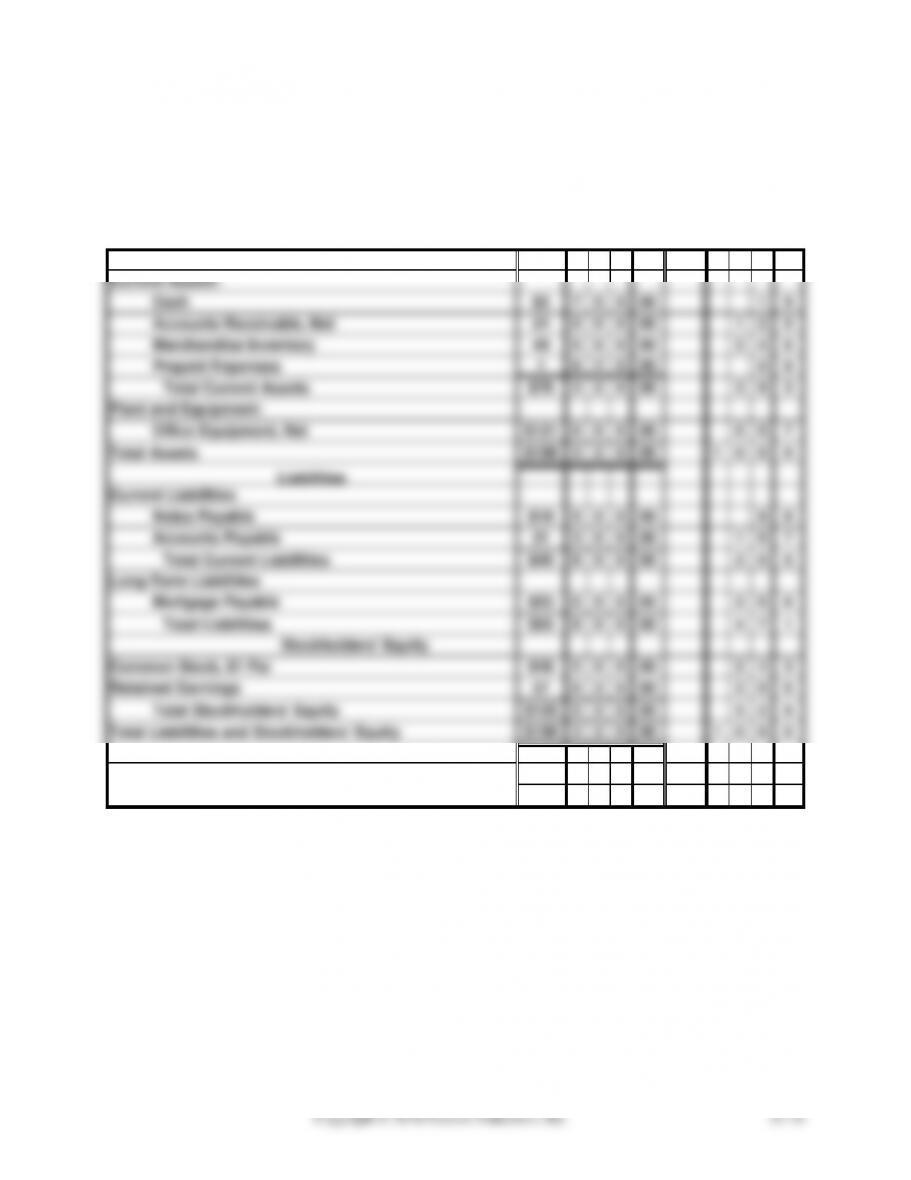
PROBLEM 22B-1 (CONCLUDED)
HESLER CORPORATION
BALANCE SHEET
AS OF DECEMBER 31, 2016
(b)
2016
Percent
Current Assets:
Cash
$3
7
0
0
00
1
9
Accounts Receivable, Net
24
0
0
0
00
1
2
0
Merchandise Inventory
49
0
0
0
00
2
4
6
Prepaid Expenses
1
6
2
0
00
0
8
Total Current Assets
$78
3
2
0
00
3
9
3
Plant and Equipment:
Office Equipment, Net
$121
0
0
0
00
6
0
7
Total Assets
$199
3
2
0
00
1
0
0
0
Liabilities
Current Liabilities
Notes Payable
$19
5
0
0
00
9
8
Accounts Payable
21
3
0
0
00
1
0
7
Total Current Liabilities
$40
8
0
0
00
2
0
5
Long-Term Liabilities
Mortgage Payable
$53
0
0
0
00
2
6
6
Total Liabilities
$93
8
0
0
00
4
7
1
Stockholders’ Equity
Common Stock, $1 Par
$48
5
0
0
00
2
4
3
Retained Earnings
57
0
2
0
00
2
8
6
Total Stockholders’ Equity
$105
5
2
0
00
5
2
9
Total Liabilities and Stockholders’ Equity
$199
3
2
0
00
1
0
0
0