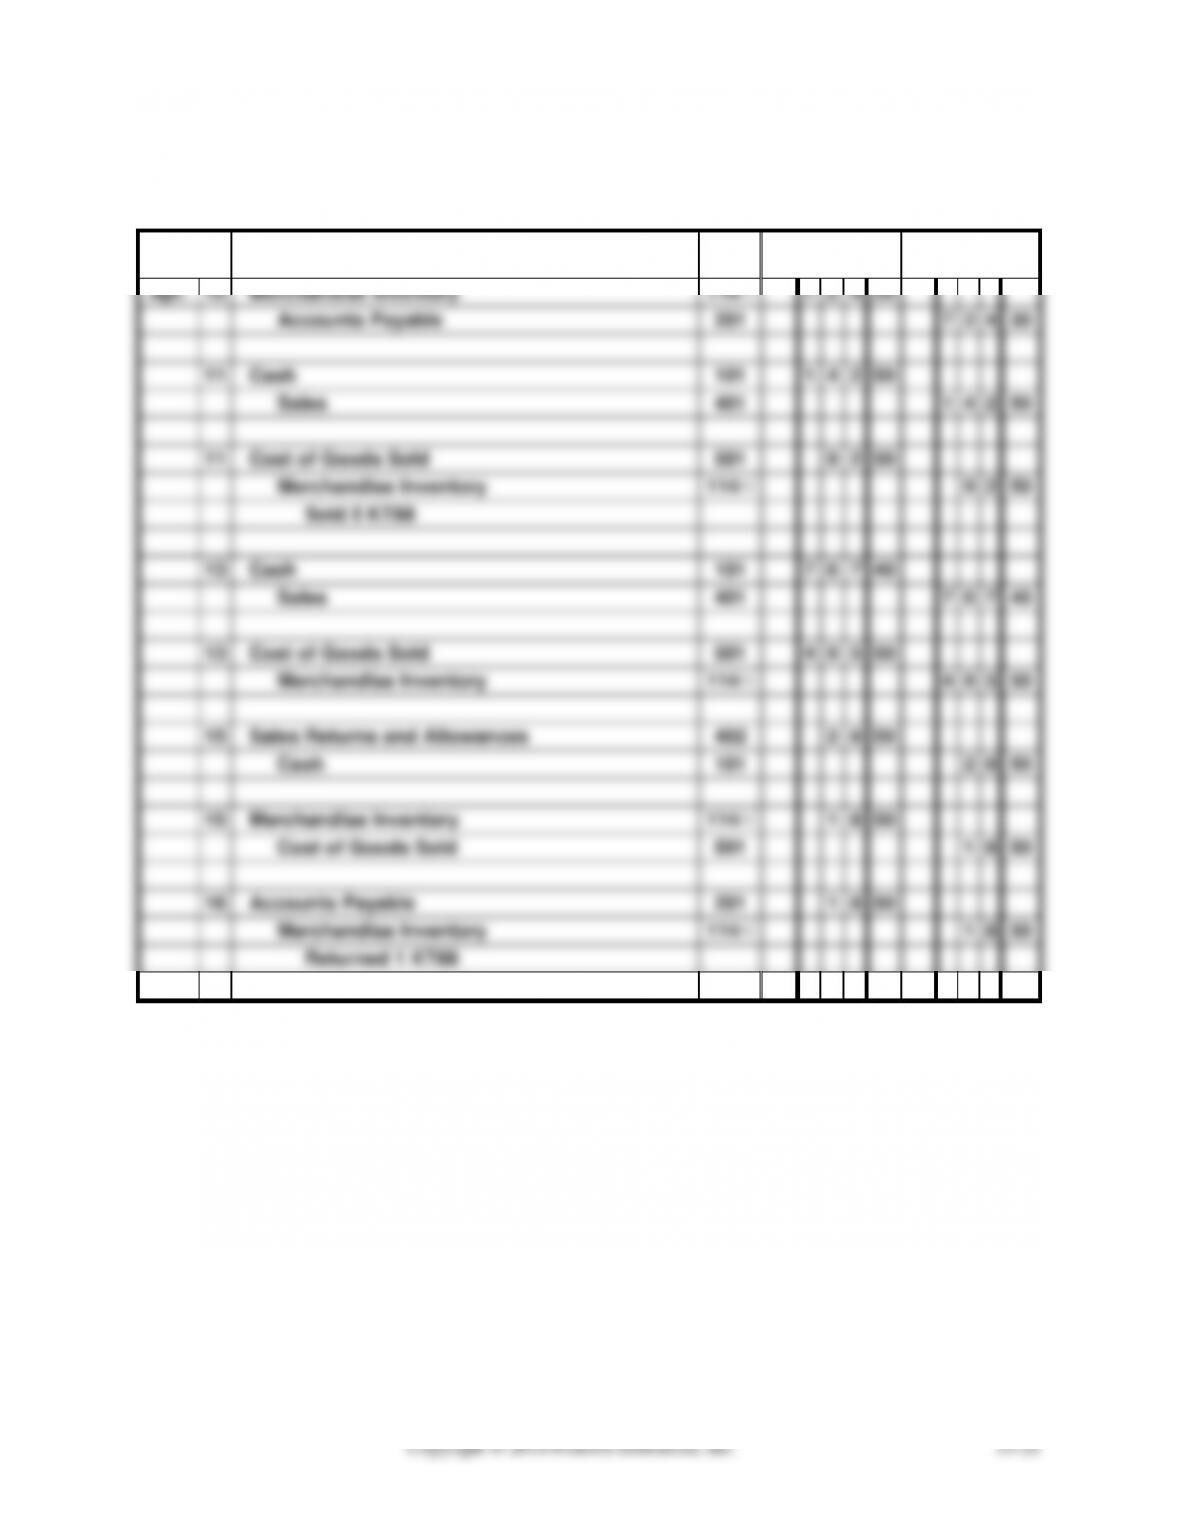
PROBLEM 15B-2
SHARON ELETRONICS
GENERAL JOURNAL
PAGE 2
Date
201X
Account Titles and Description
PR
Dr.
Cr.
Apr.
10
Merchandise Inventory
114/√
7
2
4
30
Accounts Payable
201
7
2
4
30
11
Cash
101
1
4
2
50
Sales
401
1
4
2
50
11
Cost of Goods Sold
501
9
2
50
Merchandise Inventory
114/√
9
2
50
Sold 5 KT88
13
Cash
101
7
6
7
40
Sales
401
7
6
7
40
13
Cost of Goods Sold
501
4
9
5
50
Merchandise Inventory
114/√
4
9
5
50
15
Sales Returns and Allowances
402
2
8
50
Cash
101
2
8
50
15
Merchandise Inventory
114/√
1
8
50
Cost of Goods Sold
501
1
8
50
16
Accounts Payable
201
1
8
50
Merchandise Inventory
114/√
1
8
50
Returned 1 KT88
PROBLEM 15B-2 (CONTINUED)
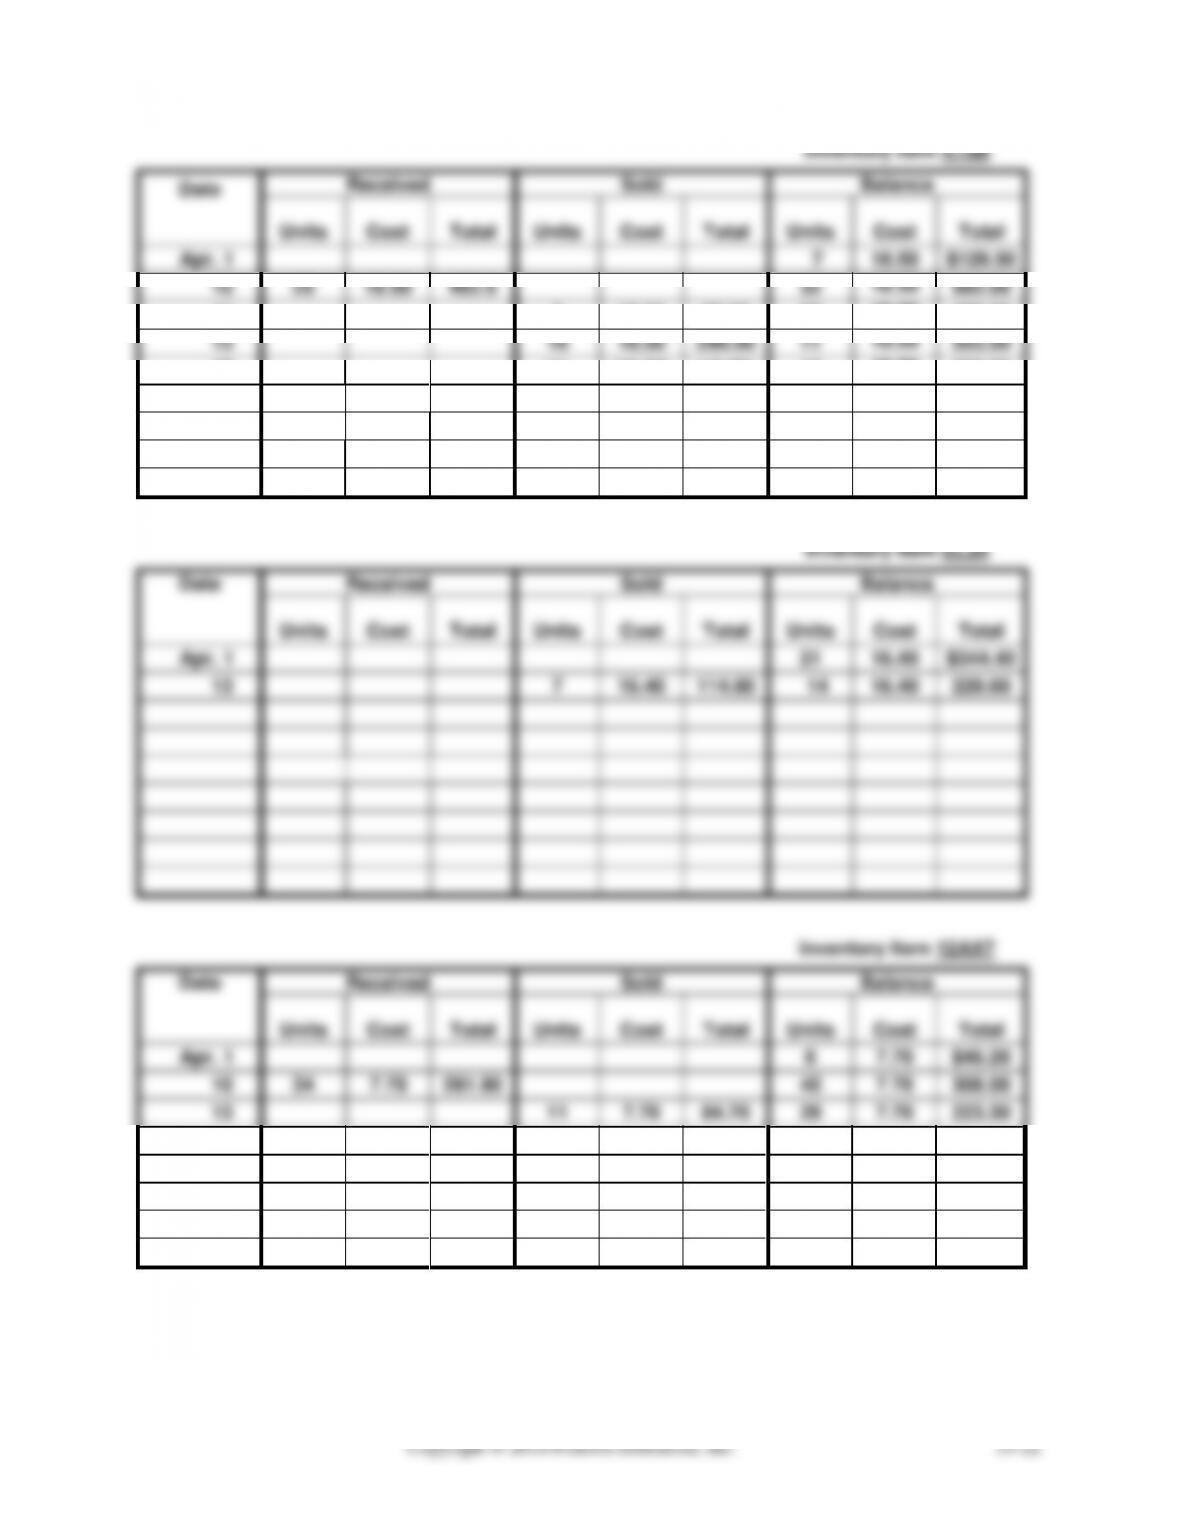
Inventory Item KT88
Date
Received
Sold
Balance
Units
Cost
Total
Units
Cost
Total
Units
Cost
Total
Apr. 1
7
18.50
$129.50
10
25
18.50
462.5
32
18.50
592.00
11
5
18.50
92.50
27
18.50
499.50
13
16
18.50
296.00
11
18.50
203.50
15
(1)
(18.50)
(18.50)
12
18.50
222.00
16
(1)
(18.50)
(18.50)
11
18.50
203.50
Inventory Item EL34
Date
Received
Sold
Balance
Units
Cost
Total
Units
Cost
Total
Units
Cost
Total
Apr. 1
21
16.40
$344.40
13
7
16.40
114.80
14
16.40
229.60
Units
Cost
Total
Units
Cost
Total
Units
Cost
Total
Apr. 1
6
$46.20
10
34
261.80
40
308.00
13
11
84.70
29
223.30
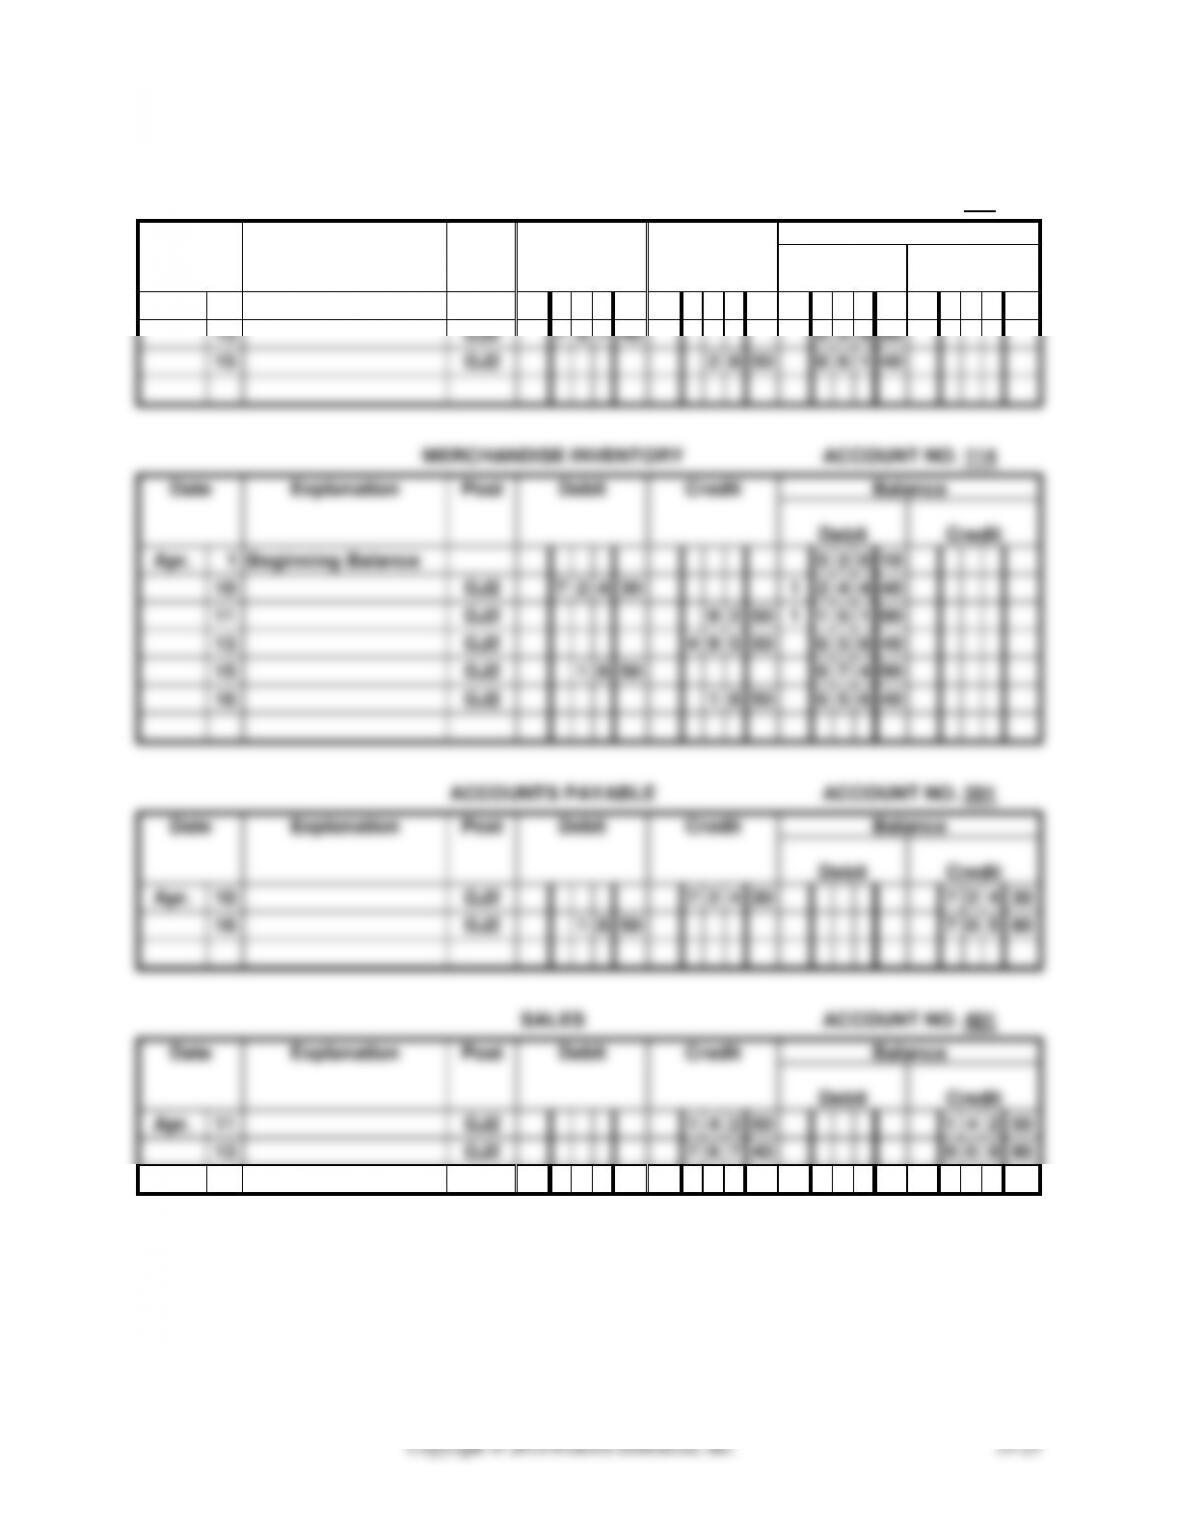
PROBLEM 15B-2 (CONTINUED)
GENERAL LEDGER
CASH
ACCOUNT NO. 101
Date
Explanation
Post
Debit
Credit
Balance
Debit
Credit
Apr.
11
GJ2
1
4
2
50
1
4
2
50
13
GJ2
7
6
7
40
9
0
9
90
15
GJ2
2
8
50
8
8
1
40
MERCHANDISE INVENTORY
ACCOUNT NO. 114
Date
Explanation
Post
Debit
Credit
Balance
Debit
Credit
Apr.
1
Beginning Balance
5
2
0
10
10
GJ2
7
2
4
30
1
2
4
4
40
11
GJ2
9
2
50
1
1
5
1
90
13
GJ2
4
9
5
50
6
5
6
40
15
GJ2
1
8
50
6
7
4
90
16
GJ2
1
8
50
6
5
6
40
ACCOUNTS PAYABLE
ACCOUNT NO. 201
Date
Explanation
Post
Debit
Credit
Balance
Debit
Credit
Apr.
10
GJ2
7
2
4
30
7
2
4
30
16
GJ2
1
8
50
7
0
5
80
SALES
ACCOUNT NO. 401
Date
Explanation
Post
Debit
Credit
Balance
Debit
Credit
Apr.
11
GJ2
1
4
2
50
1
4
2
50
13
GJ2
7
6
7
40
9
0
9
90
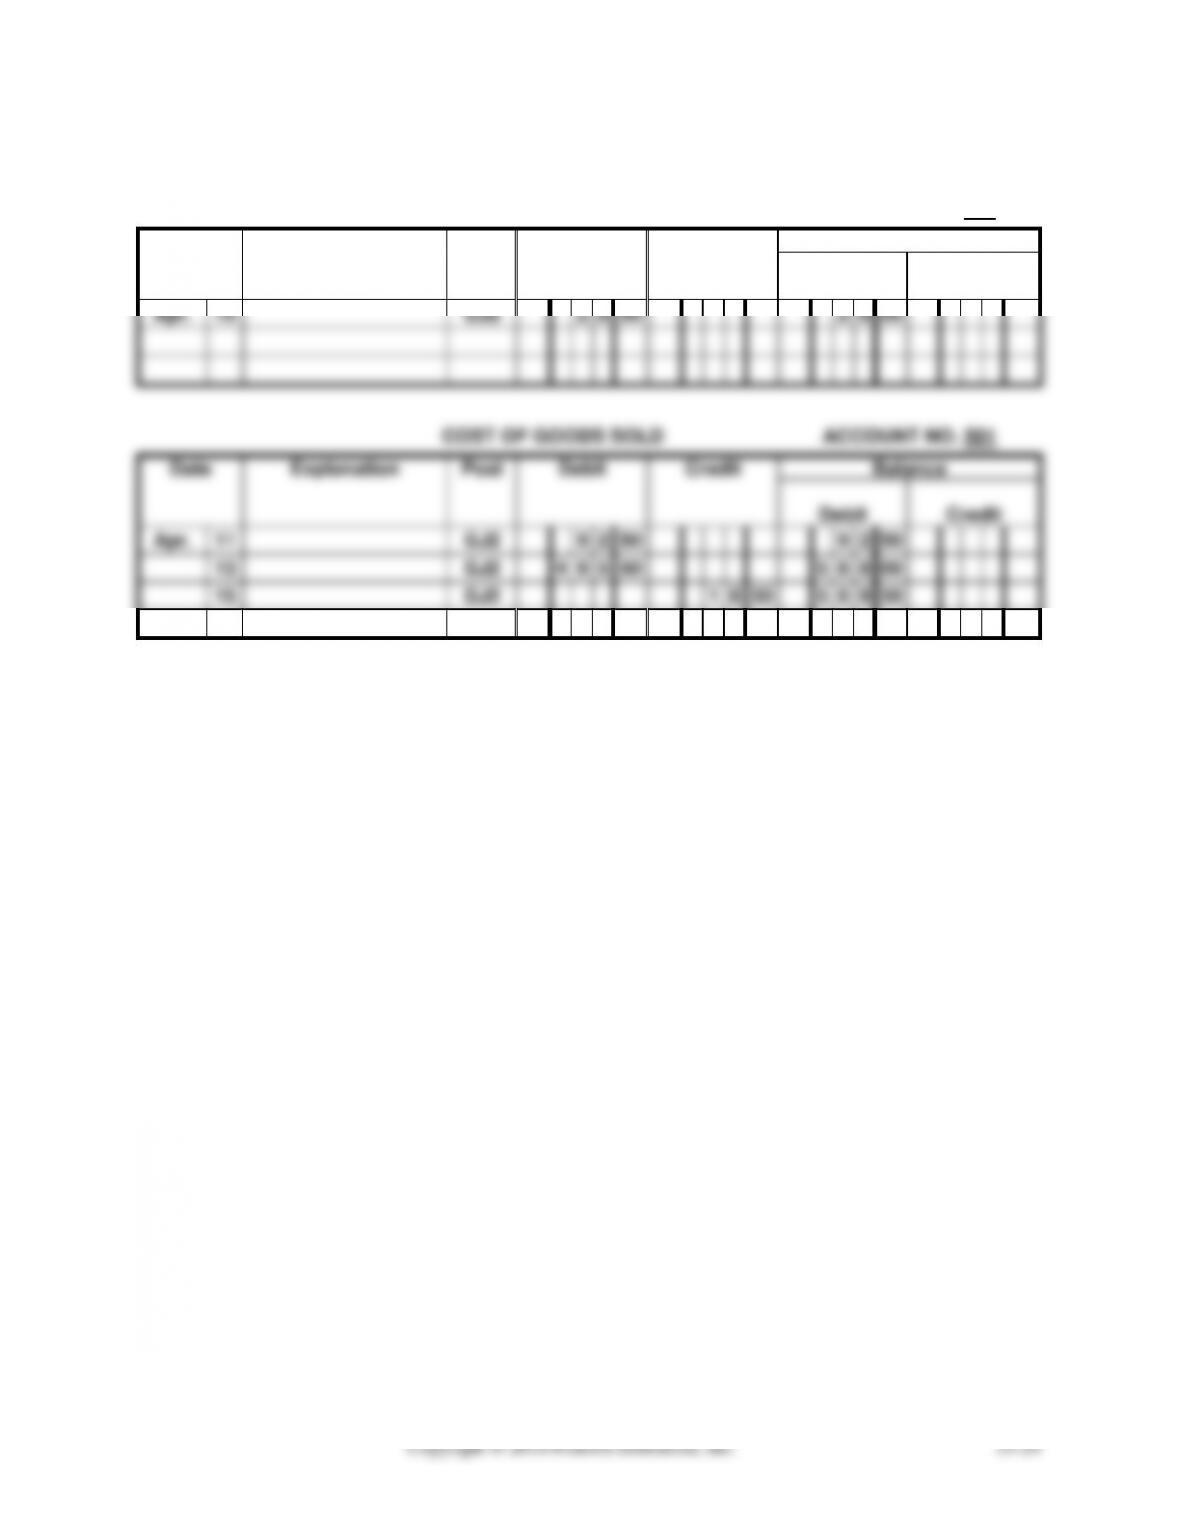
PROBLEM 15B-2 (CONCLUDED)
SALES RETURNS AND ALLOWANCES
ACCOUNT NO. 402
Date
Explanation
Post
Debit
Credit
Balance
Debit
Credit
Apr.
15
GJ2
2
8
50
2
8
50
COST OF GOODS SOLD
ACCOUNT NO. 501
Date
Explanation
Post
Debit
Credit
Balance
Debit
Credit
Apr.
11
GJ2
9
2
50
9
2
50
13
GJ2
4
9
5
50
5
8
8
00
15
GJ2
1
8
50
5
6
9
50
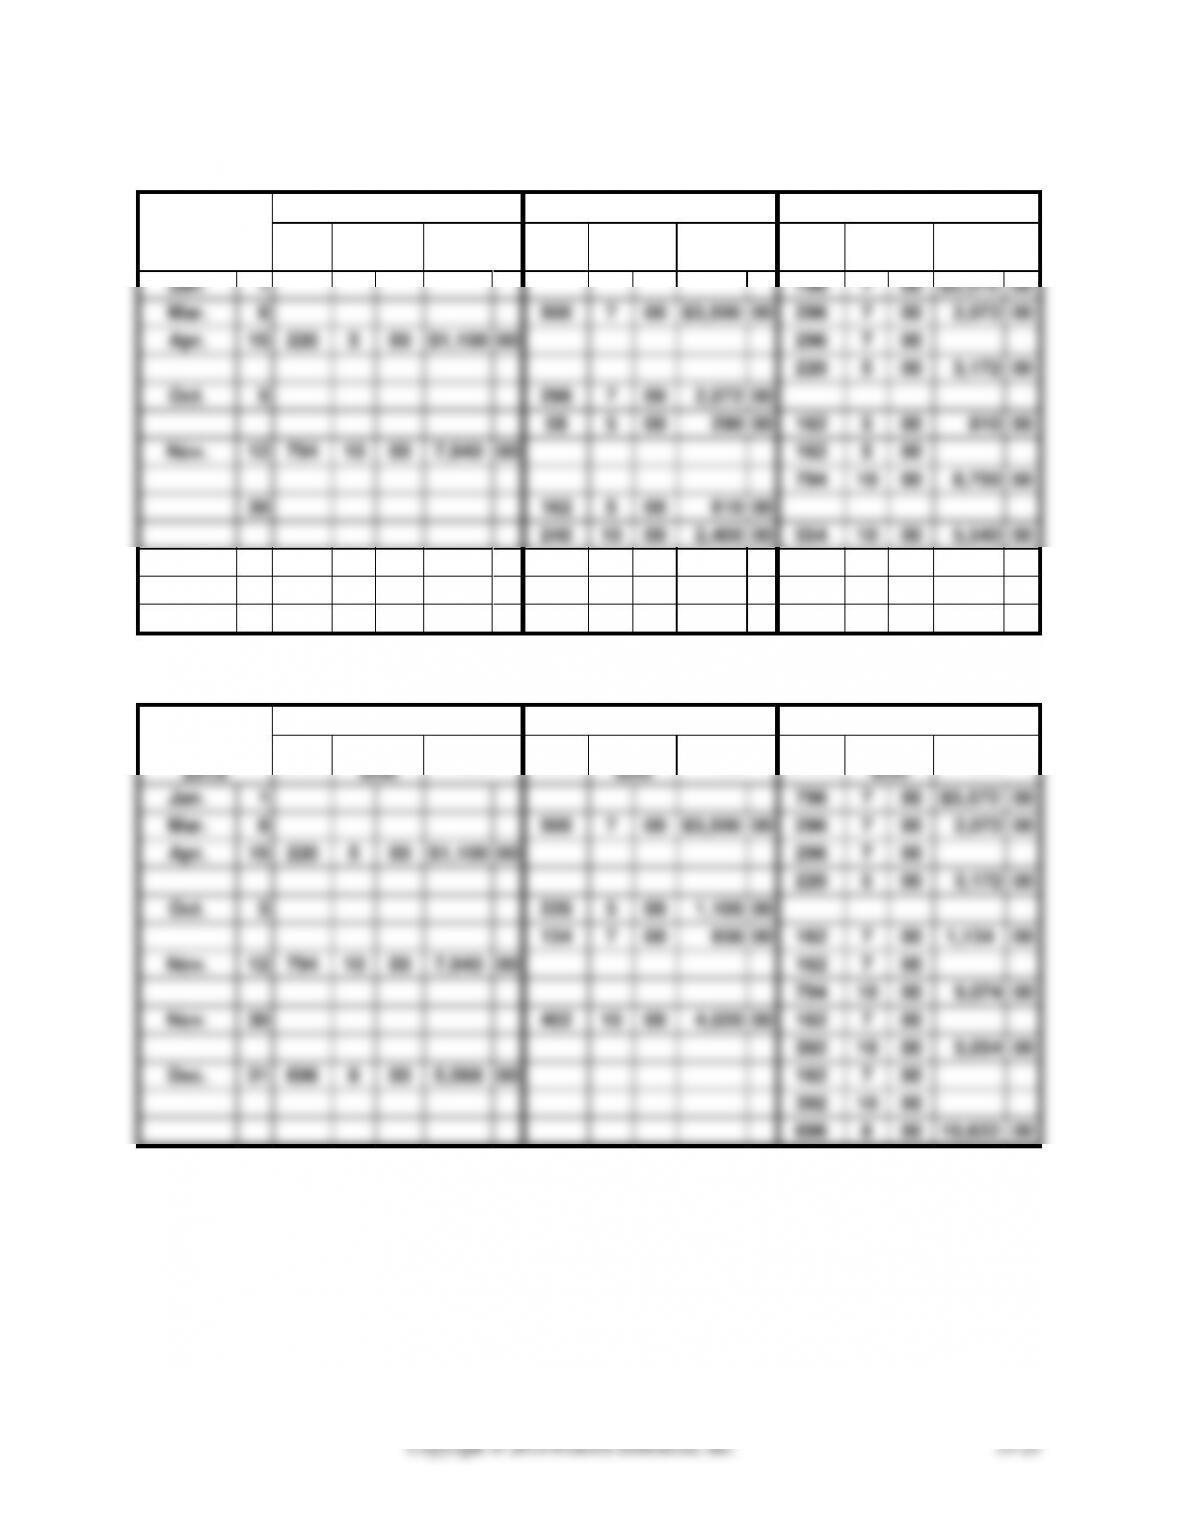
PROBLEM 15B-3
a. FIFO
Date
201X
Received
Sold
Balance
Units
Cost per
Unit
Total
Units
Cost per
Unit
Total
Units
Cost per
Unit
Total
Jan.
1
796
7
00
$5,572
00
Mar.
8
500
7
00
$3,500
00
296
7
00
2,072
00
Apr.
15
220
5
00
$1,100
00
296
7
00
220
5
00
3,172
00
Oct.
5
296
7
00
2,072
00
58
5
00
290
00
162
5
00
810
00
Nov.
12
794
10
00
7,940
00
162
5
00
794
10
00
8,750
00
30
162
5
00
810
00
240
10
00
2,400
00
554
10
00
5,540
00
Dec.
31
696
8
00
5,568
00
554
10
00
696
8
00
11,108
00
b. LIFO
Date
201X
Received
Sold
Balance
Units
Cost per
Unit
Total
Units
Cost per
Unit
Total
Units
Cost per
Unit
Total
Jan.
1
796
7
00
$5,572
00
Mar.
8
500
7
00
$3,500
00
296
7
00
2,072
00
Apr.
15
220
5
00
$1,100
00
296
7
00
220
5
00
3,172
00
Oct.
5
220
5
00
1,100
00
134
7
00
938
00
162
7
00
1,134
00
Nov.
12
794
10
00
7,940
00
162
7
00
794
10
00
9,074
00
Nov.
30
402
10
00
4,020
00
162
7
00
392
10
00
5,054
00
Dec.
31
696
8
00
5,568
00
162
7
00
392
10
00
696
8
00
10,622
00
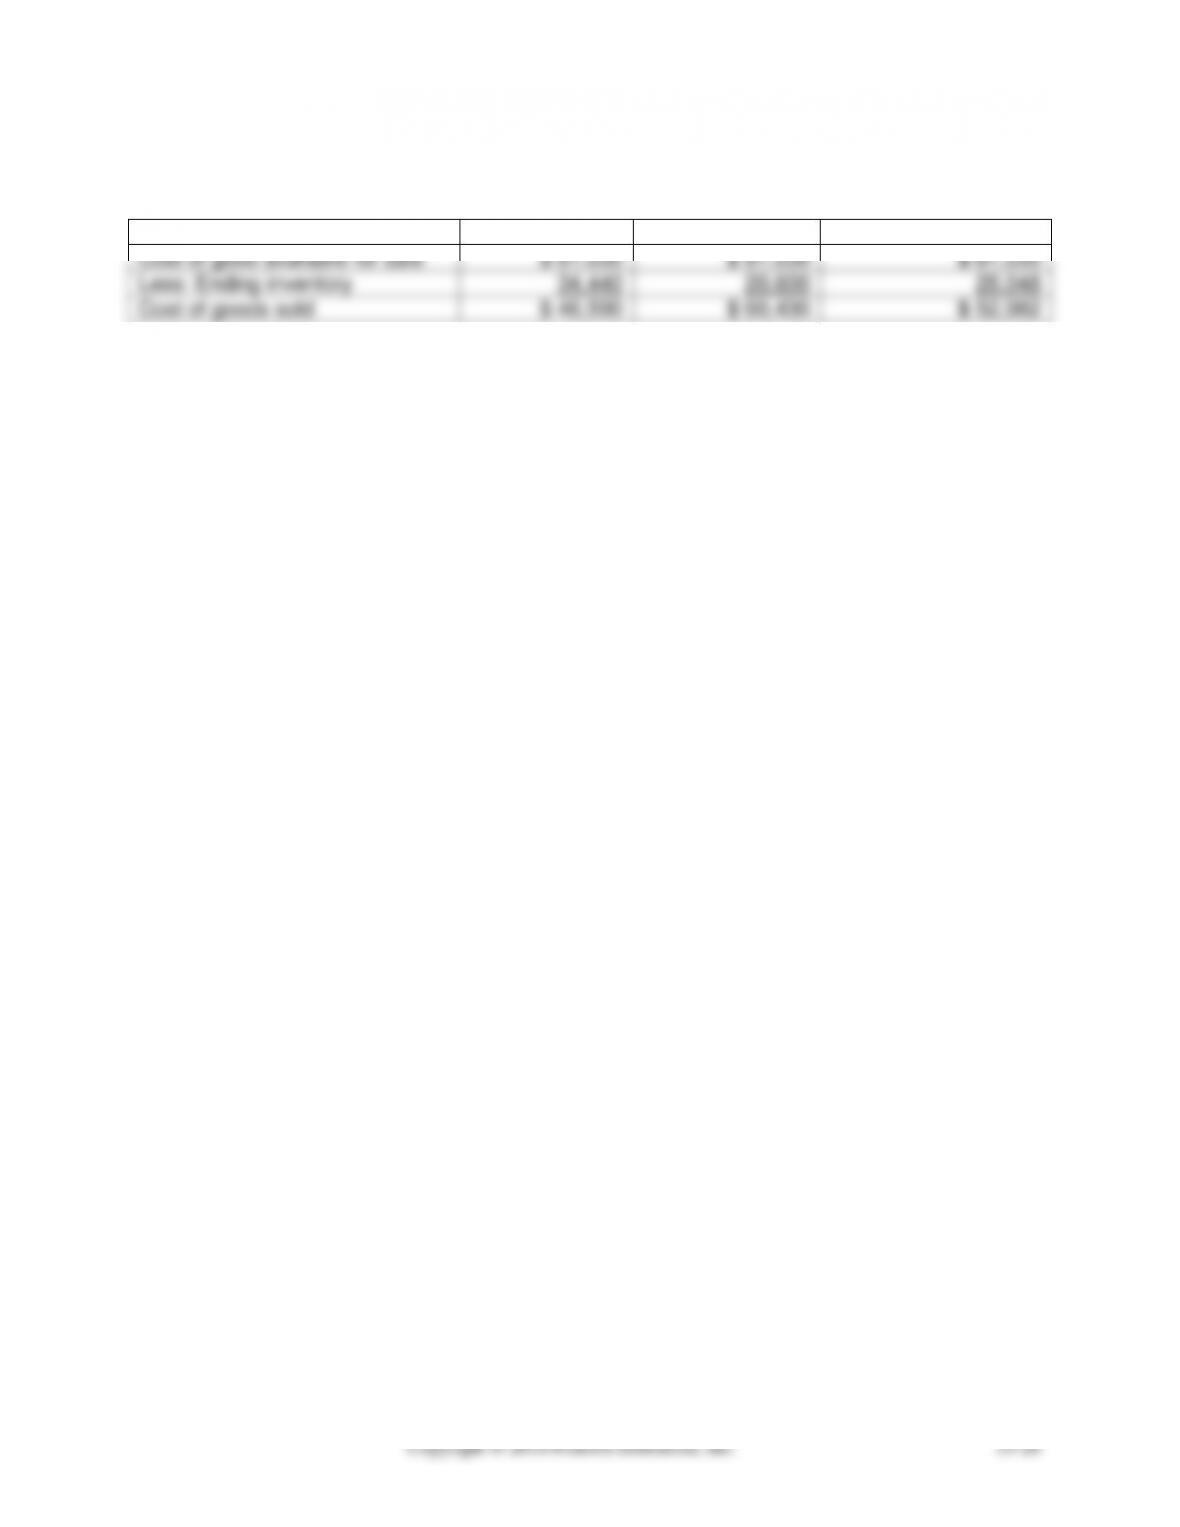
PROBLEM 15B-4
(a) FIFO
(b) LIFO
(c) Weighted-Average
Cost of good available for sale
$ 81,030
$ 81,030
$ 81,030
Less: Ending inventory
34,440
20,600
28,048
Cost of goods sold
$ 46,590
$ 60,430
$ 52,982
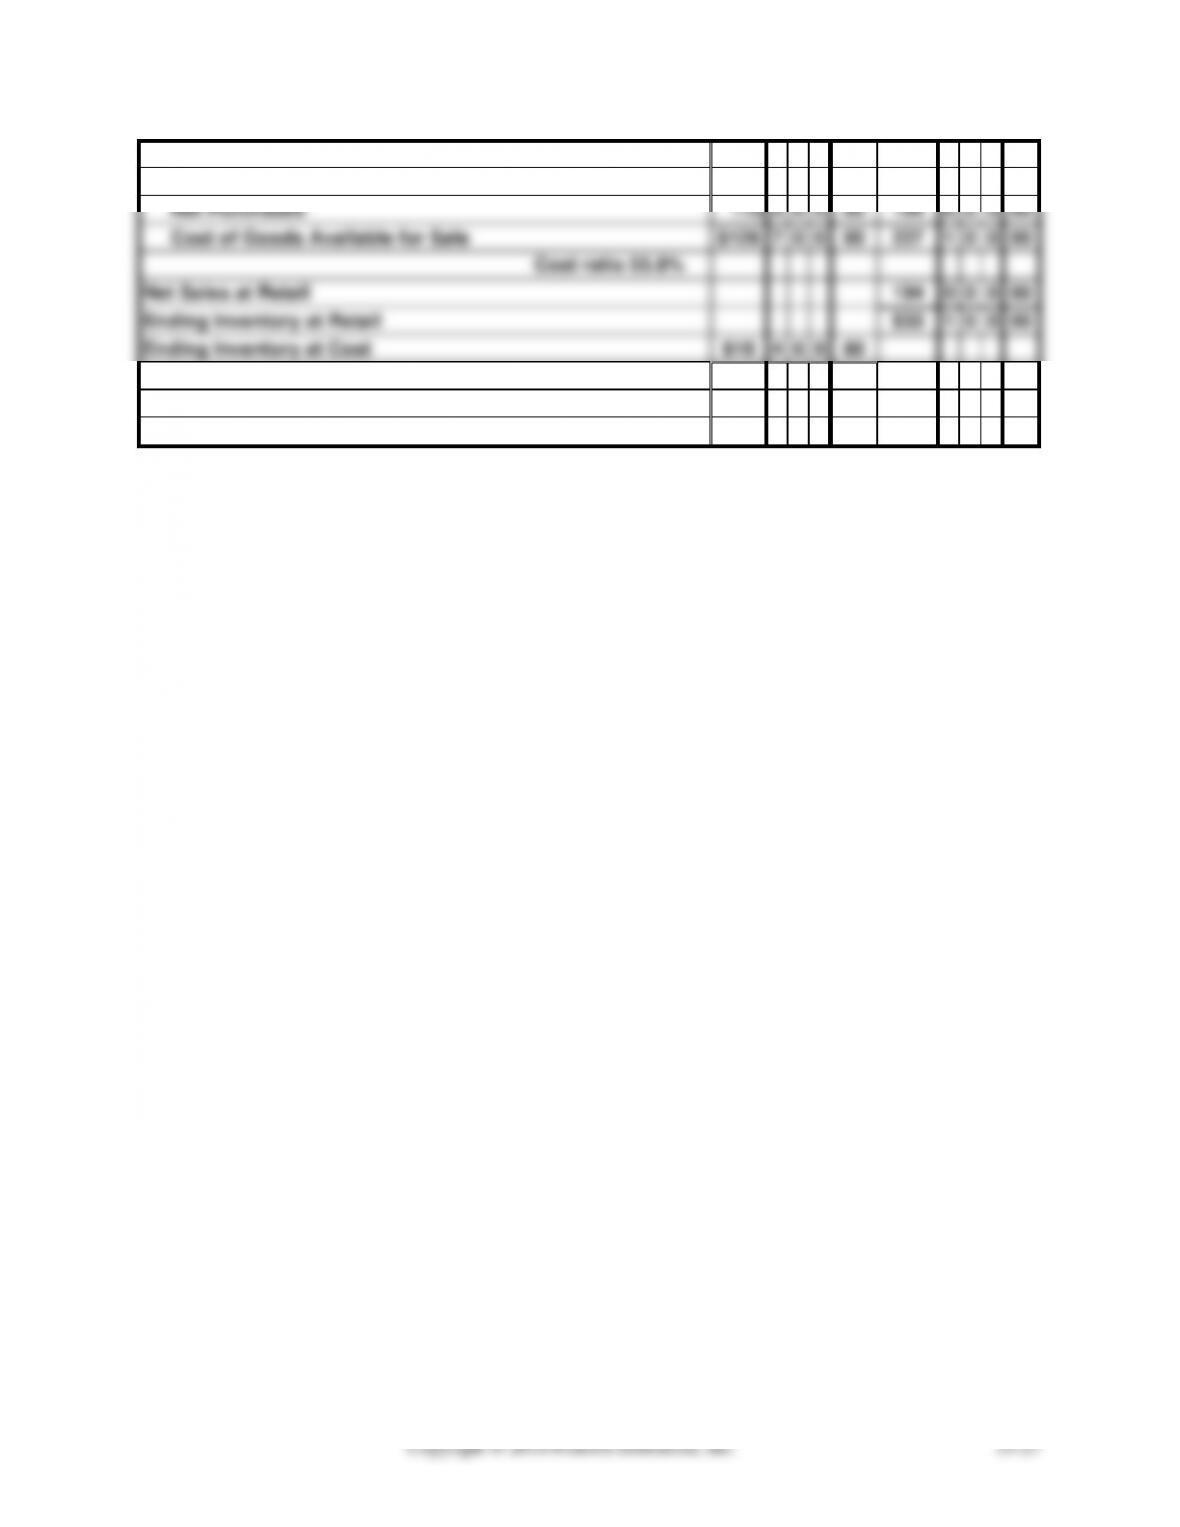
PROBLEM 15B-5
Goods Available for Sale:
Beginning Inventory
$16
3
0
0
00
$32
5
0
0
00
Net Purchases
110
4
0
0
00
194
6
0
0
00
Cost of Goods Available for Sale
$126
7
0
0
00
227
1
0
0
00
Cost ratio 55.8%
Net Sales at Retail
194
0
0
0
00
Ending Inventory at Retail
$33
1
0
0
00
Ending Inventory at Cost
$18
4
6
9
80
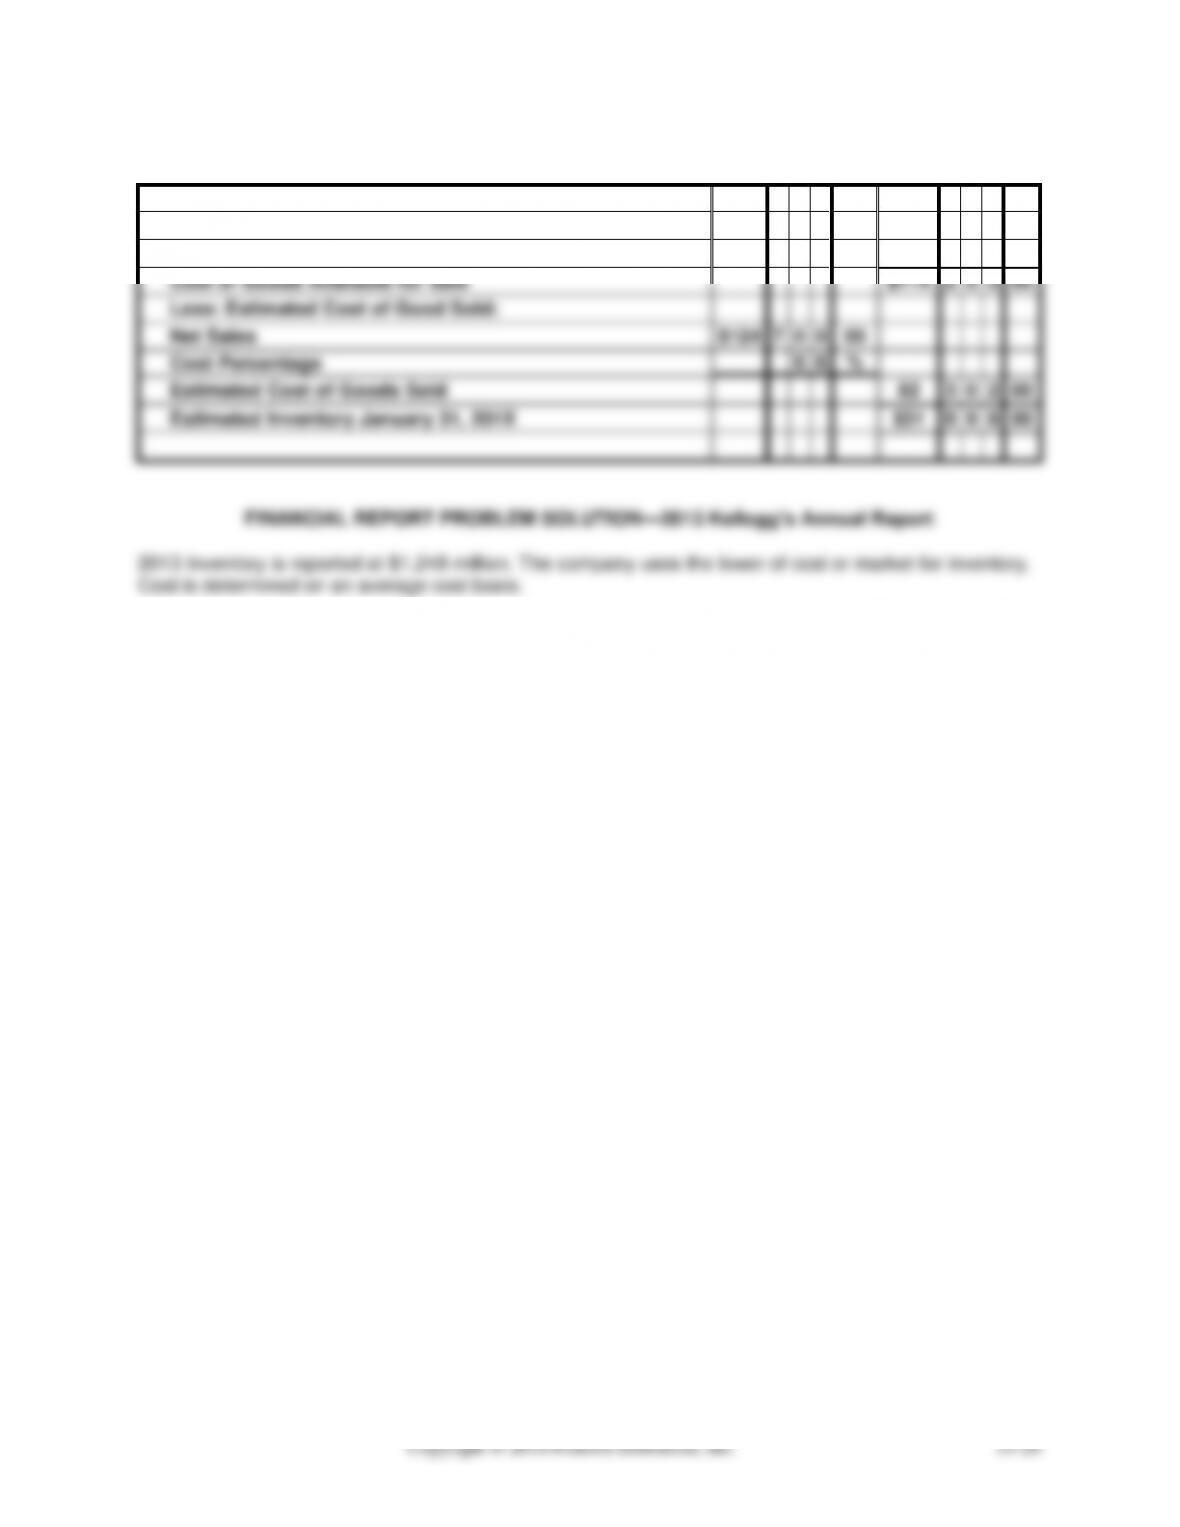
PROBLEM 15B-6
Goods Available for Sale:
Inventory January 1, 201X
$39
3
0
0
00
Net Purchases
74
9
0
0
00
Cost of Goods Available for Sale
$114
2
0
0
00
Less: Estimated Cost of Good Sold:
Net Sales
$124
7
0
0
00
Cost Percentage
6
6
%
Estimated Cost of Goods Sold
82
3
0
2
00
Estimated Inventory January 31, 201X
$31
8
9
8
00
FINANCIAL REPORT PROBLEM SOLUTION—2013 Kellogg’s Annual Report
2013 Inventory is reported at $1,248 million. The company uses the lower of cost or market for inventory.
Cost is determined on an average cost basis.
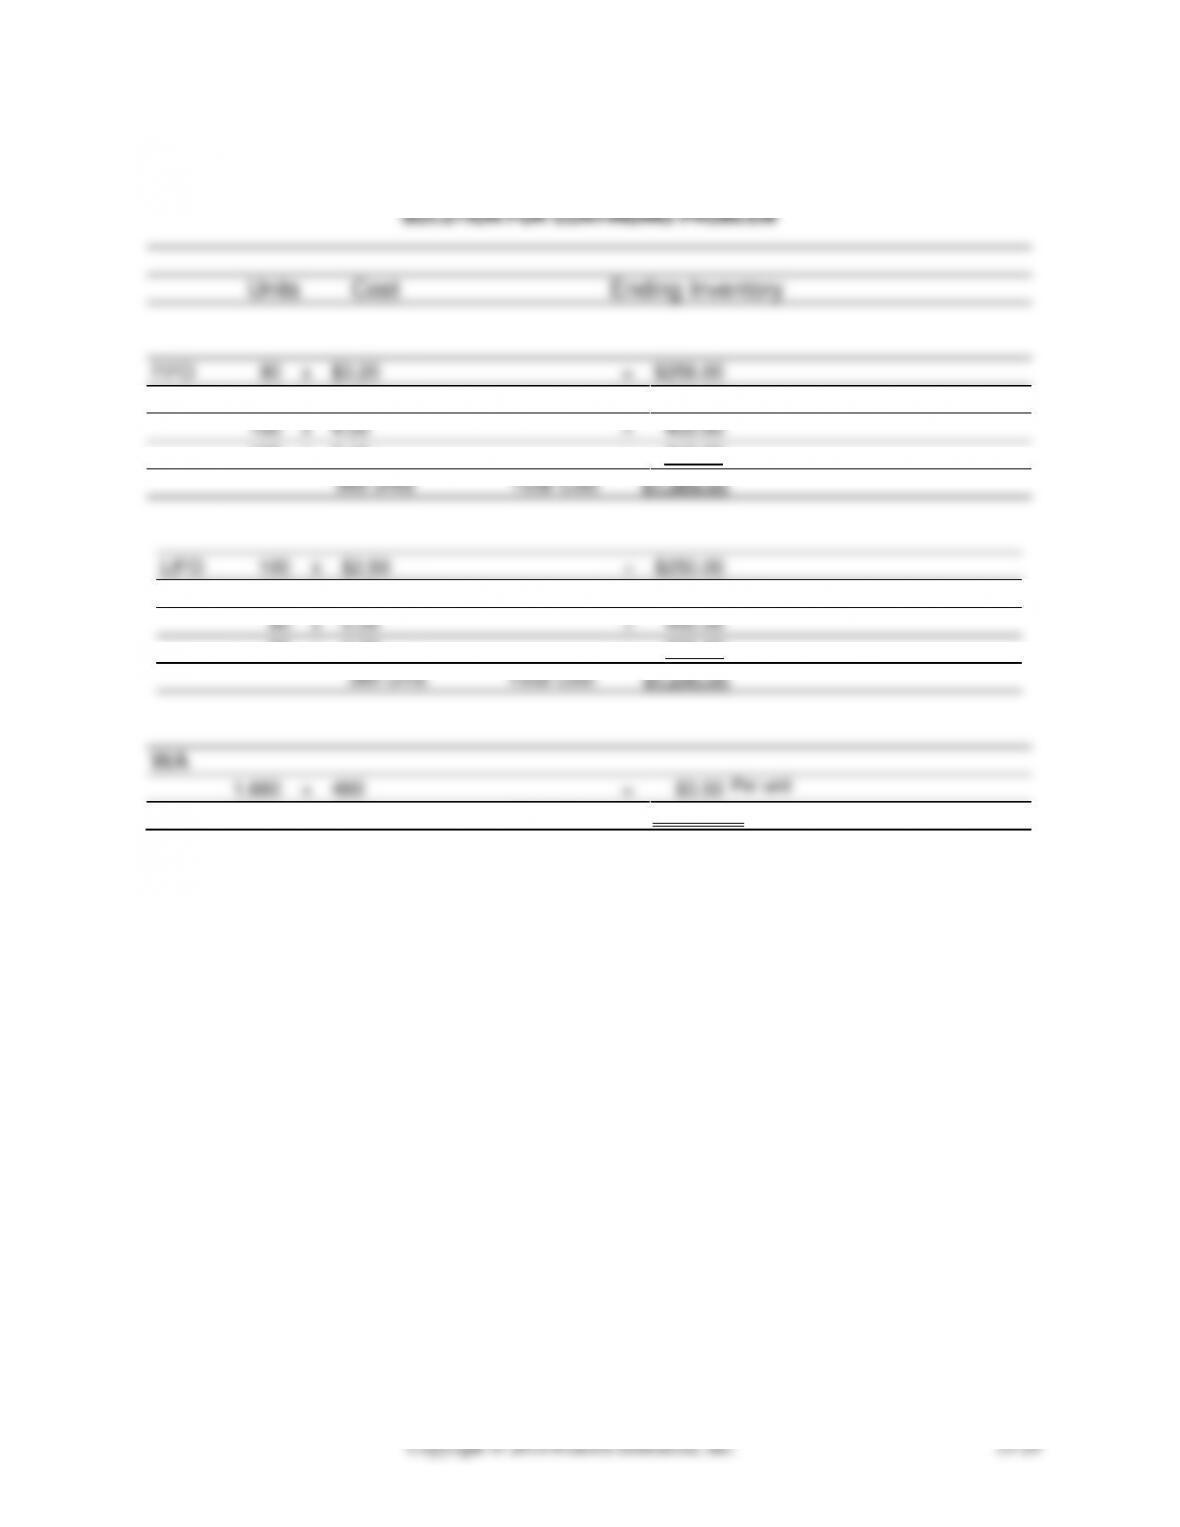
CONTINUING PROBLEM: ON THE JOB—Smith Computer Center Solution
SOLUTION FOR CONTINUING PROBLEM
Units Cost
Ending Inventory
FIFO
80
x
$3.20
=
$256.00
80
x
5.00
=
400.00
100
x
4.00
=
400.00
100
x
3.10
=
310.00
360 units Total Cost
$1,366.00
LIFO
100
x
$2.50
=
$250.00
100
x
3.20
=
320.00
80
x
5.00
=
400.00
80
x
4.00
=
320.00
360 units Total Cost $1,290.00
WA
1,680
÷
480
=
$3.50
Per unit
$3.50
x
360
Total Cost
=
$1,260.00